

Abstract
Here we report the synthesis and characterization of a membrane-impermeant fluorogenic probe, hydropropidine (HPr+), the reduction product of propidium iodide, for detecting extracellular superoxide (O2·−). HPr+ is a positively-charged water-soluble analog of hydroethidine (HE), a fluorogenic probe commonly used for monitoring intracellular O2·−. We hypothesized that the presence of a highly localized positive charge on the nitrogen atom would impede cellular uptake of HPr+ and allow for exclusive detection of extracellular O2·−. Our results indicate that O2·− reacts with HPr+ (k = 1.2 × 10⁴ M−1s−1) to form exclusively 2-hydroxypropidium (2-OH-Pr++) in cell-free and cell-based systems. This reaction is analogous to the reaction between HE and O2·− (Zhao H et al. Free Radic Biol Med 34:1359-68, 2003). During the course of this investigation, we also reassessed the rate constants for the reactions of O2·− with HE and its mitochondria targeted analog (Mito-HE or Mito-SOX Red®) and addressed the discrepancies between the present values and those reported previously by us. Our results indicate that the rate constant between O2·− and HPr+ is slightly higher than that of HE and O2·− and is closer to that of Mito-HE and O2·−. Similar to HE, HPr+ undergoes oxidation in the presence of various oxidants (peroxynitrite – derived radicals, Fenton’s reagent, and ferricytochrome c) forming the corresponding propidium dication (Pr++) and the dimeric products (e.g., Pr++-Pr++). In contrast to HE, there was very little intracellular uptake of HPr+. We conclude that HPr+ is a useful probe for detecting O2·− and other one-electron oxidizing species in an extracellular milieu.
Keywords: superoxide, fluorescent probes, hydroethidine, hydropropidine, propidium, NADPH oxidase
Introduction
Hydroethidine or dihydroethidium, (HE or DHE) has become the probe of choice for detecting intracellular superoxide radical anion (O2·−) (1–3). The diagnostic product of the reaction between HE and O2·− is 2-hydroxyethidium (2-OH-E+) (1,2,4,5). Although other oxidants (hydroxyl, nitrogen dioxide and carbonate radicals derived from peroxynitrite) also react with HE to form different oxidation products, O2·− remains as the only viable reactive oxygen species that reacts with HE to form 2-OH-E+ (6,7,8). In an effort to selectively detect extracellular O2·−, we synthesized hydropropidine (HPr+), a positively-charged, water-soluble analog of HE (Fig. 1). We reasoned that the presence of a highly localized positive charge on the nitrogen atom of the alkyl group will prevent the cellular uptake of HPr+. Hydropropidine was prepared from a two-electron reduction of propidium iodide (Pr++•2I−), a cell-impermeant fluorescent molecule (Fig. 1) that is used frequently in tissue staining and in the identification of dead cells (9). Due to the structural similarity between HE and HPr+, we further reasoned that the reaction chemistry between HPr+ and O2·− and other oxidants might be similar to that of HE.
Figure 1.

Chemical structures of hydropropidine, 2-hydroxypropidium, other oxidation products of hydropropidine and other selected agents.
In this study, we report that the reaction between HPr+ and O2·− yields 2-hydroxypropidium (2-OH-Pr+) (Fig. 1) as a diagnostic marker product in cell-free and cell-based systems. The rate constant for the reaction between O2·− and HPr+ was measured to be slightly higher than that of HE and O2·−. In addition, we reassessed the rate constant parameters previously reported for HE and Mito-SOX Red® with O2·− (1,10,11). Results indicate that these rate constants were overestimated by 30 to 100-fold in our previous studies (1,10). Reasons for these discrepancies are discussed. Similar to HE, HPr+ also undergoes oxidation in the presence of other oxidants (derived from peroxynitrite and peroxidases) forming propidium (Pr++) and characteristic dimeric products such as dipropidium (Pr++-Pr++) (Fig. 1). Biological implications for the use of this novel probe in monitoring extracellular generation of O2·− and other one-electron oxidizing species from NADPH oxidases are discussed.
Materials and Methods
Chemicals
Xanthine oxidase (XO) from cow milk was purchased from Roche Diagnostics GmbH. Hydroethidine (HE) and mito-hydroethidine (Mito-HE or Mito-SOX Red®) were purchased from Invitrogen. Superoxide dismutase (bovine erythrocytes), ferricytochrome c (equine heart), propidium iodide, hypoxanthine (HX), phorbol 12-myristate 13-acetate (PMA), potassium nitrosodisulfonate (Fremy’s salt), chloranil, menadione bisulfite sodium salt (MN), hydrogen peroxide, K3FeCN6, KH2PO4, K2PO4, FeSO4 were purchased at the highest available purity from Sigma Aldrich. Trifluoroacetic acid was purchased from Thermo Scientific. Catalase (beef liver) was purchased from Boehringer Mannheim. Peroxynitrite was prepared by reacting nitrite with H2O2, according to the previously published procedure (12). 5-Tert-butoxycarbonyl-5-methyl-1-pyrroline N-oxide (BMPO) was synthesized as described previously (13).
Syntheses and preparation of probes and reagents
Hydropropidine was prepared by reducing propidium in the presence of sodium borohydride. Sodium borohydride (6 mg, 0.16 mmol) dissolved in 1 mL of MeOH was added drop-wise to a solution of propidium iodide (0.1 g, 0.15 mmol) in methanol (5 mL) at 0°C. After 30 minutes, the reaction product was extracted with CH2Cl2. The extract was washed with water and brine and dried over Na2SO4. The solvent was removed under vacuum to give the hydropropidine cation (80 mg, 0.14 mmol, 98%). The crude product was purified by HPLC, as described below for 2-hydroxypropidium. HPr+ stock solutions (20 mM) were prepared in DMSO under anaerobic conditions, and small aliquots (20 μl) were stored at −80°C. All solutions containing HPr+ were protected from light. 2-Hydroxypropidium (2-OH-Pr++) was synthesized by reacting HPr+ with Fremy’s salt (4). Due to the instability of Fremy’s salt in acidic solutions, stock solutions were prepared in phosphate buffer (100 mM, pH 7.5) containing 0.2 mM DTPA. Details of synthesis are identical to our previously published procedure for 2-hydroxyethidium (4). The final reaction mixture contained 2-OH-Pr++ as a major product, and propidium as a minor product. 2-OH-Pr++ was purified by HPLC on a semipreparative C18 column (Beckmann Ultrasphere, 250 × 10 mm, 5 μm) using a gradient of acetonitrile/water containing 0.1 % trifluoroacetic acid (TFA). Dipropidium (Pr++-Pr++) was prepared by oxidizing HPr+ with excess potassium ferricyanide (14). The reaction mixture contained dipropidium as a major product, and other oxidation products as minor products. Dipropidium was purified by HPLC under the same conditions as used in the purification of 2-OH-Pr++.
UV-Vis absorption and fluorescence measurements
The absorption spectra were recorded on an Agilent 8453 photodiode array spectrophotometer equipped with thermostated cell holder. Fluorescence excitation/emission matrix (FEEM) spectra were collected using a Perkin-Elmer LS-55 luminescence spectrometer.
HPLC measurements
HPr+ and its oxidation products were separated and monitored by HPLC using an Agilent 1100 apparatus equipped with an UV-Vis absorption and fluorescence detector. Typically, 50 μl of a sample was injected on C18 column (Phenomenex, Kinetex, 100 mm × 4.6 mm, 2.6 μm) equilibrated with acetonitrile/water mobile phase (10:90 v/v) containing 0.1 % TFA. Compounds were separated by a linear increase of the acetonitrile concentration from 10% to 50% over 5 min. Next, the concentration of acetonitrile was increased to 100% over 2 min and kept at this level for 2.5 min. HE, Mito-HE and their oxidation products were separated using a higher initial concentration of acetonitrile phase, as described previously (5,6,8). The column was equilibrated with acetonitrile/water mobile phase (20:80 v/v) containing 0.1% TFA. The concentration of acetonitrile was increased from 20% to 60% over 5 min, and from 60% to 100% over the next 2 min, and kept at this level for 2.5 min. All analytes, in both separation methods, were eluted at a flow rate of 1.5 ml/min. Fluorescence detection was carried out using an excitation wavelength of 490 nm and an emission wavelength of 567 nm and 596 nm. The absorption traces were collected at 220, 242, 290, 370 and 500 nm.
Mass spectral analyses
The structural identity of products was confirmed by MS analysis using two different mass spectrometers equipped with electrospray ion sources. The MS spectra were recorded on an Agilent 6460 and an IonSpec 7.0 T FT-ICR for higher resolution. The compounds were dissolved in water/acetonitrile (1:1 v/v) mixture containing 0.1% TFA by volume, and their concentration was in the range of 10–50 μM. The samples were directly injected into the MS spectrometer without HPLC separation. The compounds were detected in the positive ion mode. The charges of the molecular ions were calculated from the intervals between isotopic peaks. In the case of Pr++-Pr++, ion cluster formation with trifluoroacetate anion upon MS analysis was observed. Results showed an excellent agreement between experimental and calculated MS spectral data. HRMS was also performed on a QStar Elite (Applied Biosystems SCIEX) with API as a ionisation source.
NMR analyses
1H NMR and 13C NMR spectra were recorded at 400.13 and 75.54 MHz respectively using a Bruker DPX AVANCE 400 spectrometer equipped with a QNP probe. Chemical shifts (δ) are reported in ppm and coupling constants (J) values in Hertz. Assignments of 1H and 13C NMR signals of the compounds were made with the help of the APT (Attached Proton Test), HSQC (Heteronuclear Single Quantum Correlation) and HMBC (Heteronuclear Multiple Bond Correlation) sequences. The NMR spectral analyses of compounds are given in the Supplemental Section (Suppl. Figs. 1–4).
EPR measurements/kinetics
The electron paramagnetic resonance (EPR) spectra were recorded on a Bruker EMX spectrometer at 9.85 GHz at room temperature. Typical spectrometer parameters were: scan range, 60 G; sweep time, 42 s; time constant, 1.28 s; modulation amplitude, 1 G; modulation frequency, 100 kHz; microwave power, 5.0 mW. The competition kinetic approach was used to determine the rate constants of O2•− reaction with fluorescent probes. Superoxide dismutase (SOD) was used as a competitor in kinetic experiments. The concentration of the probes was kept constant throughout the experiment at the appropriate level to minimize self dismutation of superoxide radical anion, even in the absence of the competitor. In the competition kinetic approach, the concentration of specific hydroxylation product of the probes (2-OH-X+) depends on the rate constants of reaction of O2•− with both competitor and the probes investigated (reaction 1 and 2).
| (1) |
| (2) |
During the reaction there were no significant changes in the concentration of the probes as well as the competitor. Thus, the competition model assuming two pseudo-first order reactions can be applied, and the following equation can be written:
| (3) |
where [2-OH-X+]0 is the concentration of 2-OH-X+ in the absence of a competitor (SOD). Two equations that fit a nonlinear (equation 4) and linear (equation 5) relationship were used:
| (4) |
| (5) |
The flux of O2•− was generated by xanthine oxidase-catalyzed oxidation of hypoxanthine. The samples containing hypoxanthine (0.2 mM), XO (≈1 mU/ml), the fluorogenic probe (40 or 50 μM), and different concentrations of SOD were incubated in phosphate buffer (pH 7.4, 50 mM) containing 100 μM DTPA for 30 min at room temperature. SOD (1 mg/ml final concentration) was then added to stop the competition experiment, and the samples were placed in an HPLC autosampler cooled to 6°C and analyzed by HPLC. After HPLC analysis of all the samples, the first sample was analyzed again to confirm that the level of 2-OH-X+ was unchanged over the time period of HPLC analysis. The second control sample without XO was used to check for self-oxidation of the probes during the course of the experiment. That sample was analyzed at the end of experiment and appropriate corrections were applied. Each rate constant was determined on the basis of three independent experiments. All data points shown in Figure 6 represent mean values, and error bars indicate standard deviations. The molar concentration of SOD in the experiments was determined by UV-Vis spectrophotometry using an extinction coefficient of 1.03 × 10⁴ M−1cm−1 at 258 nm.
Figure 6.

The competition kinetic data for the reaction between O2•− and fluorogenic probes. (A) HPLC traces obtained from a mixture containing HPr+ (40 μM), hypoxanthine/xanthine oxidase, DTPA, and SOD (where indicated), incubated in phosphate buffer (50 mM, pH = 7.4) for 30 min. Prior to HPLC measurements, SOD (0.1 mg/ml) was added to stop further oxidation of the probe. (B) Same as (A) except in the presence of HE (50 μM). (C) Same as (A) except that Mito-HE (40 μM) was used. (D) The dependence of the peak area of 2-OH-Pr++ on the concentration of SOD. The solid line trace represents the result of nonlinear fitting (equation 4) to data points for 2-OH-Pr++ using HPr+ (40 μM) as a probe. (Inset) Results of fitting the experimental data using the linear relationship (equation 5). (E) Same as (D) except that HE was used. (F) Same as (E) except that Mito-HE (Mito-SOX Red®) was included. HPLC traces were collected using a fluorescence detector with an emission wavelength at 595 nm and an excitation wavelength at 485 nm.
The flux of O2•− was determined before each experiment by monitoring the ferricytochrome c reduction following an increase in absorbance at 550 nm. For this purpose, a difference in the values of the extinction coefficient between oxidized and reduced form of ferricytochrome c equal to 2.1 × 10⁴ M−1cm−1 was used. On this basis, the concentration of XO was adjusted to obtain the flux of 0.2 μM/min of O2•− during the kinetic experiments (15).
Cell culture experiments
DMEM (Invitrogen) medium supplemented with 10% heat-inactivated FBS, 2 mM L-glutamine, 100 units/ml penicillin, and 100 μg/ml streptomycin, was used to grow the RAW 264.7 cells (ATCC). Prior to experimentation, cells were washed three times using DPBS supplemented with pyruvic acid and glucose (DPBS-GP). Cells were then incubated with PMA (1 μM) or menadione (100 μM) in the presence of HPr+ in DPBS-GP. During the incubation period, cells were stored at 37°C in a CO2-free incubator. After incubation, an aliquot of the medium (100 μl) was collected and immediately frozen in liquid nitrogen. The cells were washed twice with ice-cold DPBS, scraped with 1 ml of DPBS, transferred into 1.5 ml tube and centrifuged (1 min, 1000 × g). After centrifugation, the remaining supernatant was discarded and the cell pellets were frozen in liquid nitrogen.
The cell pellets and media were stored at −80°C until the day of HPLC analysis, and were processed according to the procedure described previously (8,16). Briefly, to 100 μl of cell lysate or medium, a 0.2 M ice-cold solution of HClO4 in MeOH was added (100 μl) and the samples were vortexed for 10 s and stored on ice for several minutes. In the next step, samples were centrifuged for 30 min (20,000 × g at 4°C), and 100 μl aliquots of the supernatant were transferred to the tubes containing 1 M phosphate buffer (pH 2.6). Again, the tubes were quickly vortexed and centrifuged for 15 min (20,000 × g at 4°C). Aliquots of 150 μl of supernatants were used in HPLC analyses.
Results
Spectroscopic properties of HPr+ and its oxidation products
Figure 2 shows the UV-visible absorption and fluorescence spectra of HPr+ and its oxidation products. HPr+ exhibits three absorption maxima in the range below 400 nm (Fig. 2A) whereas the products, 2-OH-Pr++, Pr++ and Pr++-Pr++ have a strong absorption band in the UV range with an additional absorption band in the visible region between 400 and 600 nm (Fig. 2A). Figure 2B shows the fluorescence excitation and emission spectra. A comparison between the excitation and emission spectra of HPr+ and 2-OH-Pr++ shows that HPr+ does not interfere with the fluorescence of 2-OH-Pr++. However, the spectrum of Pr++ exhibits a significant overlap with 2-OH-Pr++. Thus, one has to use the HPLC method in order to distinguish these oxidation products. Both 2-OH-Pr++ and Pr++ display a strong fluorescence intensity above 500 nm, but much like 2-hydroxyethidum and ethidum, the fluorescence intensity of 2-OH-Pr++ in this region is higher than that of Pr++. The fluorescence intensity of 2-OH-Pr++ and Pr++ increases significantly upon binding to DNA (Fig. 2C). The FEEM spectra of 2-OH-Pr++ and Pr++ in the presence of DNA are shown (Fig. 2D and 2E). Of interest is the observation that 2-OH-Pr++, but not Pr++, has an additional excitation band below 400 nm which is clearly seen in the presence of DNA (indicated by an arrow in Figs. 2C and 2D). Table 1 lists the relevant absorption and fluorescence parameters of HPr+ and its oxidation products. The spectral properties of HPr+ and its oxidation products are very similar to those described for HE and its oxidation products (5,6,8).
Figure 2.
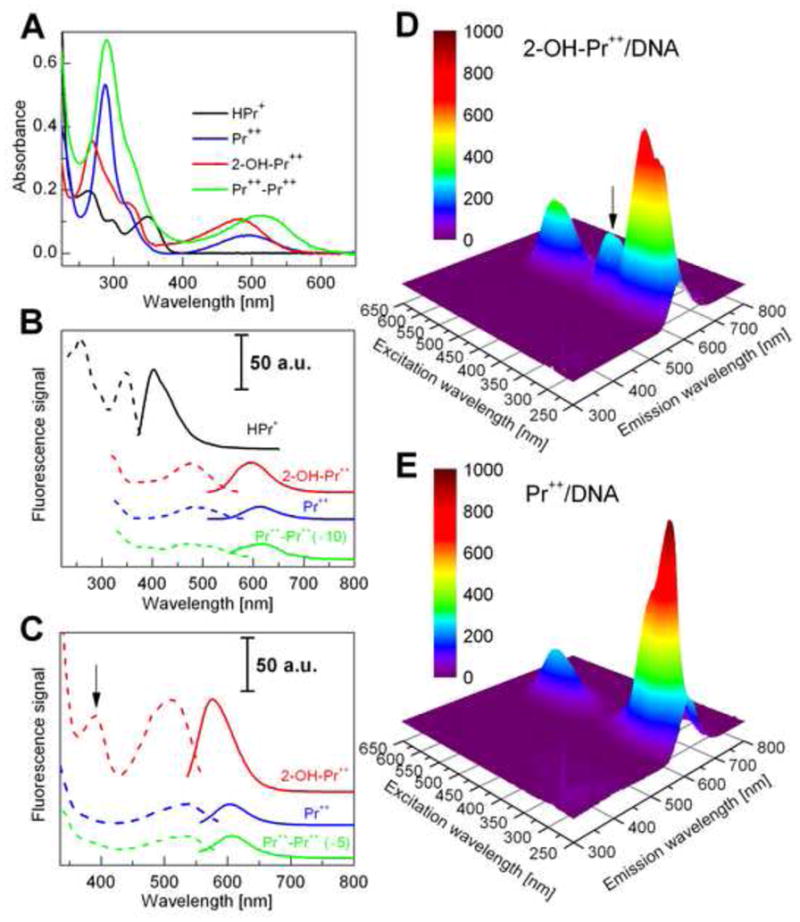
Spectroscopic properties of hydropropidine and its oxidation products. (A) The UV-Vis absorption spectra of HPr+ (10 μM) (black), Pr++ (10 μM) (blue), 2-OH-Pr++ (10 μM) (red) and Pr++-Pr++ (10 μM) (green) in phosphate buffer (50 mM, pH 7.4) containing 0.1 mM DTPA. (B) The florescence excitation (dashed line) and emission spectra (solid line) of HPr+ (1 μM), Pr++ (10 μM), 2-OH-Pr++ (10 μM) and Pr++-Pr++ (10 μM). (C) The fluorescence excitation (dashed line) and emission spectra (solid line) of Pr++ (1 μM), 2-OH-Pr++ (1 μM) and Pr++-Pr++ (10 μM) in the presence of DNA (0.1 mg/ml). (D) The FEEM spectrum of 2-OH-Pr++ (10 μM) in the presence of DNA (0.1 mg/ml). (E) The FEEM spectrum of Pr++ (10 μM) in the presence of DNA (0.1 mg/ml). The arrow marked in (C) and (D) indicates an additional excitation band for 2-OH-Pr++ (λmax = 391 nm).
Table 1.
Absorption maxima (λmax), extinction coefficients (ε), fluorescence excitation (λexc) and emission (λem) maxima in the presence and absence of DNA for HPr+ and its oxidation products
| Compound | UV-Vis absorption | Fluorescence | ||||
|---|---|---|---|---|---|---|
|
| ||||||
| λmax [nm] | ε [M−1cm−1] | without DNA | with DNA | |||
|
| ||||||
| λexc [nm] | λem [nm] | λexc [nm] | λem [nm] | |||
| HPr+ | 264 | 258 | 403 | |||
| 350 | 1.15×10⁴ | 350 | ||||
| 2-OH-Pr++ | 269 | 479 | 597 | 391 | 575 | |
| 483 | 1.1×10⁴ | 508 | ||||
| Pr++ | 288 | 485 | 614 | 533 | 605 | |
| 495 | 5.2×10³ | |||||
| Pr++-Pr++ | 290 | 480a | 618a | 529a | 607a | |
| 513 | ~1.2×10⁴ | |||||
The fluorescence intensity of Pr++-Pr++ is at least 10× lower than that of Pr++ and 2-OH-Pr++
Identification of the product of the reaction between superoxide radical anion and HPr+
The reaction between HPr+ and O2·− was investigated in an incubation mixture containing hypoxanthine and xanthine oxidase as a source of steady flux of superoxide at pH 7.4. The identity of the product was confirmed by HPLC analysis by comparison with authentic standards of 2-OH-Pr++ and Pr++. As shown in Figure 3A, a new product eluting at 3.16 min was detected under these conditions. The peak corresponding to the new product was abolished by SOD and not by catalase, suggesting that O2·−, and not H2O2 or H2O2-derived oxidant, reacts with HPr+ to yield this new product (Fig. 3A). The product derived from O2·− reaction with HPr+ eluted at the same time as the authentic standard, 2-OH-Pr++, formed from Fremy’s salt-mediated hydroxylation of HPr+ (Fig. 3A, D). The structures of the oxidation products were determined by mass spectral and NMR analyses, and by comparison with authentic standards (Fig. 3C, D). Table 2 lists the mass spectral parameters for HPr+ and its oxidation products.
Figure 3.

HPLC and mass spectral analyses of products formed from O2·− and Fremy’s salt-mediated oxidation of HPr+. (A) HPLC traces of HPr+ (10 μM), Pr++ (10 μM), reaction mixtures containing Fremy’s salt and HPr+ or HPr+ and hypoxanthine/xanthine oxidase with and without SOD and catalase. Prior to HPLC analyses, HPr+ (10 μM), hypoxanthine (HX) (0.1 mM) and xanthine oxidase (XO) (10 mU/ml) were incubated in phosphate buffer (50 mM, pH 7.4) containing 0.1 mM DTPA for 30 min. Where indicated, incubations contained SOD (0.1 mg/ml) or catalase (0.1 kU/ml). The incubation mixture containing HPr+ (10 μM) and NDS (20 μM) was analyzed immediately after mixing the components. The HPLC traces were recorded at 290 nm. The HPLC traces were scaled by a factor 0.1 and 0.2, respectively, so as to fit the absorptions of Pr++ and HPr+/Fremy’s salt product on the same scale. (B) The mass spectrum of HPr+. (C) The mass spectrum of Pr++. (D) The mass spectrum of 2-OH-Pr++. Arrows in (B), (C) and (D) indicate isotopic peaks.
Table 2.
Mass spectral data for HPr+ and its oxidation products
| Compound | Molecular ion | Ionic charge | Distance between isotopic peaks (m/z) | Calc. masses (m/z) | Calc. intensities (%) | Exp. masses (m/z) | Exp. intensities (%) |
|---|---|---|---|---|---|---|---|
| Hydropropidine (HPr+) | HPr+ | 1 | 1 | 415.2862 | 100.0 | 415.2877 | 100.0 |
| 416.2895 | 30.0 | 416.2907 | 29.6 | ||||
| 417.2929 | 4.3 | 417.2970 | 5.8 | ||||
| Propidium (Pr++) | Pr++ | 2 | 0.5 | 207.1392 | 100 | 207.1392 | 100.0 |
| 207.6409 | 30 | 207.6410 | 28.5 | ||||
| 208.1426 | 4.3 | 208.1425 | 5.0 | ||||
| 2-Hydroxy- propidium (2-OH-Pr++) | 2-OH-Pr++ | 2 | 0.5 | 215.1367 | 100 | 215.1361 | 100.0 |
| 215.6383 | 30 | 215.6378 | 28.4 | ||||
| 216.1400 | 4.3 | 216.1393 | 3.8 | ||||
| 2-OH-Pr++(-H+) | 1 | 1 | 429.2654 | 100 | 429.2649 | 100.0 | |
| 430.2688 | 30 | 430.2676 | 28.5 | ||||
| 431.2721 | 4.3 | 431.2784 | 8 | ||||
| Dipropidium (Pr++-Pr++) | Pr++-Pr++(-H+) | 3 | 0.33 | 275.1777 | 100 | 275.1775 | 100.0 |
| 275.5122 | 60.1 | 275.5125 | 55.7 | ||||
| 275.8466 | 17.7 | 275.8469 | 13.0 | ||||
| 276.1811 | 3.4 | 276.1814 | 2.4 | ||||
| Pr++-Pr++ (+2×CF3COO−) | 2 | 0.5 | 526.2556 | 100 | 526.2563 | 100 | |
| 526.7573 | 64.5 | 526.7580 | 62.0 | ||||
| 527.2589 | 20.4 | 527.2606 | 20.1 | ||||
| 527.7606 | 4.2 | 527.7593 | 5.5 |
The NMR spectral analyses of the hydroxylated product formed from HPr+ and O2·− reaction indicate that the hydroxyl group is attached at position 2 and not at position 9. Figures 4A–D show the NMR spectra of HPr+, 2-OH-Pr++, Pr++, and Pr++-Pr++. Table 3 lists the chemical shifts and proton coupling constants of HPr+ and its oxidation and hydroxylation products, Pr++, 2-OH-Pr++ and Pr++-Pr++. Both NMR and MS data are consistent with the proposed structures (Table 2 and suplementary Figs 1–4).
Figure 4.
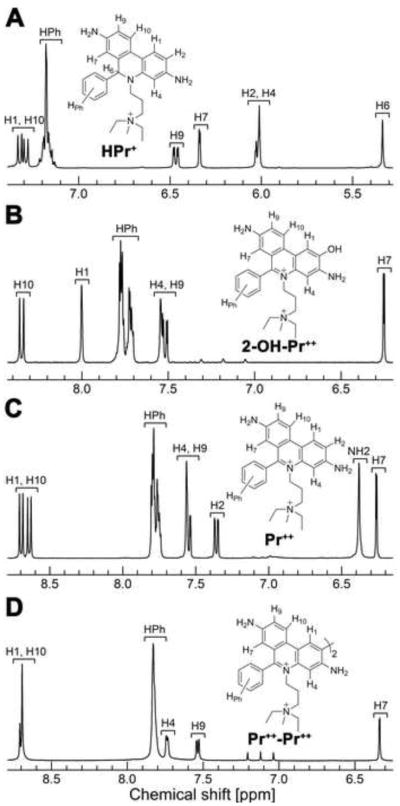
1H NMR spectra of (A) hydropropidine (HPr+), (B) 2-hydroxypropidium (2-OH-Pr++), (C) propidium (Pr++) and (D) dipropidium (Pr++-Pr++), as measured in DMSO-d6.
Table 3.
1H NMR chemical shifts (δ, ppm) and coupling constants (J, Hz) of HPr+ and its oxidation productsa
| Product | Chemical shifts (ppm) and coupling constants (Hz) | ||||||
|---|---|---|---|---|---|---|---|
|
| |||||||
| H1 | H2 | H4 | H7 | H9 | H10 | H6 | |
|
| |||||||
| HPr+ | 7.29 (J = 8.8) | 6.03 (J = 8.5) | 6.01 | 6.34 (J = 2.3) | 6.47 (J = 8.3, 2.3) | 7.32 (J = 8.3) | 5.34 |
| 2-OH-Pr++ | 8.01 | - | 7.54 | 6.25 (J = 2.3) | 7.52 (J = 9.0, 2.5) | 8.35 (J = 9.3) | - |
| Pr++ | 8.70 (J = 9.3) | 7.36 (J = 9.3, 1.5) | 7.56 (J = 1.5) | 6.26 (J = 2.5) | 7.54 (J = 9.3, 2.3) | 8.64 (J = 9.3) | - |
| Pr++-Pr++ | 8.69 | - | 7.73 (J = 6.5) | 6.34 (J = 2.1) | 7.54 (J = 9.0, 2.1) | 8.70 (J = 9.0) | - |
Atom positions are indicated in structures shown in Figure 4.
Fremy’s salt dependent oxidation of HPr+: Reaction stoichiometry
Fremy’s salt dissociates into nitrosodisulfonate radical dianion (NDS) in water (Fig. 1) and has been used in the syntheses of 2-hydroxylated phenols and aromatic amines (17). We have previously used the Fremy’s salt to prepare 2-OH-E+, the product of HE/O2·− reaction (4). We followed the same approach to prepare 2-OH-Pr++, the product of HPr+ and O2·− reaction. As NDS is a relatively stable nitroxide radical at pH 7.4, we monitored the reaction between HPr+ and NDS by EPR (4). Concomitantly, the changes in HPr+ and 2-OH-Pr++ concentration were monitored by HPLC. Figure 5A (top) shows the three-line EPR spectrum of NDS (8 μM) in phosphate buffer. In the presence of HPr+ (4 μM), the intensity of the three-line signal was greatly diminished (Fig. 5A, bottom). Figure 5B shows the changes in the EPR signal intensity of NDS as a function of its initial concentration in the absence and presence of HPr+ (4 μM). As shown, in the presence of 4 μM HPr+ the EPR signal intensity began to increase above 8 μM of NDS (Fig. 5B, solid squares). The EPR results indicate that two molecules of NDS react with one molecule of HPr+. Next, we investigated the reaction stoichiometry by monitoring the HPLC peak areas of HPr+ and the product (which was determined to be 2-OH-Pr++) in the presence of NDS (Fig. 5C). With increasing NDS concentration, the peak area due to HPr+ decreased, and that of 2-OH-Pr++ increased, until the stoichiometry between HPr+ and NDS reached approximately 1:2. The HPLC results also suggest that one molecule of HPr+ reacts with two NDS radicals to produce one molecule of 2-OH-Pr++. At higher concentration of NDS, HPr+ was completely consumed and NDS reacted with 2-OH-Pr++, leading to a decrease in the peak area corresponding to this product.
Figure 5.

The stoichiometry of the reaction between HPr+ and Fremy’s salt. (A) The EPR spectrum of NDS (8 μM) in phosphate buffer (50 mM, pH 7.4) containing DTPA (0.1 mM) in the absence (top) and presence (bottom) of HPr+ (4 μM). (B) The double-integrated EPR signal intensity of NDS as a function of its concentration in the absence (open circles) and presence (solid squares) of HPr+ (4 μM). (C) HPLC peak areas of HPr+ (open circles) and 2-OH-Pr++ (solid squares) as a function of NDS concentration. HPLC absorption traces were recorded at 290 nm. The peak areas of 2-OH-Pr++ were scaled by a factor of 0.2 to fit on the same scale as that of HPr+ peak area. The final concentration of HPr+ was 42 μM.
Kinetics of O2·− reaction with HPr+
The rate constant between O2·− and HPr+ was determined by a competition kinetic technique in the presence and absence of the enzyme bovine Cu, Zn-SOD, as discussed in the Materials and Methods section. Figure 6A shows the HPLC traces of 2-OH-Pr++ formed from incubating HPr+ in the presence of hypoxanthine and xanthine oxidase and different concentrations of SOD for 30 min at room temperature. With increasing SOD concentration, the HPLC peak intensity due to 2-OH-Pr+ decreased (Fig. 6A). The rate constant between O2·− and HPr+ was calculated from the nonlinear graph (equation 4) as shown (Fig. 6D). The curve fitted using a linear equation (equation 5) is also shown (Fig. 6D, inset). Figure 6B shows the effect of SOD on 2-OH-E+ formed from incubating HE and HX/XO. The kinetic analysis of this data is shown in Figure 6E. Similar experiments were carried out for Mito-HE, and the results are shown in Figures 6C and 6F. Table 4 lists the rate constants determined for the reaction between O2·− and the fluorogenic probes (HE, HPr+, and Mito-HE).
Table 4.
Rate constants for the reactions between HPr+, HE, Mito-HE and O2•− as determined from the competition kinetics with SOD
| Probes | SODa |
|---|---|
| HPr+ | (1.19 ± 0.05) × 104 M−1s−1 |
| HE | (6.2 ± 0.8) × 103 M−1s−1 |
| Mito-HE | (1.6 ± 0.1) × 104 M−1s−1 |
k = 2 × 10⁹ M−1s−1
Oxidation of HPr+ by one-electron oxidants
Next, we determined the oxidation products formed from the reaction between HPr+ and other biologically-relevant oxidants and compared with the products formed from reacting these probes with ferricyanide (one-electron oxidant) and chloranil (two-electron oxidant). Oxidants tested included peroxynitrite, ferricytochrome c, horseradish peroxidase/H2O2 system, Fenton’s reagent, and hydrogen peroxide. The two-electron oxidant (chloranil) and one-electron oxidizing agent (ferricyanide anion) were used in order to understand the reaction mechanisms of product formation.
The HPLC traces obtained from the incubation mixtures containing HPr+ and the various oxidants are shown in Figure 7. Incubation of HPr+ with chloranil leads primarily to Pr++. In the presence of ferricyanide anion we detected several other products in addition to Pr++. These products were ascribed to various dimers of HPr+ (Fig. 7). A similar set of products was also observed in the presence of peroxynitrite, ferricytochrome c, Fenton’s reagent and horseradish peroxidase/H2O2. Incubation of HPr+ with hydrogen peroxide alone did not yield a significant amount of the aforementioned reaction products. Lack of a reaction between H2O2 and HPr+ is in agreement with results obtained from hypoxanthine/xanthine oxidase system (Fig. 3B). In the case of peroxynitrite, ferricytochrome c and Fenton’s reagent, small amounts of 2-OH-Pr++ were formed during prolonged incubation. As explained in earlier publications, this small increase in SOD-sensitive 2-OH-Pr+ formation could be due to DTPA-derived radicals (10).
Figure 7.

HPLC profiles of the products of the reaction of HPr+ with various oxidants. Incubations contained HPr+ (10 μM) and 0.1 mM DTPA in phosphate buffer (50 mM, pH 7.4) and various oxidants as indicated: chloranil (5 μM), ferricyanide anion (20 μM), peroxynitrite (20 μM), ferricytochrome c (5 μM), horseradish peroxidase (HRP, 5 mU/ml) /H2O2 (5μM), Fenton’s reagent [Fe2+ (20 μM) and H2O2 (1 mM)], or H2O2 alone (1 mM). With ferricyanide anion, peroxynitrite and HRP/H2O2 system, incubation mixtures were analyzed immediately after mixing the components. With respect to chloranil, ferricytochrome, the Fenton’s reagent or H2O2-dependent oxidation of HPr+, HPLC analysis was performed after incubation at room temperature for 15–60 min. In the case of ferricytochrome, the reaction was stopped by mixing (1:1) with an ice-cold solution of 0.2 M HClO4 in MeOH and the supernatant was diluted with phosphate buffer 1 M (pH = 2.6). HPLC traces were recorded at 290 nm. Because of differences in the intensities of absorption peaks, the scale was set individually for each HPLC trace, as shown on the figure.
The HPLC-based titration of HPr+ with ferricyanide anion indicates formation of at least three dimeric oxidation products of HPr+ (Fig. 8). At lower concentrations of ferricyanide, the homodimer (HPr+-HPr+) was predominantly observed (Fig. 8A, B). With increasing ferricyanide concentration, one of the rings is oxidized to form a heterodimer (HPr+-Pr++). The ESI-MS analysis of product obtained from oxidation of HPr+ at a much higher ferricyanide concentration revealed a homodimeric structure, i.e., dipropidium (Pr++-Pr++) (Fig. 8C). The structure of dipropidium was confirmed by 1H and 13C NMR analyses (Fig 4D and Suppl. Fig. 4).
Figure 8.
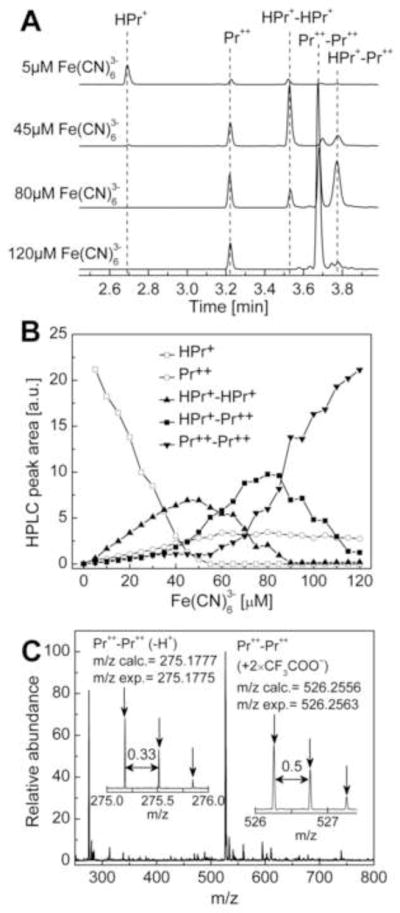
Oxidation of HPr+ by ferricyanide anion. (A) HPLC traces obtained after incubating 40 μM HPr+ and 0.1 DTPA in phosphate buffer (50 mM, pH 7.4) in the presence of 5, 45, 80, and 120 μM potassium ferricyanide. HPLC traces were recorded at 290 nm. (B) The profiles of different oxidation products with varying concentration of ferricyanide. (C) Mass spectrum of Pr++-Pr++ dimer.
Relative intracellular uptake of HE and HPr+
Because of the localized positive charge on the nitrogen atom in HPr+, we surmised that HPr+ will not penetrate into the cell. This is in contrast to Mito-SOX Red® (or Mito-HE) where the positive charge is delocalized over the aromatic rings and is sequestered into mitochondria (11). RAW macrophages were treated with HE or HPr+ for 1 h, and their concentrations in cell lysates and cell culture media were monitored by HPLC with fluorescence detection. Results show that the cell lysate to cell culture medium ratio for HE is significantly higher that of HPr+ (Fig. 9A). However, the reverse was true for HPr+ (in that a significantly larger amount of HPr+ remained in the medium as compared to cell lysate) (Fig. 9B).
Figure 9.

The cellular uptake of HE and HPr+ upon incubation of the probes with macrophages RAW 264.7. The cells were incubated with 10 μM HE or HPr+ for 1 h in cell culture media. Samples were then prepared according to the procedure described in the Materials and Methods section and analyzed by HPLC.
Measurement of extracellular O2·− using hydropropidine
We used two sources of O2·− generation in cells. RAW 264.7 macrophages were stimulated with PMA or treated with menadione (Fig. 1), a redox-active quinone that generates O2•− via redox-cycling of the semiquinone radical derived from menadione. RAW macrophages were activated with PMA (1 μM) in DPBS-supplemented with pyruvic acid and glucose containing HPr+ probe in the presence and absence of SOD and incubated for 1 h at 37°C. The diagnostic marker product of HPr+/O2·− reaction was subsequently monitored by HPLC in cell lysates and in the media. As shown in Figure 10A, 2-OH-Pr++ formation was stimulated by 3 to 4-fold in the extracellular compartment of macrophages stimulated with PMA. This increase in 2-OH-Pr++ formation was abrogated by SOD. A negligible amount of 2-OH-Pr++ was detected in macrophage cell lysates. Figure 10B shows the time-course of 2-OH-Pr++ formation from the media isolated from macrophages stimulated with and without PMA and SOD.
Figure 10.

Measurement of extracellular superoxide radical anion production using the HPr+ probe. (A) RAW macrophages were stimulated with PMA (1 μM) in cell culture media containing HPr+ (60 μM) (as described in the Materials and Methods section) in the presence and absence of SOD (0.1 mg/ml) for 1 h min and 2-OH-Pr++ levels were measured in cell culture media (extracellular) and cell lysates (intracellular). To directly compare the amount of 2-OH-Pr++ inside the cell or media, the amount of the product was normalized to the total amount of protein in the cell lysates. (B) Time course measurements of extracellular 2-OH-Pr++ under different experimental conditions, as indicated. Experimental conditions: PMA (1 μM), HPr+ (60 μM) and SOD (0.1 mg/ml). (C) Same as (A) except that superoxide production was stimulated by adding menadione (100 μM) and incubated for 30 min. (D) Same as (B) except that macrophages were treated with menadione (MN, 100 μM) instead of PMA.
Addition of menadione to macrophages in the presence of HPr+ induced >2-fold increase in 2-OH-Pr++ formation in the media (Fig. 10C). Time-course measurements also showed the same trend (Fig. 10D). This increase in 2-OH-Pr++ was abrogated by SOD. A negligible amount of 2-OH-Pr++ was detected in the cell lysates as compared to the medium (Figs. 10A and 10C). These results indicate that HPr+ is a suitable probe for detecting extracellularly generated O2·−.
Discussion
We report here the development of a novel fluorogenic probe, HPr+, which is specific for measuring extracellular superoxide and other one-electron oxidation species in cell-free and cell-based systems. Reaction between O2·− and HPr+ led to the identification of a characteristic marker product, 2-hydroxypropidium. In the presence of one-electron oxidizing species (peroxynitrite-derived radicals, peroxidases), the corresponding propidium dication and homo- and heterodimeric products were formed. The reaction chemistry between HPr+, O2·−, and one-electron oxidants is analogous to that of hydroethidine, a well-known probe for tracking intracellular O2·. On the basis of similarity of HPr+ to HE and the reaction stoichiometry of HPr+ with NDS (Fig. 5), we assume that the reaction stoichiometry between HPr+ and O2·− is 1:2. The hypothetical mechanism is shown in Figure 11A.
Figure 11.

(A) Proposed mechanism of reaction of HPr+ with O2•−. (B) Scheme showing the oxidation of HE, HPr+ and Mito-HE probes by O2•− to the hydroxylated fluorescent product and by one-electron oxidants with the formation of fluorescent, non-hydroxylated cation and non-fluorescent dimeric products. For the sake of clarity, the structures of other intermediate dimeric products are not shown.
Similarities in redox chemistry between HE, Mito-HE, and HPr+
Results indicate that the reaction chemistry between O2·− and reduced phenanthridinium compounds investigated in this study are identical (18). HE, HPr+, and Mito-HE (or Mito-SOX Red®) react with O2·− to ultimately form the corresponding hydroxylated products (2-OH-E+, 2-OH-Pr++, and 2-OH-Mito-E+) (Fig. 11B). Contrary to a previous assertion that ethidium is the major product of HE oxidation (19), the hydroxylated products were detected as the only major product at various fluxes of O2·− with no significant change in the two-electron oxidation product, E+. Treatment with two-electron oxidation agent, chloranil, yielded E+, Pr++, and Mito-E+ from HE, HPr+, and Mito-HE (Fig. 7) (5,6). In the presence of other oxidants (peroxynitrite-derived radicals, cytochrome c, and higher oxidants from peroxidase/H2O2 reaction) that oxidize HE, HPr, and Mito-HE via a one-electron transfer mechanism, various reduced homodimers (HE-HE, HPr+-HPr+, Mito-HE-Mito-HE), heterodimers (HE-E+, HPr+-Pr++, Mito-HE-Mito-E+) and oxidized homodimers (E+-E+, Pr++-Pr++, Mito-E+-Mito-E+) are formed. The similarity in the redox chemistry of these probes, combined with their different cellular localization, potentially opens up new possibilities to simultaneously monitor O2·− generation in different cellular locales.
Discrepancies in the rate constants
The rate constant for O2·− reaction with HE that is reported in this work is more than an order of magnitude lower than the previously reported value (1). We attribute the higher rate constant value previously reported for the HE/O2·− reaction to the higher literature rate constant value (for BMPO and O2·−) (20,21) that we used in the competition kinetic analysis (1). We have reevaluated the BMPO/O2·− rate constant using the competition kinetic approach as described in the Materials and Methods Section (Fig. 12). The new rate constant for the BMPO and O2·− reaction was calculated to be ca. 13.1 M−1 s−1. In the pulse radiolysis work (10), the reaction between HE and O2·− was determined in a 1:1 ethanol/water mixture. In such a mixture, it is likely that the pKa of the hydroperoxyl radical (HO2·, the protonated form of superoxide) is higher than in water. Assuming that HO2· reacts with HE much faster than O2·−, this may explain the higher reactivity of superoxide in a such solvent mixture, as compared to water alone. Nevertheless, in this work (Table 2) we have rectified the previously reported incorrect rate constant values for the HE/O2·− reaction (1,10).
Figure 12.
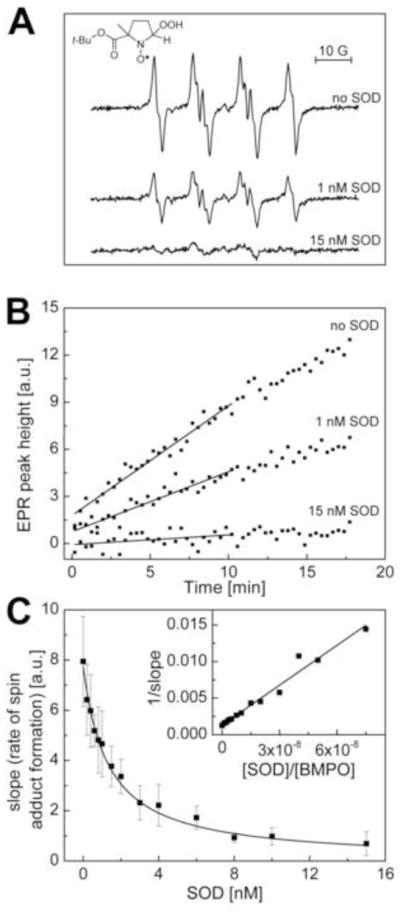
Reevaluation of the kinetic data for the reaction between O2•− and BMPO. (A) The EPR spectra of BMPO-•OOH adduct obtained from a mixture containing BMPO (0.2 M), hypoxanthine/xanthine oxidase (O2•− flux of 0.8 μM/min), 0.1 mM DTPA, and SOD (where indicated) in phosphate buffer (pH, 7.4, 50 mM) after a 10 min incubation at room temperature. The spectra shown are average of four consecutive scans. (B) Changes in the signal height of BMPO-•OOH spin adduct with time (initial slopes of the fitted lines were used in the kinetic caluclations). (C) The dependence of a rate of spin adduct formation on the concentration of SOD.
Implications in the detection of cellular O2·− in biological systems
The NADPH oxidase (Nox) family (Nox 1-5, DUOX1 and 2) is one of the major biological sources of oxidant generation (22,23). Nox enzymes (Nox 1-3, and 5) catalyze the NADPH-dependent one-electron reduction of oxygen to O2·− (22,23). The only known function of Nox enzymes is to generate ROS, and the function of this enzyme is typically assessed by measuring O2·− generation (24). Currently available assays for determining Nox activity use nonspecific and artifact-prone probes for ROS (25,26). The most investigated Nox member is Nox2 that is expressed abundantly in neutrophils and macrophages (27). This enzyme complex consists of different protein components that are located in the cytosolic and membranous compartments (28). Upon Rac1 or Rac2 activation, the various components (e.g., gp91phox, p22phox, p67phox, p47phox, and p40phox) are assembled at the plasma membrane to form a functionally active NADPH oxidase which transfers electrons from NADPH to oxygen, producing either O2·− and/or H2O2 (28). Nox5 is activated by elevated cytosolic calcium and generates extracellular O2·− (29). The actual identity and site(s) of ROS generation from Nox isoforms remain an active area of investigation. Development of site-specific fluorogenic probes will help in the determination of the identity, the source, and the location of oxidants generated by Nox isoforms in cells exposed to pro-inflammatory conditions.
Comparison of HPr+ with the existing probes
In addition to the artifact-prone assays employing probes capable of self-generation of superoxide (e.g., lucigenin and luminol), two other probes, used for measurement of extracellular superoxide radical anion include ferricytochrome c and spin traps (e.g., BMPO, DEPMPO) (30). The major advantage of both of those probes is that the product is formed in a single step, which minimizes the possibility of interference with assay.
However, the rate constant of the reaction of nitrone spin traps with superoxide is very low and the resulting nitroxide spin adduct is unstable. Also, there is a limited access to EPR instrumentation in most biochemical labs. In the case of ferricytochrome based method, the major disadvantage for cellular assays is the mode of detection (spectrophotometric assay), which not only limits the sensitivity of the assay but also dictates the need of time-dependent probing the extracellular medium by transferring an aliquot to spectrophotometer for the measurement in case of adherent cells. Also, the propensity of cytochrome c to undergo superoxide-independent reduction (e.g. by flavoproteins, redox-cycling intermediates, thiol compounds) limits the applicability of the probe. On the other hand, hydropropidine gives unique and stable product upon reaction with superoxide and the rate constant is at least three orders of magnitude higher than most nitrone spin traps. The HPLC based detection of the specific product can be accompanied by fluorescence-based real time monitoring in cellular system to obtain both reliable oxidant identification and the dynamics of oxidant production.
Conclusions
We conclude that 2-OH-Pr++ and the dimeric products (e.g., Pr++-Pr++) derived from HPr+ are reliable indicators of O2·− and one-electron oxidizing species formed in an extracellular milieu.
Supplementary Material
HIGHLIGHTS.
Hydropropidine is a cell-impermeable analog of hydroethidine.
Positive charge on the nitrogen impedes cellular uptake of hydropropidine.
Extracellular O2•− reacts with the probe to form a specific hydroxylated product.
Extracellular one-electron oxidants react with this probe to form dimeric products.
Acknowledgments
This work was supported by grants R01 HL063119 and R01 NS039958 from the National Institutes of Health. The authors thank Mrs. Monika Zielonka for her help in culturing of RAW 264.7 cells.
Abbreviations
- HPr+
hydropropidine
- Pr++
propidium
- 2-OH-Pr++
2-hydroxypropidium
- HE
hydroethidine
- NDS
nitrosodisulfonate radical dianion
- Mito-HE (or Mito-SOX Red®)
mitochondria-targeted HE analog
- DPBS
Dulbecco’s PBS
- DPBS-GP
Dulbecco’s PBS supplemented with pyruvic acid and glucose
- PMA
phorbol 12-myristate 13-acetate
- MN
menadione bisulfite sodium salt
- HX
hypoxanthine
- XO
xanthine oxidase
- HRP
horseradish peroxidase
- DTPA
diethylenetriaminepentaacetic acid
- BMPO
5-tert-butoxycarbonyl 5-methyl-1-pyrroline N-oxide
- TFA
trifluoroacetic acid
- EPR
electron paramagnetic resonance
- Pr++-Pr++
dipropidium (propidium-propidium homodimer)
- HPr+-Pr++
hydropropidine-propidium heterodimer
- HPr+-HPr+
hydropropidine-hydropropidine homodimer
Footnotes
Publisher's Disclaimer: This is a PDF file of an unedited manuscript that has been accepted for publication. As a service to our customers we are providing this early version of the manuscript. The manuscript will undergo copyediting, typesetting, and review of the resulting proof before it is published in its final citable form. Please note that during the production process errors may be discovered which could affect the content, and all legal disclaimers that apply to the journal pertain.
Contributor Information
Radoslaw Michalski, Email: radoslaw.michalski@p.lodz.pl, rmichalski@mcw.edu.
Jacek Zielonka, Email: jzielonk@mcw.edu.
Micael Hardy, Email: micael.hardy@univ-provence.fr.
Joy Joseph, Email: jjoseph@mcw.edu.
Balaraman Kalyanaraman, Email: balarama@mcw.edu.
References
- 1.Zhao H, Kalivendi S, Zhang H, Joseph J, Nithipatikom K, Vsquez-Vivar J, Kalyanaraman B. Superoxide reacts with hydroethidine but forms a fluorescent product that is distinctly different from ethidium: potential implications in intracellular fluorescence detection of superoxide. Free Radic Biol Med. 2003;34:1359–1368. doi: 10.1016/s0891-5849(03)00142-4. [DOI] [PubMed] [Google Scholar]
- 2.Zhao H, Joseph J, Fales HM, Sokoloski EA, Levine RL, Vsquez-Vivar J, Kalyanaraman B. Detection and characterization of the product of hydroethidine and intracellular superoxide by HPLC and limitations of fluorescence. Proc Natl Acad Sci USA. 2005;102:5727–5732. doi: 10.1073/pnas.0501719102. [Erratum: Proc. Natl. Acad. Sci. U.S.A. 102:9086; 2005.] [DOI] [PMC free article] [PubMed] [Google Scholar]
- 3.Dikalov S, Griendling KE, Harrison DG. Measurement of reactive oxygen species in cardiovascular studies. Hypertension. 2007;49:717–727. doi: 10.1161/01.HYP.0000258594.87211.6b. [DOI] [PMC free article] [PubMed] [Google Scholar]
- 4.Zielonka J, Zhao H, Xu Y, Kalyanaraman B. Mechanistic similarities between oxidation at hydroethidine by Fremy’s salt and superoxide: stopped-flow optical and EPR studies. Free Radic Biol Med. 2005;39:853–863. doi: 10.1016/j.freeradbiomed.2005.05.001. [DOI] [PubMed] [Google Scholar]
- 5.Zielonka J, Hardy M, Kalyanaraman B. HPLC study of oxidation products of hydroethidine in chemical and biological systems: Ramifications in superoxide measurements. Free Radic Biol Med. 2009;46:329–338. doi: 10.1016/j.freeradbiomed.2008.10.031. [DOI] [PMC free article] [PubMed] [Google Scholar]
- 6.Zielonka J, Vsquez-Vivar J, Kalyanaraman B. Detection of 2-hydroxyethidium in cellular systems: a unique marker product of superoxide and hydroethidine. Nat Protoc. 2008;3:8–21. doi: 10.1038/nprot.2007.473. [DOI] [PubMed] [Google Scholar]
- 7.Palazzolo-Balance AM, Suquet C, Hurst JK. Pathways for intracellular generation of oxidants and tyrosine nitration by a macrophage cell line. Biochemistry. 2007;46:3536–3548. doi: 10.1021/bi700123s. [DOI] [PMC free article] [PubMed] [Google Scholar]
- 8.Zielonka J, Zielonka M, Sikora A, Adamus J, Hardy M, Ouari O, Dranka BP, Kalyanaraman B. Global profiling of reactive oxygen and nitrogen species in biological systems: High-throughput real-time analyses. J Biol Chem. 2011;287:2984–2995. doi: 10.1074/jbc.M111.309062. [DOI] [PMC free article] [PubMed] [Google Scholar]
- 9.Moore A, Donahue CJ, Bauer KD, Mather JP. Simultaneous measurement of cell cycle and apoptotic cell death. Methods Cell Biol. 1998;57:265–278. doi: 10.1016/s0091-679x(08)61584-8. [DOI] [PubMed] [Google Scholar]
- 10.Zielonka J, Sarna T, Roberts JE, Wishart JF, Kalyanaraman B. Pulse radiolysis and steady-state analyses of the reaction between hydroethidine and superoxide and other oxidants. Arch Biochem Biophys. 2006;456:39–47. doi: 10.1016/j.abb.2006.09.031. [DOI] [PMC free article] [PubMed] [Google Scholar]
- 11.Robinson KM, Janes MS, Pehar M, Monette JS, Ross MF, Hagen TM, Murphy MP, Beckman JS. Selective fluorescent imaging of superoxide in vivo using ethidium-based probes. Proc Natl Acad Sci USA. 2006;103:15038–15043. doi: 10.1073/pnas.0601945103. [DOI] [PMC free article] [PubMed] [Google Scholar]
- 12.Kissner R, Beckman JS, Koppenol WH. Peroxynitrite studied by stopped-flow spectroscopy. Methods Enzymol. 1999;301:342–352. doi: 10.1016/s0076-6879(99)01098-8. [DOI] [PubMed] [Google Scholar]
- 13.Zhao H, Joseph J, Zhang H, Karoui H, Kalyanaraman B. Synthesis and biochemical applications of a solid cyclic nitrone spin trap: a relatively superior trap for detecting superoxide anions and glutathiyl radicals. Free Radic Biol Med. 2001;31:599–606. doi: 10.1016/s0891-5849(01)00619-0. [DOI] [PubMed] [Google Scholar]
- 14.Zielonka J, Srinivasan S, Hardy M, Ouari O, Lopez M, Vasquez-Vivar J, Avadhani NG, Kalyanaraman B. Cytochrome c-mediated oxidation of hydroethidine and mito-hydroethidine in mitochondria: Identification of homo- and heterodimers. Free Radic Biol Med. 2008;44:835–846. doi: 10.1016/j.freeradbiomed.2007.11.013. [DOI] [PMC free article] [PubMed] [Google Scholar]
- 15.Sikora A, Zielonka J, Lopez M, Joseph J, Kalyanaraman B. Direct oxidation of boronates by peroxynitrite: Mechanism and implications in fluorescence imaging of peroxynitrite. Free Radic Biol Med. 2009;47:1401–1407. doi: 10.1016/j.freeradbiomed.2009.08.006. [DOI] [PMC free article] [PubMed] [Google Scholar]
- 16.Dranka BP, Zielonka J, Kathansamy AG, Kalyanaraman B. Alterations in bioenergetics function induced by Parkinson’s disease mimetic compounds: Lack of correlation with superoxide generation. J Neurochem. 2012;122:941–951. doi: 10.1111/j.1471-4159.2012.07836.x. [DOI] [PMC free article] [PubMed] [Google Scholar]
- 17.Zimmer H, Lankin DC, Horgan SW. Oxidations with potassium nitrosodisulfonate (Fremy’s radical). The Teuber reaction. Chem Rev. 1971;71:229–246. [Google Scholar]
- 18.Zielonka J, Kalyanaraman B. Hydroethidine- and Mito-SOX-derived red fluorescence is not a reliable indicator of intracellular superoxide formation: Another inconvenient truth. Free Radic Biol Med. 2010;48:983–1001. doi: 10.1016/j.freeradbiomed.2010.01.028. [DOI] [PMC free article] [PubMed] [Google Scholar]
- 19.Kundo K, Knight SF, Lee S, Taylor WR, Murthy N. A significant improvement of the efficacy of radical oxidant probe by the kinetic isotope effect. Angew Chem Int Ed Engl. 2010;49:6134–6138. doi: 10.1002/anie.201002228. [DOI] [PMC free article] [PubMed] [Google Scholar]
- 20.Tsai P, Ichikawa K, Mailer C, Pou S, Halpern HJ, Robinson BH, Nielson R, Rosen GM. Esters of 5-Carboxyl-5-methyl-1-pyrroline N-Oxide: A family of spin traps for superoxide. J Org Chem. 2003;68:7811–7817. doi: 10.1021/jo0350413. [DOI] [PubMed] [Google Scholar]
- 21.Rosen GM, Tsai P, Weaver J, Porasuphatana S, Roman LJ, Starkov AA, Fiskum G, Pou S. The role of tetrahydrobiopterin in the regulation of neuronal nitric-oxide synthase-generated superoxide. J Biol Chem. 2002;277:40275–40280. doi: 10.1074/jbc.M200853200. [DOI] [PubMed] [Google Scholar]
- 22.Lambeth JD. Nox enzymes and the biology of reactive oxygen. Nat Rev Immunol. 2004;4:181–189. doi: 10.1038/nri1312. [DOI] [PubMed] [Google Scholar]
- 23.Leto TL, Morand S, Hurt D, Ueyama T. Targeting and regulation of reactive oxygen species generation by Nox family NADPH oxidases. Antioxid Redox Signal. 2009;11:2607–2619. doi: 10.1089/ars.2009.2637. [DOI] [PMC free article] [PubMed] [Google Scholar]
- 24.Bedard K, Krause KH. The NOX family of ROS-generating NADPH oxidases: physiology and pathophysiology. Physiol Rev. 2007;87:245–313. doi: 10.1152/physrev.00044.2005. [DOI] [PubMed] [Google Scholar]
- 25.Ambasta RK, Schreiber JG, Janiszewski M, Busse R, Brandes RP. Noxa1 is a central component of the smooth muscle NADPH oxidase in mice. Free Radic Biol Med. 2006;41:193–201. doi: 10.1016/j.freeradbiomed.2005.12.035. [DOI] [PubMed] [Google Scholar]
- 26.Pietrowski E, Bender B, Huppert J, White R, Luhmann HJ, Kuhlmann CR. Pro-inflammatory effects of interleukin-17A on vascular smooth muscle cells involve NAD(PH)-oxidase derived reactive oxygen species. J Vasc Res. 2011;48:52–58. doi: 10.1159/000317400. [DOI] [PubMed] [Google Scholar]
- 27.Sareila O, Kelkka T, Pizzolla A, Hultqvist M, Holmdahl R. Nox2 complex-derived ROS as immune regulators. Antioxid Redox Signal. 2011;15:2197–2208. doi: 10.1089/ars.2010.3635. [DOI] [PubMed] [Google Scholar]
- 28.Streeter J, Thiel W, Brieger K, Miller FJ., Jr Opportunity Nox: the future of NADPH oxidases as therapeutic targets in cardiovascular disease. Cardiovasc Ther. 2012 Jan 26; doi: 10.1111/j.1755-5922.2011.00310.x. [Epub ahead of print] [DOI] [PubMed] [Google Scholar]
- 29.Bedard K, Jaquet V, Krause KH. NOX5: from basic biology to signaling and disease. Free Radic Biol Med. 2012;52:725–734. doi: 10.1016/j.freeradbiomed.2011.11.023. [DOI] [PubMed] [Google Scholar]
- 30.Zielonka J, Kalyanaraman B. Methods of Investigation of Selected Radical Oxygen/Nitrogen Species in Cell-free and Cellular Systems. In: Pantopoulos K, Schipper HM, editors. Principles of Free Radical Biomedicine. Vol. 1. Nova Science Publishers; 2012. [Google Scholar]
Associated Data
This section collects any data citations, data availability statements, or supplementary materials included in this article.