Abstract
Lymphoid-specific tyrosine phosphatase (LYP), a member of the protein tyrosine phosphatase (PTP) family of signaling enzymes, is associated with a broad spectrum of autoimmune diseases. Herein we describe our structure-based lead optimization efforts within a 6-hydroxy-benzofuran-5-carboxylic acid series culminating in the identification of compound 8b, a potent and selective inhibitor of LYP with a Ki value of 110 nM and more than 9-fold selectivity over a large panel of PTPs. The structure of LYP in complex with 8b was obtained by X-ray crystallography, providing detailed information about the molecular recognition of small-molecule ligands binding LYP. Importantly, compound 8b possesses highly efficacious cellular activity in both T- and mast cells and is capable of blocking anaphylaxis in mice. Discovery of 8b establishes a starting point for the development of clinically useful LYP inhibitors for treating a wide range of autoimmune disorders.
Introduction
Protein tyrosine phosphorylation is critical for the control of cellular processes such as proliferation, differentiation, metabolism and survival, as well as immune responses.1 Proper levels of tyrosine phosphorylation, regulated by the reciprocal action of protein tyrosine kinases (PTKs) and protein tyrosine phosphatases (PTPs), define the signaling threshold for a given stimulus and are critical for normal physiology and development. Consequently, alterations in the expression or activity of PTKs as well as PTPs can have dire pathophysiological consequences. Indeed, defects in tyrosine phosphorylation-mediated signaling events are associated with many human diseases including cancer, diabetes/obesity, and autoimmune disorders.1,2 More than a dozen drugs targeting PTKs have been approved for clinical use over the past decade, and many more are undergoing clinical trials.3 However, the therapeutic potential of modulating the PTPs is still underexplored despite the fact that several PTPs have been identified as high value targets.4,5
Genetic studies in human autoimmunity have brought lymphoid-specific tyrosine phosphatase (LYP) to the spotlight. LYP is expressed exclusively in immune cells6 and functions as a negative regulator of T cell receptor (TCR) signaling pathways, likely through dephosphorylation of the Lck and ZAP-70 kinases.7–9 A missense C1858T single nucleotide polymorphism in the gene encoding LYP, PTPN22, was found to be a common risk factor for multiple autoimmune disorders, including type I diabetes,10 rheumatoid arthritis,11,12 Graves disease,13 systemic lupus erythematosus,14 myasthenia gravis,15,16 and generalized vitiligo.17,18 In fact, the PTPN22 locus is one of the strongest risk factors outside of the major histocompatability complex that associates with autoimmune diseases.19 The C1858T variation converts an Arg at position 620 into a Trp within the first Pro-rich region in the C-terminus of LYP, diminishing the ability of LYP to bind to the SH3 domain of the Src C-terminal kinase (Csk).10,11 Importantly, this autoimmune-predisposing LYP-W620 variant is a gain-of-function form of the phosphatase, rendering increased inhibition of T- and B-cell signaling compared to the wild-type enzyme.20–24 Interestingly, a loss-of-function LYP variant is linked to reduced risk of systemic lupus erythematosus.25 A more recent report indicated that LYP plays an important role in Treg generation and function, and mice lacking LYP show improved immunosuppressive responses.26 Moreover, inducible LYP knockdown in non-obese diabetic mice conferred protection from type 1 diabetes.27 Taken together, these data establish LYP as an exciting target for pharmacological intervention of a broad spectrum of autoimmune disorders.
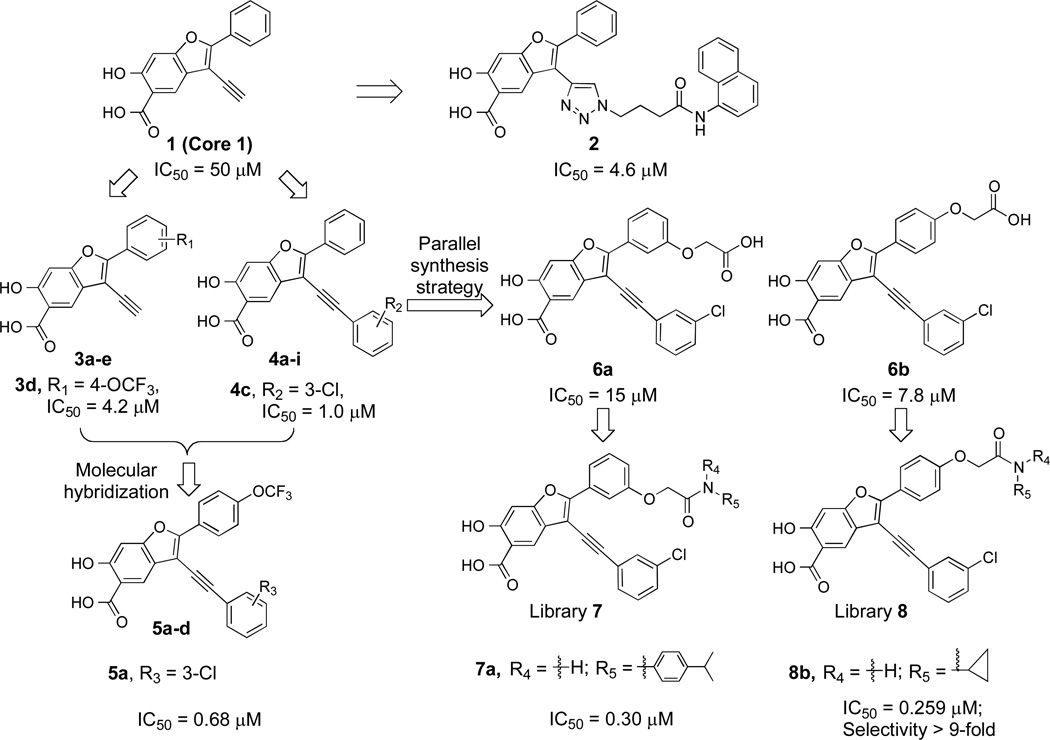
Given the strong linkage of LYP to autoimmunity, there is increasing interest in developing LYP-based small molecule therapeutics.24, 28–35 Unfortunately, most of the existing LYP inhibitors lack the required potency, selectivity, and/or in vivo efficacy for clinical evaluation. Indeed, PTP-based drug discovery programs have historically been shrouded with difficulty in inhibitor selectivity and bioavailability, both of which stem from the intrinsic properties of the PTP active site. The pTyr binding pocket, which represents the PTP active site, is highly conserved, so achieving PTP inhibitor selectivity is extremely challenging. Moreover, the PTP active site is also positively charged, so brute-force compound screening campaigns usually lead to the identification of negatively charged molecules that do not readily penetrate cell membranes. Since a disproportionally high percentage of FDA-approved drugs originate from natural products, we have focused our effort to search for natural product-like PTP inhibitory agents. We discovered that bicyclic salicylates can serve as effective nonhydrolyzable pTyr mimicries and are sufficiently polar to bind the PTP active site, yet remain capable of efficiently crossing cell membranes.36 One effective strategy to enhance PTP inhibitor potency and selectivity has been to link appropriately functionalized diversity elements to a nonhydrolyzable pTyr mimetic in order to engage less conserved interactions outside of the pTyr-binding cleft.37,38 We describe here a structure-based focused library approach that transforms the 6-hydroxy-benzofuran-5-carboxylic acid Core 1 (Figure 1) into the highly potent and selective LYP inhibitor compound 8b, which has efficacious activity in both cells and live animals. X-ray crystallographic analysis of the structure of LYP in complex with compound 8b reveals detailed information about the molecular recognition of small-molecule inhibitors binding LYP. This compound represents an excellent starting point for the development of clinically useful LYP inhibitors for the treatment of a wide variety of autoimmune diseases.
Figure 1.
A structure-based focused library approach transforms the 6-hydroxy-benzofuran-5-carboxylic acid Core 1 into the highly potent and selective LYP inhibitor 8b.
Results
Development of a potent and selective LYP inhibitor based on the 6-hydroxy-benzofuran-5-carboxylic acid core 1
Our initial effort in LYP inhibitor discovery involved the use of Click chemistry to tether 80 azide-containing amines to an alkyne-containing 6-hydroxy-benzofuran-5-carboxylic acid scaffold (Core 1) aimed to target secondary binding pockets in the vicinity of the PTP active site. This led to the identification of compound 228 (Figure 1) as a reversible and competitive LYP inhibitor. However, despite the highly efficacious cellular activity, the potency (IC50 = 4.6 ± 0.4 µM) and selectivity (2.6-fold against PTP1B and >7-fold against SHP2, HePTP, PTP-Meg2, FAP1, CD45, LAR, PTPα, and VHR) displayed by 2 are relatively modest, and therefore not adequate for chemical biological investigation and therapeutic development.
To guide the development of next generation LYP inhibitors, we solved the structure of LYP in complex with compound 2.28 The co-crystal structure reveals that compound 2 binds the LYP active site with the 6-hydroxy-benzofuran-5-carboxylic acid situated in the catalytic site, making a number of hydrogen bonds with the main chain amide of Ala229, the side chains of Cys227 and Cys129, and charge-charge interactions with Arg233 and Lys138, as well as aromatic stacking interactions with Tyr60 and Van der Waals contacts with the aliphatic side chains of Gln274, Ser228, Ala229, and Lys138. In addition, the distal naphthalene ring in 2 occupies a unique peripheral site defined by Phe28, Leu29, and Arg33, which form a pocket equivalent to the second aryl phosphate-binding site previously identified in PTP1B.37 Unfortunately, the phenyl ring attached to the 2-position of the benzofuran core (Figure 1) was not resolved in the structure, likely due to flexibility as a result of weak interaction with LYP. Additionally, no significant contact was observed between the triazolidine ring linker and LYP. Based on these structural findings and chemical tractability, we devised a molecular hybridization and parallel synthesis strategy to modify the phenyl ring at the 2-position and the alkyne group at the 3-position (Figure 1) of the benzofuran core in order to enhance binding interactions with LYP. This entails (1) modification of the 2-phenyl ring of the benzofuran scaffold to generate compounds 3a–e, (2) introduction of different aryl substituents to the 3-ethynyl of benzofuran scaffold to create 4a–i, and (3) combination of the top hits from both 3a–e and 4a–i to generate 5a (Figure 1).
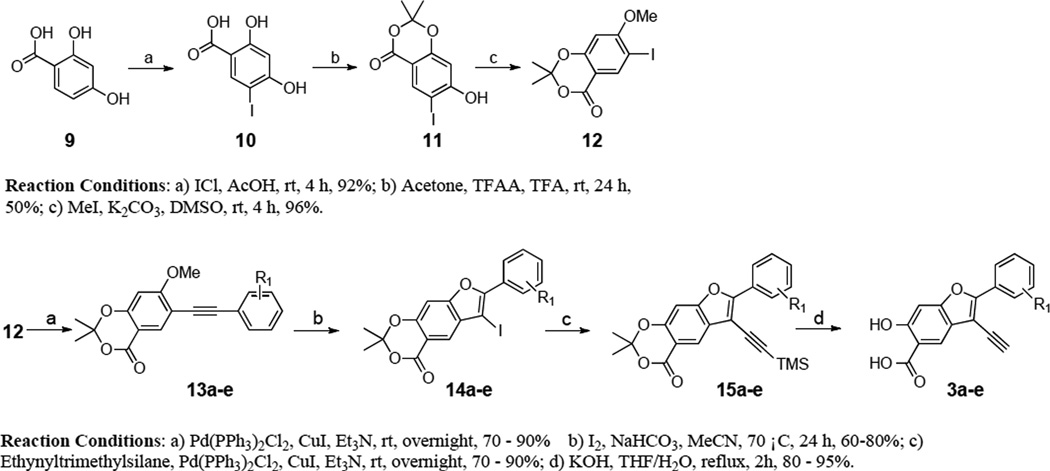
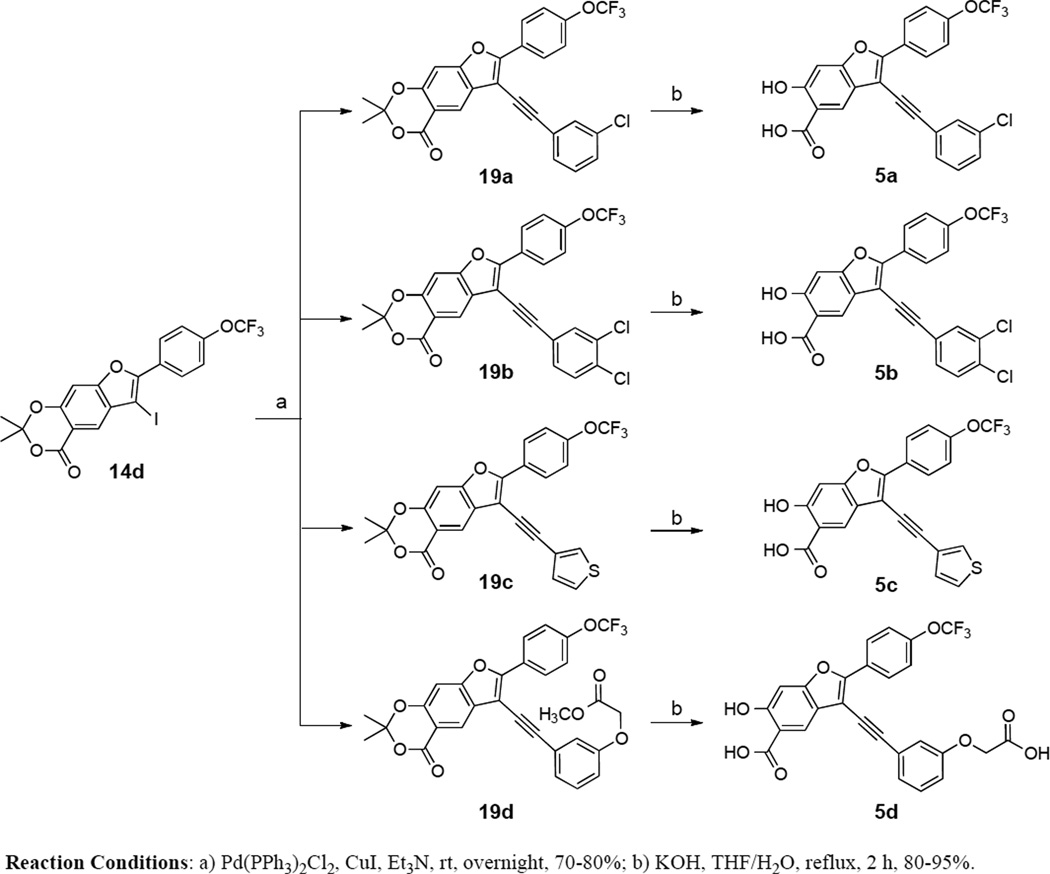
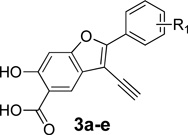
We first sought to optimize the activity of Core 1 for LYP through introduction of different substituents in the 2-phenyl ring. As outlined in Scheme 1, the key intermediate 12 was prepared by a reported procedure.39 Compound 12 was coupled with appropriate alkynes by Sonogashira reaction to produce 13a–e, which were cyclized in the presence of I2, yielding 6-iodo-7-(substituted-phenyl)-2,2-dimethyl-4H-[1,3]dioxino[5,4-f]benzofuran-4-one 14a–e. Subsequently, the replacement of the iodo group of 14a–e by the acetylene group produced 15a–e, which upon hydrolysis were transformed to the corresponding 2-(substituted-phenyl)-3-ethynyl-6-hydroxybenzofuran-5-carboxylic acid 3a–e. The ability of the compounds to inhibit LYP-catalyzed hydrolysis of the chromogenic substrate p-nitrophenyl phosphate (pNPP) was evaluated at pH 7 and 25 °C. As shown in Table 1, the inhibitory potency of compounds 3a–e improved 5 to 27.5 fold compared to the starting Core 1 (IC50 = 50 µM). Selectivity profiling indicated that only compound 3d exhibited a moderate selectivity (2- to 10 fold) against a number of human PTPs (data not shown). Meanwhile, through a concurrent program to increase interaction between the enzyme and inhibitory agents, substituents were attached to the 3-position of the benzofuran scaffold. We synthesized compounds 4a–i by coupling appropriate aryl acetylenes to this position (Scheme 2). Compounds 4a–i were also prepared from compound 12 as reported in our previous work.39 These compounds were assayed for LYP inhibition, leading to the identification of LYP inhibitors 4c (IC50 = 1.0 µM) and 4i (IC50 = 0.63 µM) (Table 2), which are 50-fold more potent than the original lead compound Core 1. Results from selectivity profiling showed that compound 4c had better selectivity than 4i (data not shown). We then hypothesized that merging compound 3d and 4c into one structure might further improve potency and selectivity (Figure 1). With this in mind, we synthesized the hybrid inhibitor 5a (IC50 = 0.68 µM), as well as three analogues (5b–d) of 5a (Scheme 3). Unfortunately, these compounds exhibited only minor improvement in IC50 values compared to the parent compounds 3d or 4c (Table 3). No significant increase in selectivity was observed for the hybrid compounds (data not shown).
Scheme 1.
Synthesis of compounds 3a–e.
Table 1.
IC50 of Core 1-based analogues (3a–e) against LYP.
 | ||
|---|---|---|
| Compd # | IC50 (µM) | |
| 3a | 8.4 ± 0.3 | |
| 3b | 1.82 ± 0.06 |
|
| 3c | 10.0 ± 1 | |
| 3d | 4.2 ± 0.6 | |
| 3e |  |
5.2 ± 0.2 |
Scheme 2.
Synthesis of compounds 4a–i.
Table 2.
IC50 of Core 1-based analogues (4a–i) against LYP.
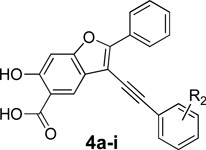 | ||
|---|---|---|
| Cmpd # | R2 = | IC50 (µM) |
| 4a | H | 4.9 ± 0.3 |
| 4b | 3-F | 3.9 ± 0.2 |
| 4c | 3-Cl | 1.0 ± 0.07 |
| 4d | 3-OCH3 | 17 ± 1 |
| 4e | 2,4-di-F | 3.5 ± 0.2 |
| 4f | 3,5-di-F | 1.3 ± 0.1 |
| 4g | 3-CF3 | 2 ± 0.1 |
| 4h | 4-OCF3 | 2 ± 0.1 |
| 4i | 4-OC6H5 | 0.63 ± 0.03 |
Scheme 3.
Synthesis of compounds 5a–d.
Table 3.
IC50 of compounds 5a–d against LYP.
| Cmpd # | Structure | IC50 (µM) |
|---|---|---|
| 5a | 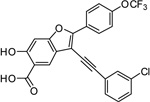 |
0.68 ± 0.08 |
| 5b | 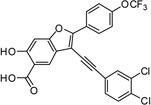 |
0.61 ± 0.03 |
| 5c | 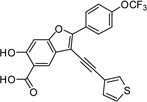 |
2.1 ± 0.3 |
| 5d | 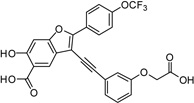 |
2.5 ± 0.2 |
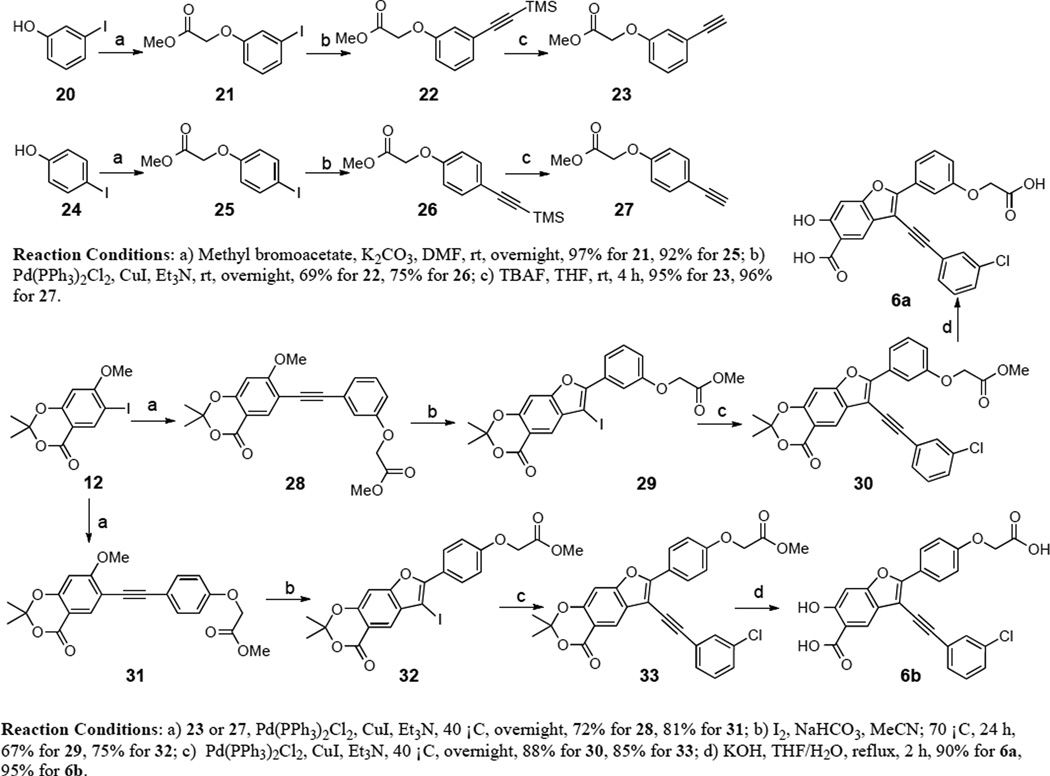
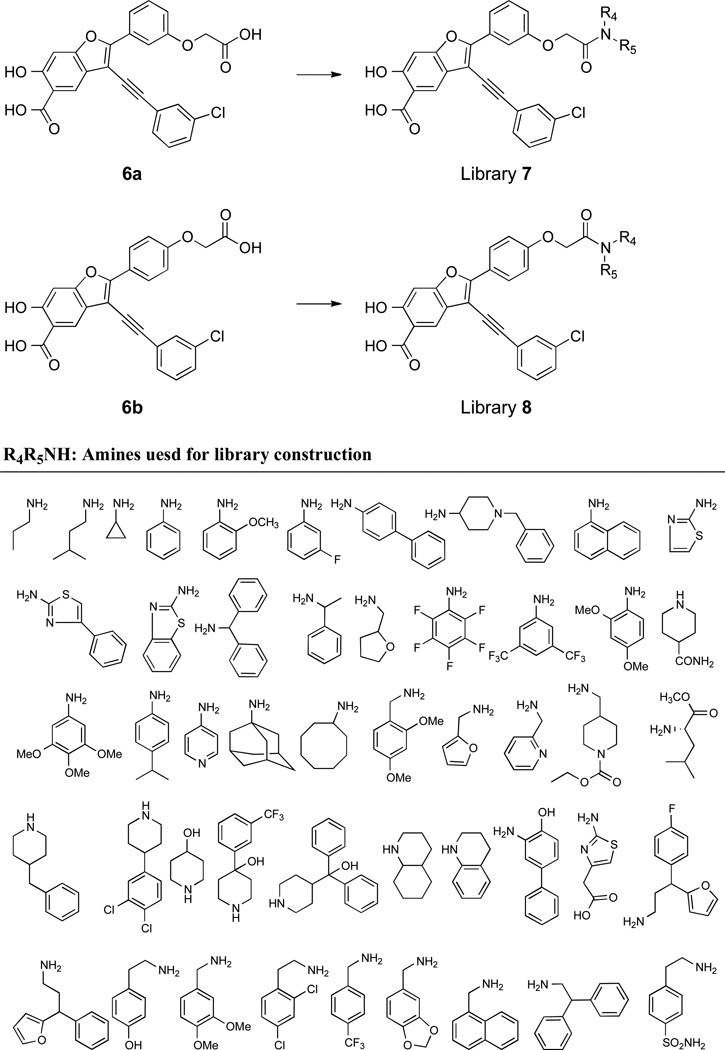
To further improve the potency and selectivity of compound 5a, we embarked on a focused library approach to introduce molecular diversity at the 2-phenyl ring in order to capture additional interactions with LYP. This strategy was based on the limited but promising SAR on the 2-phenyl ring (compound 3 series), which suggests that a more thorough exploration of the substitutions in the 2-phenyl ring of 5a may lead to the identification improved LYP inhibitory agents. To this end, substituted acetic acid was introduced to either the meta- or para-position of the 2-phenyl ring to generate compounds 6a and 6b (Scheme 4). The starting methyl 2-(3-ethynylphenoxy)acetate 23 and methyl 2-(4-ethynylphenoxy)acetate 27, obtained from 3-iodophenol and 4-iodophenol, were coupled with compound 12 in DMF to afford methyl 2-(3-((7-methoxy-2,2-dimethyl-4-oxo-4H-benzo[d][1,3]dioxin-6-yl)ethynyl)phenoxy)acetate 28 and methyl 2-(4-((7-methoxy-2,2-dimethyl-4-oxo-4H-benzo[d][1,3]dioxin-6- yl)ethynyl)phenoxy)acetate 31. Synthesis of target compounds 6a and 6b utilized compounds 28 and 31 as starting materials in a procedure similar to that developed for preparing 4a–i.39 Compounds 6a and 6b inhibited LYP with IC50 values of 15 and 7.8 µM, respectively. The decrease in binding affinity for 6a and 6b might be caused by the negative charge introduced into the 2-phenyl ring and elimination of the charge through amide condensation reaction could increase binding potency. Thus, compounds 6a and 6b were combined with a structurally diverse set of 48 commercially available amines through well-established amide chemistry to create library 7 and library 8 (Figure 2) in order to target sub-pockets that border the active site. These two libraries were screened for inhibition of LYP-catalyzed hydrolysis of pNPP at pH 7 and 25 °C. On the basis of our screening data, compounds with para-substituted amides from library 8 are more potent than those with meta-substituted amides from library 7. Compound potency appears to be driven by the hydrophobic character of the amide substituents. The top 8 hits identified from screening were re-synthesized, purified, and their IC50 values were determined. As shown in Table 4, compounds 8a and 8b are most potent for LYP with IC50 values of 0.171 ± 0.004 and 0.259 ± 0.007 µM, respectively. To determine the specificity of compounds 8a and 8b for LYP, their inhibitory activity toward a panel of mammalian PTPs including cytosolic PTPs, PTP1B, SHP1, SHP2, TC-PTP, HePTP, PTP-Meg2, PTP-PEST, FAP1, and PTPH1, the receptor-like PTPs, CD45, LAR, PTPα, PTPβ, PTPε, PTPγ, PTPµ, and PTPσ, the dual specificity phosphatases Laforin, VHR, VHX, VHZ, MKP3, and Cdc14, and the low molecular weight PTP were measured. As shown in Table 5, the selectivity of compound 8b is superior to 8a. Compound 8b exhibits at least 9-fold selectivity for LYP over all PTPs examined.
Scheme 4.
Synthesis of compounds 6a and 6b.
Figure 2.
The preparation of libraries 7 and 8 using amide chemistry. The structures of the starting compounds 6a and 6b as well as the structures of the 48 amines are shown.
Table 4.
IC50 of the top eight hits from libraries 7 and 8 against LYP.
| Cmpd # | Structure | IC50 (µM) |
|---|---|---|
| 7a | 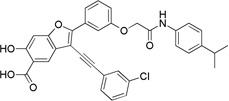 |
0.30 ± 0.009 |
| 8a | 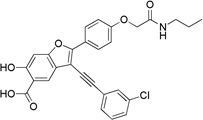 |
0.171 ± 0.004 |
| 8b | 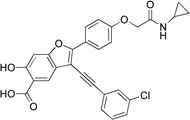 |
0.259 ± 0.007 |
| 8c | 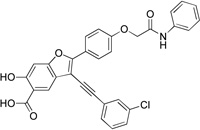 |
0.263 ± 0.006 |
| 8d | 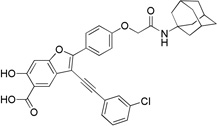 |
0.31 ± 0.008 |
| 8e | 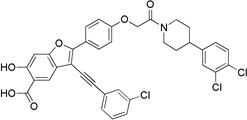 |
0.55 ± 0.03 |
| 8f | 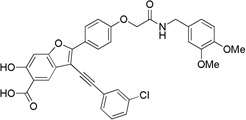 |
0.259 ± 0.008 |
| 8g | 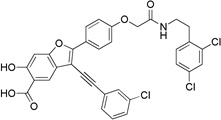 |
0.67 ± 0.03 |
Table 5.
IC50 values of 8a and 8b against a panel of PTPs.
| PTP | IC50 (µM) for 8a | IC50 (µM) for 8b |
|---|---|---|
| LYP | 0.171 ± 0.004 | 0.259 ± 0.007 |
| PTP1B | 1.7 ± 0.4 | 10 ± 1 |
| SHP1 | 0.91 ± 0.09 | 5 ± 0.5 |
| SHP2 | 0.56 ± 0.03 | 2.5 ± 0.1 |
| TC-PTP | 11.3 ± 0.5 | 24 ± 1 |
| HePTP | 3 ± 0.6 | 15 ± 2 |
| PTP-Meg2 | 0.59 ± 0.03 | 3 ± 0.3 |
| FAP1 | 0.39 ± 0.02 | 2.9 ± 0.2 |
| PTP-PEST | 0.80 ± 0.10 | 2.4 ± 0.3 |
| PTPH1 | 1.6 ± 0.6 | 13 ± 4 |
| CD45 | 3.2 ± 0.6 | 12 ± 5 |
| LAR | No inhibition at 100 µM | No inhibition at 100 µM |
| PTPα | No inhibition at 100 µM | No inhibition at 100 µM |
| PTPβ | 0.47 ± 0.05 | 12 ± 5 |
| PTPε | >25 | >25 |
| PTPγ | 4 ± 2 | 15 ± 6 |
| PTPµ | 7 ± 1 | 12 ± 2 |
| PTPσ | No inhibition at 100 µM | No inhibition at 100 µM |
| Laforin | No inhibition at 100 µM | No inhibition at 100 µM |
| VHR | 5.9 ± 0.5 | 14 ± 1 |
| VHX | 2.9 ± 0.6 | 4.6 ± 0.7 |
| VHZ | 3.4 ± 0.3 | 5.7 ± 0.7 |
| MKP3 | No inhibition at 100 µM | No inhibition at 100 µM |
| CDC14 | 30 ± 10 | 24 ± 2 |
| LMWPTP | 0.34 ± 0.07 | 7 ± 2 |
All measurements were made by using pNPP as a substrate at pH 7.0, 25°C, and ionic strength of 0.15 M.
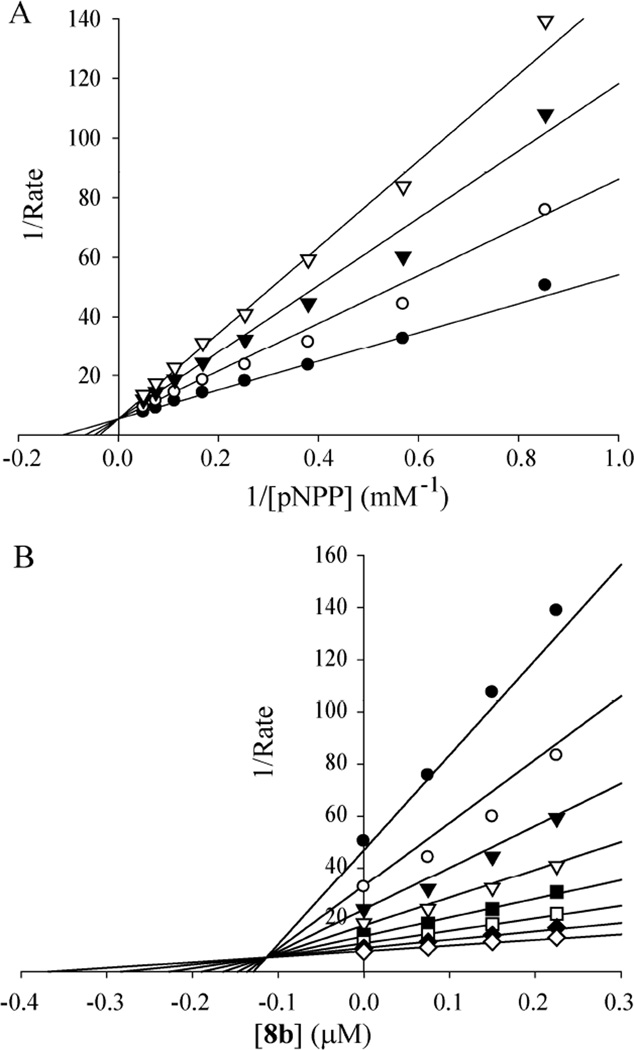
To further characterize compound 8b as a LYP inhibitor, its IC50 value was determined under two different conditions: 1) 8b was pre-mixed with pNPP, and the reaction was initiated by the addition of LYP; and 2) 8b was pre-mixed with the enzyme for 30 minutes, and the reaction was initialized by the addition of pNPP. Irreversible, promiscuous nonspecific, or tight-binding inhibitors would be expected to exhibit significantly reduced IC50 values when they are pre-incubated with the enzyme. Similar IC50 values were obtained for compound 8b under these two conditions (8b pre-mixed with pNPP, IC50 = 0.259 ± 0.007 µM; 8b pre-mixed with the enzyme, IC50 = 0.250 ± 0.02 µM.), suggesting that LYP inhibition by 8b is reversible. Detailed kinetic analyses revealed that 8b is a competitive inhibitor for LYP with a Ki of 110 ± 3 nM (Figure 3). Thus, 8b represents the most potent and selective LYP inhibitor reported to date.
Figure 3.
Lineweaver-Burk plot (A) and Dixon plot (B) for compound 8b–mediated LYP inhibition using pNPP as a substrate. pNPP concentrations were 1.17, 1.76, 2.63, 3.95, 5.93, 8.89, 13.3, and 20 mM. Compound 8b concentrations were 0 (•), 75 (μ), 150 (τ), and 225 (∇) nM, respectively.
Structural basis of LYP inhibition by compound 8b
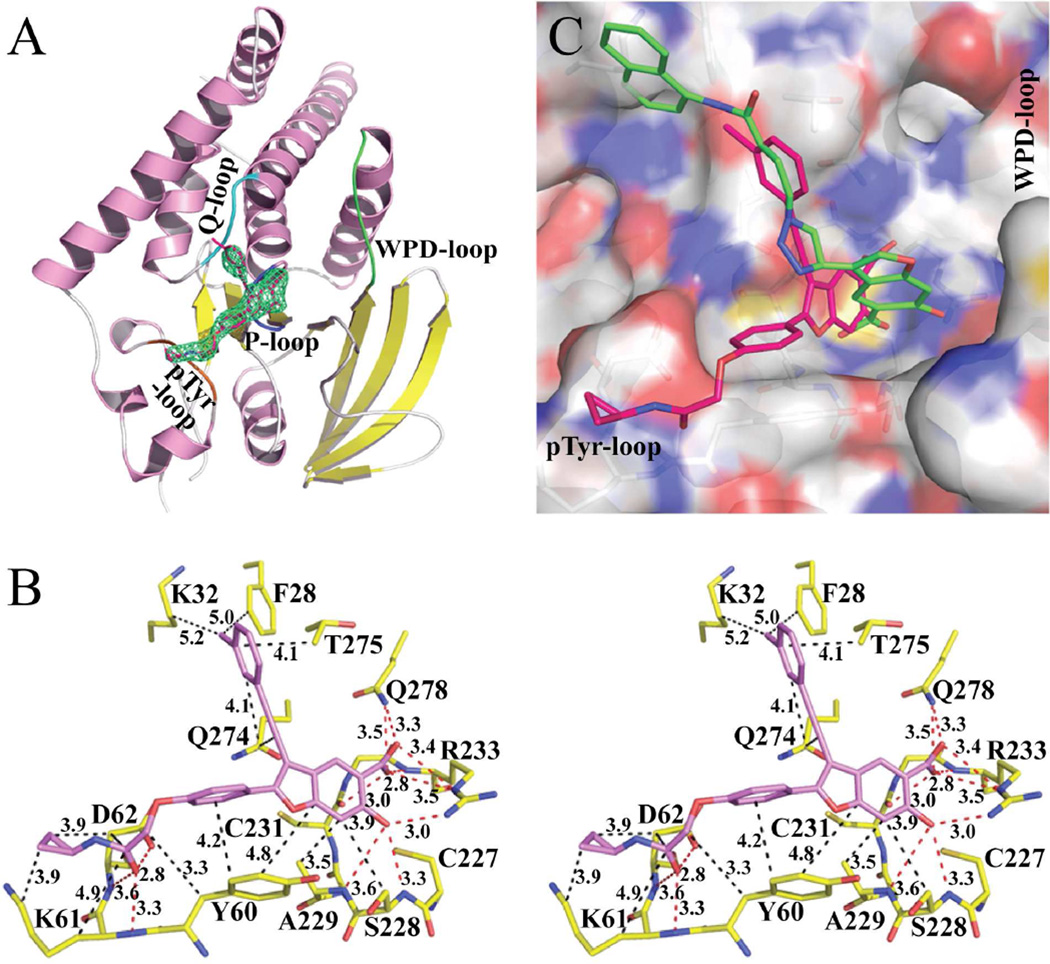
To determine the structural basis for LYP inhibition by compound 8b, we crystallized the PTP domain of LYP (residues 1–303) with 8b. The three dimensional structure of LYP•8b was solved by molecular replacement using the coordinates of LYP apo form (PDB entry code: 2P6X)40 as a search model and refined to 2.30 Å resolution. The details of the crystals and structure solution are summarized in Table 6. Unambiguous electron densities were observed for compound 8b in the LYP active site as shown by the unbiased Fo - Fc difference Fourier maps contoured at 3.0σ (Fig. 4A). Similar to other reported PTP structures, the LYP catalytic domain adopts a structure comprising a central eight β-stranded sheet surrounded by six α-helixes on one side and two α-helixes on the other (Figure 4A). The PTP signature motif (H226CSAGCGR233) forms a loop (P-loop, colored in blue in Figure 4A) at the base of the active-site pocket. The overall structure of LYP•8b is quite similar with the initial search model used for molecular replacement.
Table 6.
Data collection and refinement statistics
| LYP•8b | |
|---|---|
| Crystal parameters | |
| space group | P212121 |
| Cell Dimensions | |
| a (Å) | 46.19 |
| b (Å) | 93.64 |
| c (Å) | 153.50 |
| Data Collection | |
| resolution range (Å) | 50.0 – 2.30 |
| no. of unique reflections | 28140 |
| completeness (%) | 93.3 |
| redundancy | 6.3 |
| Rmergea | 0.065 |
| Refinement | |
| resolution range (Å) | 50.0 – 2.30 |
| no. of reflections used (F≥1.5δ (F)) | 26388 |
| completeness (%) | 86.7 |
| no. of protein atoms | 4998 |
| no. of inhibitors | 2 |
| no. of waters | 48 |
| Rworkb/Rfreec | 18.87/23.81 |
| rms Deviations from Ideal Geometry | |
| bond length (Å) | 0.010 |
| bond angle (°) | 1.42 |
Rmerge = ΣhΣi|I(h)i – 〈I(h)〉 |/Σ hΣiI(h)i.
Rwork=Σ h|F(h)calcd – F(h)obsd|/ΣhF(h)obsd, where F(h)calcd and F(h)obsd were the refined calculated and observed structure factors, respectively.
Rfree was calculated for a randomly selected 4.2% of the reflections that was omitted from refinement.
Figure 4.
Crystal structure of LYP in complex with compound 8b. (A). Overall structure of LYP catalytic domain in complex with 8b. α helices and β strands are colored in pink and yellow, respectively. The P-loop is shown in blue, the WPD-loop in green, the Q-loop in cyan, and the pTyr-loop in orange. Compound 8b is shown in stick model with unbiased Fo-Fc map contoured at 3.0σ calculated before the ligand and water molecules were added to the model. (B). Detailed interactions between compound 8b and LYP. Polar interactions or H-bonds are shown by red dashed lines; hydrophobic interactions are shown in black dashed lines. Residues involved in polar or hydrophobic interactions are shown with a cutoff distance of 3.6 and 5.2 Å, respectively. (C). Binding mode comparison between compound 8b and compound 2. The superposition of LYP•8b and LYP•2 was calculated with active site residues without the ligands. LYP active site was shown by transparent surface representation, and the key residues are depicted in stick model. Atomic colors were as follows: oxygen – red, carbon – white, sulfur – orange, and nitrogen – blue. Carbon atoms of 8b were colored red, and compound 2’s carbon atoms were colored green. For 2, the phenyl ring on the 2-position of the benzofuran core was invisible in the crystal structure.
Consistent with the ability of salicylic acid derivatives to serve as effective pTyr surrogates28,41–43 and the observed competitive mode of LYP inhibition by 8b, the 6-hydroxy-benzofuran-5-carboxylic acid moiety is found in the LYP active-site pocket. Interestingly, 8b targets an inactive LYP conformation because the WPD loop (residues 193–204), which harbors the general acid-base catalyst Asp195, is fully open in the LYP•8b structure (colored in green in Figure 4A). The remarkable potency and selectivity of 8b for LYP are the results of numerous specific interactions with both the active site and its nearby peripheral pockets (Figure 4B). The 6-hydroxy-benzofuran-5-carboxylate is engaged in both polar and hydrophobic interactions with the LYP active site. The carboxylate in 8b forms hydrogen bonds with the main-chain amide of Arg233, the side chains of Arg233 and Gln278, and a charge-charge interaction with the main-chain oxygen of Cys231. The adjacent hydroxyl group in 6-hydroxy-benzofuran-5-carboxylic acid makes three additional hydrogen bonds with the main-chain amides of Ser228 and Ala229 as well as the side-chain of Arg233, which further strengthens its polar interactions with the active site. In addition to the polar interactions, the benzofuran ring participates in hydrophobic interactions with Tyr60 in the pTyr recognition loop (residues 58–63) and Van der Waals contacts with the aliphatic side chains of Gln274 in the Q-loop (residues 269–278), and Ala229 and Ser228 in the P-loop. Besides interactions within the LYP active site, the phenyl ring connected to the 2-position of the benzofuran core makes aromatic–aromatic stacking interactions with Tyr60 in the pTyr recognition loop and Van der Waals contacts with side chain atoms (Cγ, Oδ1, and Oδ2) of Asp62. In addition, the distal cyclopropanamide in 8b also interacts with the pTyr recognition loop by contributing H-bonds with the main-chain amides of Lys61 and Asp62, donating a charge-charge interaction with the side chain of Asp62, and making hydrophobic contacts with the side chains of Tyr60, Lys61 and Asp62 (Figure 4B). This binding site is equivalent to the −1 binding pocket previously identified in the PTP1B-phosphopeptide structures.44 Given the hydrophobic nature of this binding site, it is not surprising that compounds 8a–g have comparable IC50 values against LYP (Table 4), indicating that they inhibit LYP with a similar binding mode. The LYP.8b structure also provides insight into why the affinity of 6b is lower than that of 5a, likely due to an electrostatic repulsion between the carboxylate in the 2-phenyl ring and the side-chain of Asp62 (the distance between the two carboxylate groups is 3 Å). Finally, the 3-chlorophenyl ring attached to the 3-ethynyl group participates in Van der Waals interactions with the aliphatic side chains of Gln274 and Thr275 in the Q-loop. The chlorine atom may also make Van der Waals contacts with the side chains of Lys32 and Phe28, which are close to a LYP-specific insert (residues 35–42).
Although both compounds 8b and 2 bind to the active site of LYP, their binding modes are quite different. Compared to 8b, the benzofuran moiety in 2 rotates 100° anti-clockwise and shifts 2.4 Å to the right (Figure 4C). Superposition of the LYP•8b and LYP•2 structures reveals that the 6-hydroxy-benzofuran-5-carboxylate in 8b extends deeper into the LYP active site. The carboxylate in 2 is located at the same position of the hydroxyl group in 8b. Thus the 6-hydroxy-benzofuran-5-carboxylate moiety in 8b experiences more and stronger polar and hydrophobic interactions with the LYP active site than that in 2. For example, the salicylate in 8b is engaged in 9 polar interactions with the LYP active site, while only 6 polar interactions are found in the LYP•2 structure.28 Most of the Van der Waals contact distances between the benzofuran core in 8b and LYP residues are within 4 Å, while in the LYP•2 structure, these distances are longer than 4.0 Å. Furthermore, the substituted phenyl group at the 2-position of the benzofuran ring in 8b makes extensive hydrophobic interactions with the pTyr recognition loop, while the corresponding phenyl ring in 2 is invisible in the co-crystal structure. These increased and stronger interactions between 8b and LYP are consistent with the 26.6-fold increase in binding affinity for 8b (Ki = 2.9 µM for 2).
Compound 8b increases T cell activation
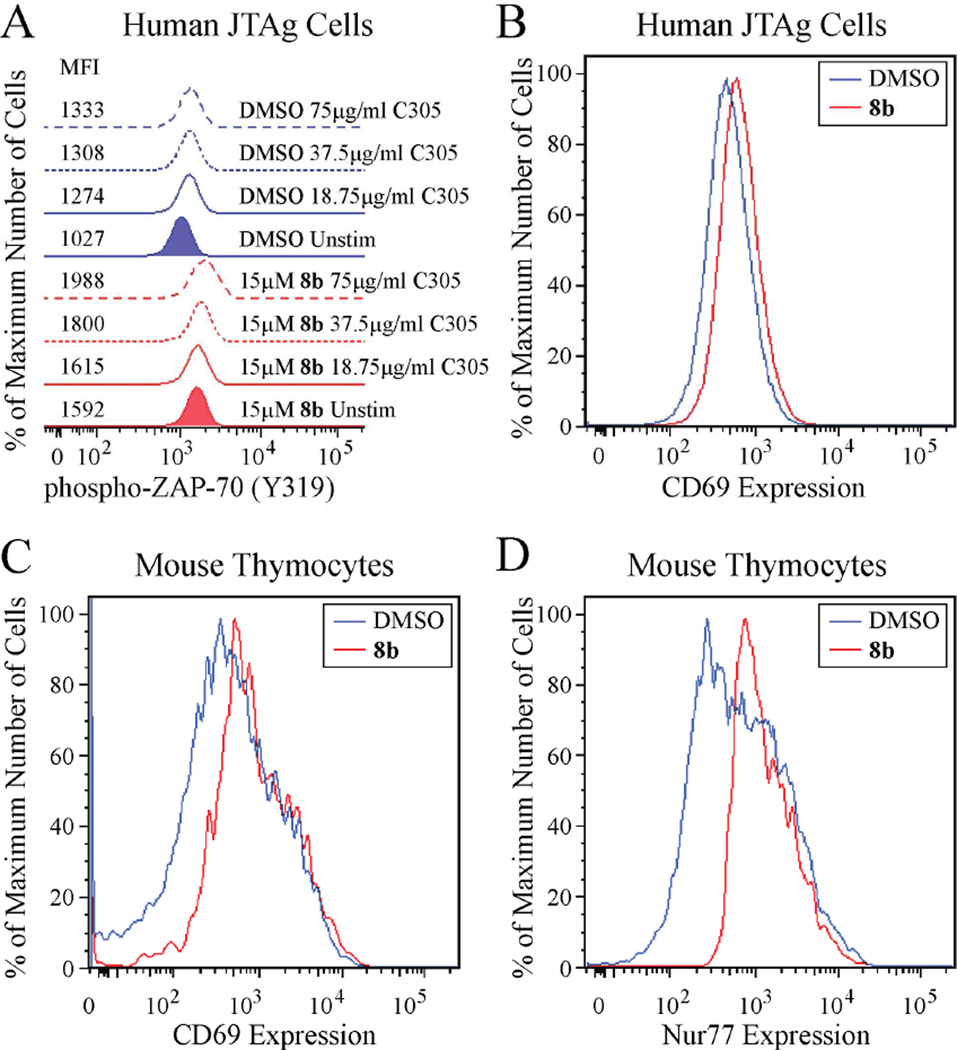
Given the excellent potency and selectivity of 8b for LYP, we proceeded to evaluate the ability of 8b to inhibit LYP inside the cell. As LYP acts as a potent inhibitor of signaling through the T cell receptor (TCR),45 we first tested the effect of the compound on early TCR signaling in JTAg cells, a human T cell line. As shown in Figure 5A, treatment of JTAg cells with 15 µM 8b increased both basal and TCR-stimulated phosphorylation of ZAP-70 on Tyr319. Given the increased activation of ZAP-70 in resting cells, we next tested whether the compound induces downstream activation of T cells, as assessed by surface expression of CD69, a marker of T cell activation.46 As shown in Figure 5B, treatment of JTAg cells with 15 µM 8b led to increased expression of CD69 in resting JTAg cells. We next sought to determine whether 8b inhibits PEP, the mouse ortholog of LYP, in primary mouse T cells, by determining the effect of the compound on the activation of thymocytes. As shown in Figure 5C, treatment of mouse thymocytes with 15 µM 8b effectively caused an increase in the activation of double-positive (DP) thymocytes, as evidenced by increased surface expression of CD69, and increased expression of Nur77, an immediate early gene induced in thymocytes upon TCR stimulation (Figure 5D).47 Taken together, these data indicate that 8b is effective at inhibition of LYP/PEP in T cells, increasing both early TCR signaling and downstream T cell activation.
Figure 5.
The LYP inhibitor 8b increases T cell activation. (A) Compound 8b increases activation of ZAP-70 in human T cells. JTAg cells were pre-incubated with 15 µM 8b (red graphs) or DMSO alone (blue graphs) for 30 min at 37°C, followed by stimulation with increasing concentrations of C305 supernatant (18.75 µg/ml, solid lines; 37.5 µg/ml, dashed lines; 75 µg/ml, long-dashed lines) or left unstimulated (shaded graphs) for 2 min at 37°C. Graphs show cell fluorescence after staining with an AlexaFluor-488-conjugated anti-phospho-ZAP-70 (Y319) antibody. Median fluorescence intensity (MFI) of each sample is shown. (B) Compound 8b increases CD69 expression on human T cells. JTAg cells were incubated with 15 µM 8b (red graph, MFI=616) or DMSO alone (blue graph, MFI=451) for 4.5 hours at 37°C. Graphs show cell fluorescence after staining with a FITC-conjugated anti-CD69 antibody. (C–D) Compound 8b increases the activation of primary mouse T cells. Thymocytes from Nur77GFP mice were incubated with 15 µM 8b (red graph) or DMSO alone (blue graph) for 3.5 hours at 37°C. (C) Graphs show cell fluorescence after staining with a FITC-conjugated anti-CD69 antibody (MFI of 8b–treated sample=758; MFI of DMSO-treated sample=381). (D) Graphs show Nur77 expression as assessed by GFP cell fluorescence (MFI of 8b–treated sample=1120; MFI of DMSO-treated sample=604). Histograms from all 8b–treated samples in this figure were assessed compared to histograms from the respective DMSO-treated samples using the Kolmogorov-Smirnov test, and the distributions were found to be distinct with 99.9% confidence. Data in this figure are representative of 2 independent experiments with similar results.
Compound 8b down-regulates mast cell action and inhibits anaphylaxis in mice
Anaphylaxis is controlled by rapid lipid mediator release, degranulation and by pro-inflammatory cytokine synthesis in mast cells48 Activated mast cells promote allergic inflammation following the release of biochemical mediators.49 IgE mediated signaling through the LAT-PLCγ-Ca2+ pathway does not only end up in activation of the activity of the transcription factor NF-AT but also leads to degranulation. Degranulation occurs through the process of exocytosis whereby cargo proteins and other molecules are loaded into vesicles and shuttled to different subcellular locations for fusion events.50 It results in the release of preformed mediators like β-hexosaminidase, serotonin, neural proteases and, histamine from the mast cell granules which causes an increase in vascular permeability, bronchoconstriction and inflammatory reaction in the mucosa.
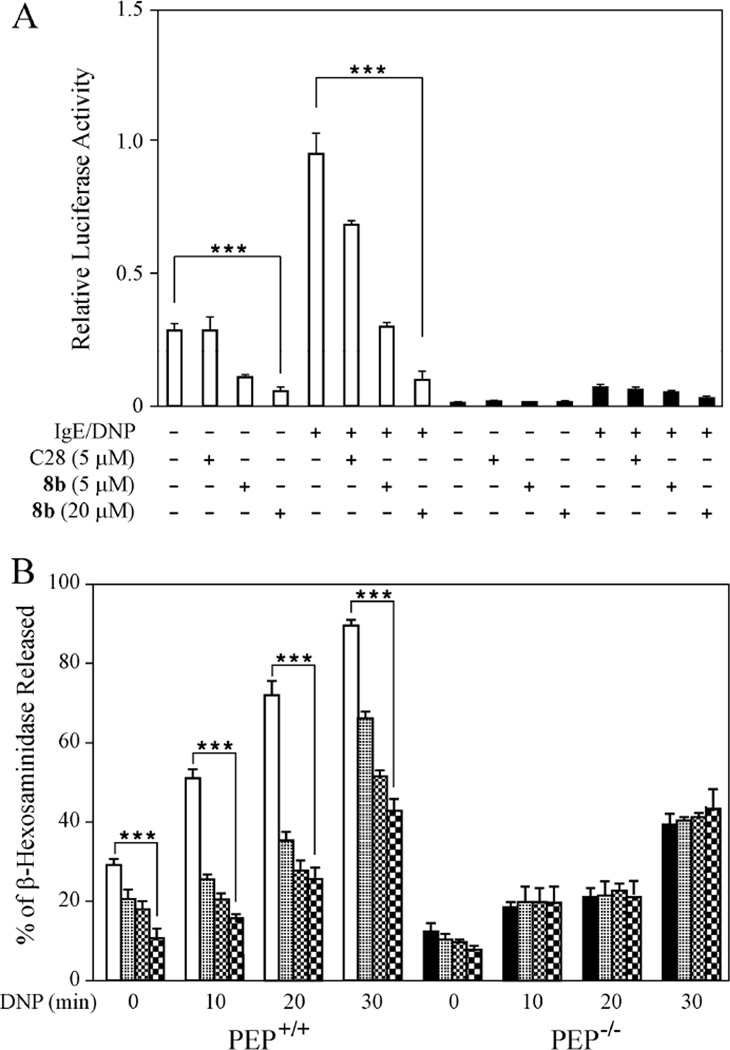
PEP was recently shown to function as a positive regulator of mast cell action because bone marrow derived mast cells (BMMC) from PEP−/− mice displayed impaired PLCγ1 phosphorylation and Ca2+ mobilization.51 In addition, mice deficient in PEP are less susceptible to passive systemic anaphylaxis.51 Additionally, it was demonstrated that a gold (I) compound C2832 that inhibits the action of LYP could mimic the decreased PLCγ1 phosphorylation and susceptibility to systemic anaphylaxis of the PEP−/− BMMC and reduced anaphylaxis in mice.51 Here we characterized compound 8b in mast cells and the passive systemic anaphylaxis mouse model and compared its effects with those of C28. As intracellular Ca2+ controls the expression of the transcription factor NF-AT, we compared the activity of this transcription factor in BMMC derived from both wild-type and PEP−/− mice. Upon transfection of a plasmid containing multimerized NF-AT binding sites driving the expression of a luciferase gene, a strong decrease in both the basal and antigen induced activity of this transcription factor was noticed in the PEP−/− BMMC compared to PEP+/+ BMMC (Figure 6A). Treatment of the PEP+/+ BMMC with the LYP inhibitors showed a dose dependent down-regulation of both the basal and the antigen-mediated increase in luciferase activity (Figure 6A). The effect of 5 µM 8b was superior to the same concentration of C28 and a higher concentration (20 µM) of the former compound was even more efficacious. Concentrations over 5 µM C28 were not used in this study as they were found to be toxic to the cells. No significant effect of the LYP inhibitors was observed on the residual NF-AT activity that could be measured in the PEP−/− BMMC indicating that they both function by inhibiting the action of PEP. As calcium mobilization plays an essential proximal role in intracellular events leading to mast cell degranulation, studies on antigen-stimulated degranulation were carried out. BMMC from PEP−/− mice showed a reduced release of β-hexosaminidase compared to PEP+/+ BMMC (Figure 6B). As in the case of the analysis of NF-AT activity, both LYP inhibitors C28 and 8b down-regulated this response with the latter compound showing superiority over C28 in its action (Figure 6B). Neither compunds affected residual degranulation in the PEP−/− BMMC.
Figure 6.
Effects of compound 8b in mast cells. (A) Compound 8b decreases NF-AT luciferase activity in BMMC. 8×10⁶ cells PEP+/+ and PEP−/− BMMC were transfected with 4.5 µg 3xNF-AT-luciferase and 0.8 µg of Renilla luciferase expression. 24 h after transfection, the cells were sensitized with anti-DNP IgE for 18 h. Cells were treated with C28 (5 µM) or 8b (5 µM, 20 µM) for 1 h to the end of IgE incubation. Cells were then activated with DNP-HSA (200 ng/ml) for 8 h and firefly luciferase activity was measured and normalized to Renilla luciferase activity. Results are presented as the mean ± SEM (n=3). PEP+/+
 ; PEP−/−
 . Results in bar charts are presented as the mean ± SEM (***p≤0.0001, n=3) (B). Compound 8b reduces mast cell degranulation in BMMC. 5×10⁶ cells/ml BMMC from PEP+/+ and PEP−/− mice were sensitized with anti-DNP-IgE for 16 h and treated with C28 (5 µM), 8b (5 µM) or 8b (20 µM) for 1 h at the end of IgE incubation. These cells were then activated with DNP-HSA(200 ng/ml) for various time points. BMMC were pelleted and the amount of β-hexosaminidase in the supernatant and in the solubilized pellet were measured using p-nitrophenyl N-acetyl-β-D-glucosaminidine (p-NAG) as a substrate. Percent degranulation was calculated as follows: (released activity/total activity) ×100. The results are represented as the mean of ± SEM of 3 independent experiments (***p≤0.0005, n=3). PEP+/+
 ; PEP−/−
 ; C28 (5µM)
  ; 8b (5µM) ;
  8b (20µM)
  . The statistics were calculated using unpaired, 2-tailed, Student’s t-test.
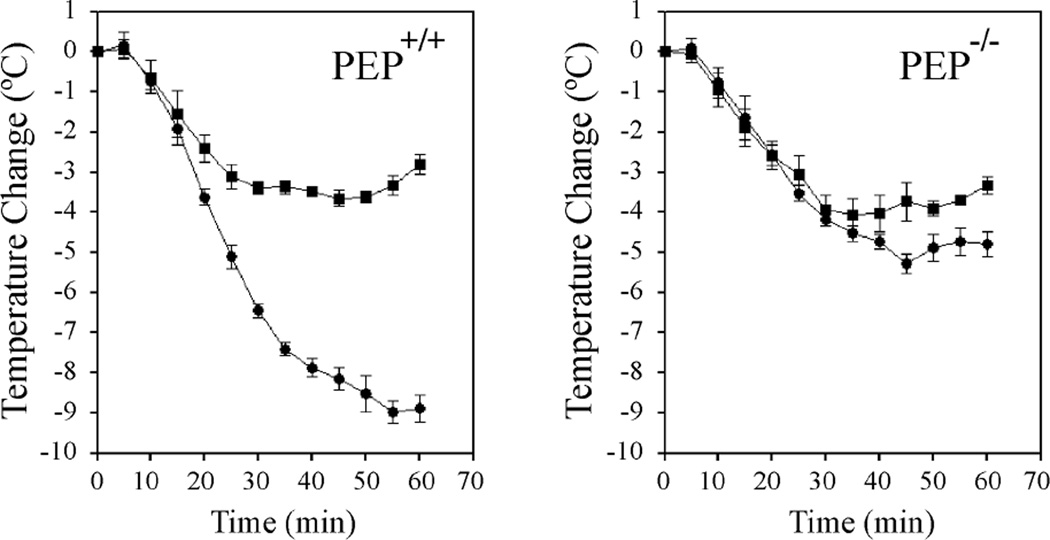
Antigen-induced degranulation of mast cells leads to exaggerated allergic reaction in the form of anaphylaxis.52 We have previously reported that PEP−/− mice are less susceptible to passive systemic anaphylaxis compared to PEP+/+ mice which was in agreement with degranulation results obtained with PEP+/+ and PEP−/− BMMC.51 We have also shown that compound C28 when given to mice in a final concentration of 5 µM mimicked the effect of the PEP knock-out. We therefore carried out passive systemic anaphylaxis (PSA) in both wild type and PEP knockout mice to determine whether compound 8b would also inhibit the anaphylaxis response (Figure 7). PEP+/+ mice treated with LYP inhibitor 8b were less susceptible to PSA compared to the untreated groups. These results confirm that compound 8b is a potent inhibitor of anaphylaxis and that its effect is mediated at least in part through the inhibition of the action of PEP. Together, the results show that 8b is capable of down-regulating calcium mediated transcription and degranulation in mast cells and inhibiting anaphylaxis in mice.
Figure 7.
Inhibition of anaphylaxis by compound 8b. PEP+/+ and PEP−/− mice were sensitized for 24 h with 1 mg/kg IgE and subsequently injected intra-peritoneal (IP) with either vehicle alone (PBS, 1 mg/kg) or 8b (20 µM) for 1 h to the end of the IgE incubation time. Anaphylaxis was induced with intra-venous injection of 200 µl DNP-HSA and the change in body temperatures measured every 5 min for 1h. Change in body temperature for PEP+/+ and PEP−/− mice are shown in (•) (PBS) and (v) (8b) respectively. Results are presented as the mean ± SEM. (n=5).
Discussion and Conclusions
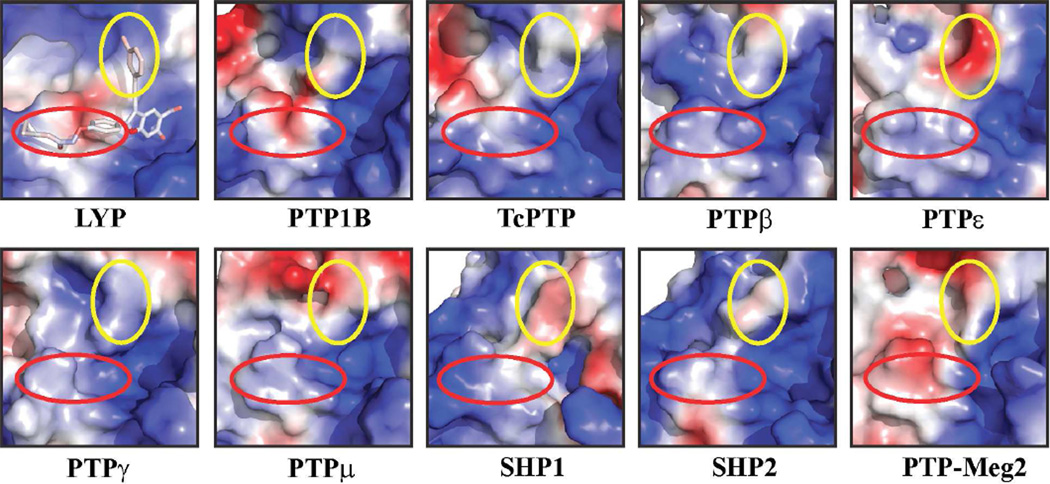
Because of its strong association with autoimmunity, LYP is an attractive target for potential pharmacological intervention in the treatment of a broad spectrum of autoimmune diseases. Unfortunately, there have been no reports of a truly potent and selective LYP inhibitor that can be used in preclinical and clinical investigation. This study illustrates a structure-based focused library approach to quickly produce the high-affinity and LYP-selective inhibitor 8b. Using the 6-hydroxy-benzofuran-5-carboxylic acid moiety to anchor the inhibitor to the LYP active site, the success of this approach relies on the introduction of secondary binding elements to enhance on-target potency and impart selectivity against the off-target phosphatases. Compound 8b exhibits greater than 9-fold selectivity over a large and diverse panel of PTPs (Table 5). Analysis of the LYP•8b structure indicates that the inhibitor interacts primarily with amino acid residues in the P-loop, the pTyr recognition loop, and the Q-loop. Although residues Phe28 and Lys32 are unique to LYP, many of the contact residues are conserved among all PTPs. How does 8b achieve its specificity for LYP? To address this question, we compared the structural features of the LYP active site and its surrounding pockets with 9 different PTPs. Figure 8 shows that these PTPs display significant differences in surface electrostatic potential and topology around the active site. Indeed, the corresponding binding sites for the 2-position substituted phenyl group and the 3-chlorophenyl ring in various PTPs are not exactly the same. Sequence comparison also reveals that residues within a 5 Å radius of 8b binding residues are highly variable (data not shown), which may account for the diverse surface properties in and around the PTP active site. These three dimensional structural differences in the binding sites likely dictate 8b binding specificity. Thus, the crystal structure of the LYP-inhibitor complex reveals that 8b not only interacts with LYP’s active site but also targets peripheral binding pockets in the vicinity of the active site that are unique to LYP, providing further support of the notion that it is possible to obtain inhibitor potency and selectivity across the conserved PTP family. Importantly, we demonstrate that LYP inhibitor 8b is highly efficacious in inhibiting LYP-mediated signaling in T cells, thymocytes, and bone marrow derived mast cells, as well as blocking systemic anaphylaxis in mice. Collectively, our results show that the 6-hydroxy-benzofuran-5-carboxylic acid pTyr mimetic can be converted into highly potent and selective PTP inhibitory agents with excellent in vivo efficacy. Compound 8b could serve as a starting point for the discovery of clinically useful LYP inhibitors as novel anti-autoimmune agents.
Figure 8.
Compound 8b binding site comparison between LYP and other PTPs. The PTP active sites and the peripheral pockets are depicted by electrostatic surface representation prepared by PyMol (The PyMOL Molecular Graphics System, Version 1.4.1 Schrödinger, LLC.). The binding site for the substituted phenyl group at the 2-position of benzofuran ring was marked by a red circle, and the binding site for the 3-chlorophenyl ring attached to the 3-ethynyl group in the benzofuran ring was marked by a yellow circle. Compound 8b is shown in stick model colored according to electrostatic properties of atoms.
Experimental Section
Materials
Polyethylene glycol (PEG3350) and buffers for crystallization were purchased from Hampton Research Co. p-Nitrophenyl phosphate (pNPP) was purchased from Fluka Co. Dithiothreitol (DTT) was provided by Fisher (Fair Lawn, NJ). The Ubi-Renilla-luciferase construct was generated by replacing the growth hormone cDNA in pUbiGH53 by Renilla reniformis luciferase cDNA (Promega). 3X NF-AT luciferase construct was generously provided by Laurie Glimcher, Boston. USA.
General procedures for chemistry
Melting points were measured in capillary tubes with Stuart SMP10 melting point apparatus and are uncorrected. 1H NMR spectra were obtained on a Bruker 500 MHz NMR instrument. The chemical shifts were reported as δ ppm relative to TMS, using the residual solvent peak as the reference unless otherwise noted. The following abbreviations were used to express the multiplicities: s = singlet; d = doublet; t = triplet; q = quartet; m = multiplet; br = broad. High-performance liquid chromatography (HPLC) purification was carried out on a Waters Delta 600 equipped with a Sunfire Prep C18 OBD column (30 × 150 mm, 5 mM) with methanol-water (both containing 0.1% TFA) as the mobile phase (gradient: 30–100% methanol, flow 10 mL/min). Purity analyses were performed on an Agilent Technology 1200 Series consisting of a G1379B degasser, a G1312A Binary Pump, a G1367A wellplate autosampler, a G1314B variable wavelength detector and a G6130A Quadrupole mass spectrometer. The column used was a Kinetex XB-C18, 2.6 µm, 50 × 4.6 mm, run at a flow rate of 0.7 mL/min. A linear gradient was used for both the blank and the sample from 5% to 100% MeOH/water (0.1% TFA). The blank run was subtracted from the sample run. All the final compounds were obtained in a highly pure form (>95%). Resolution mass spectra were obtained on an Agilent Technologies 6130 Quadrupole LC/MS. Accurate mass spectrometric analysis was performed on an Agilent Technologies 6250 TOF spectrometer. All reactions were monitored by thin layer chromatography (TLC) carried out on Dynamic Adsorbents silica gel plates (0.25 mm thick, 60F254), visualized by using UV (254 nm). All compounds used for biological assays were purified by HPLC and are at least of 95% purity based on HPLC analytical results monitored with 254 nm wavelengths. All reagents and solvents were purchased from commercially available sources (FisherSci, Aldrich, Acros, Alfa Aesar, TCI).
Synthesis of compounds 3a–e
The structures of compounds 3a–e are listed in Table 1, and their syntheses from compound 12 are shown in Schemes 1. Compound 12 was obtained following an established procedure.39 13a–e, which were prepared by Sonogashira coupling of compound 12 and an appropriate alkyn, were subjected to cyclization with I2 to yield benzofuran 14a–e. Then, coupling of 14a–e with trimethylsilylacetylene provided the desired compounds 3a–e with additional deprotection.
General procedures for the preparation of 13a–e
Under a nitrogen atmosphere, a Schlenk reaction tube was charged with the appropriate alkyne substrate (2.4 mmol), compound 8 (2 mmol), Et3N (8 mmol), Pd(PPh3)2Cl2 (0.06 mmol), CuI (0.12 mmol) and DMF (5mL). After the mixture was stirred at room temperature for 12 h, water was added. The aqueous phase was then extracted 3 times with ethyl acetate. The organic phase was washed with brine, dried over Na2SO4, filtered and concentrated. The crude residues were purified by flash column chromatography on silica gel to give the products 13a–e.
7-Methoxy-2,2-dimethyl-6-(naphthalen-1-ylethynyl)-4H-benzo[d][1,3]dioxin-4-one (13a)
Pale yellow solid: mp 143–145 °C. 1H NMR (500 MHz, CDCl3) δ 8.50 (d, J = 8.2 Hz, 1H), 8.20 (s, 1H), 7.85 (dd, J = 11.4, 7.1 Hz, 2H), 7.76 (dd, J = 7.1, 1.0 Hz, 1H), 7.61 (m, 1H), 7.54 (m, 1H), 7.46 (dd, J = 8.2, 7.2 Hz, 1H), 6.49 (s, 1H), 3.97 (s, 3H), 1.75 (s, 6H). 13C NMR (125M, CDCl3) δ 166.11, 160.20, 157.88, 134.55, 133.27, 133.17, 130.21, 128.80, 128.23, 126.81, 126.41, 126.32, 125.23, 120.81, 108.70, 106.73, 99.05, 91.69, 88.71, 56.50, 25.85. Mass spectra (ESI): m/e 359 (M + H)+. HRMS (ESI) calcd for C23H19O4+ [(M + H)+], 359.1278; found, 359.1268.
6-([1,1'-Biphenyl]-4-ylethynyl)-7-methoxy-2,2-dimethyl-4H-benzo[d][1,3]dioxin-4-one (13b)
Orange solid: mp 175–176 °C. 1H NMR (500 MHz, CDCl3) δ 8.11 (s, 1H), 7.61 (br, 6H), 7.36 (m, 1H), 6.45 (s, 1H), 3.95 (s, 3H), 1.75 (s, 6H). 13C NMR (125M, CDCl3) δ 165.98, 160.14, 157.83, 141.03, 140.33, 135.21, 134.78, 132.95, 132.05, 128.91, 127.87, 127.64, 126.98, 108.50, 106.72, 99.01, 93.28, 84.42, 56.46, 25.86. Mass spectra (ESI): m/e 385 (M + H)+. HRMS (ESI) calcd for C25H21O4+ [(M + H)+], 385.1434; found, 359.1441.
6-((3-Chlorophenyl)ethynyl)-7-methoxy-2,2-dimethyl-4H-benzo[d][1,3]dioxin-4-one (13c)
Yellow solid: mp 138–139. 1H NMR (500 MHz, CDCl3) δ 8.08 (s, 1H), 7.52 (t, J = 1.4 Hz, 1H), 7.40 (m, 1H), 7.29 (m, 2H), 6.45 (s, 1H), 3.95 (s, 3H), 1.75 (s, 6H). 13C NMR (125M, CDCl3) δ 166.18, 160.15, 158.19, 135.01, 134.25, 131.53, 129.86, 129.67, 128.67, 125.00, 108.05, 106.88, 106.13, 99.18, 91.93, 85.10, 56.60, 25.98. Mass spectra (ESI): m/e 343 (M + H)+. HRMS (ESI) calcd for C19H16ClO4+ [(M + H)+], 343.0732; found, 343.0730.
7-Methoxy-2,2-dimethyl-6-((4-(trifluoromethoxy)phenyl)ethynyl)-4H-benzo[d][1,3]dioxin-4-one (13d)
Pale yellow solid: mp 128–130 °C. 1H NMR (500 MHz, CDCl3) δ 8.09 (s, 1H), 7.55 (dt, J = 8.6, 2.0 Hz, 2H), 7.19 (d, J = 8.6 Hz, 2H), 6.45 (s, 1H), 3.95 (s, 3H), 1.75 (s, 6H). 13C NMR (125M, CDCl3) δ 166.15, 160.21, 158.16, 149.06, 135.02, 133.26, 122.10, 120.99, 108.16, 106.91, 106.16, 99.19, 91.94, 84.73, 56.61, 25.99. Mass spectra (ESI): m/e 393 (M + H)+. HRMS (ESI) calcd for C20H16F3O5+ [(M + H)+], 393.0944; found, 393.0938.
7-Methoxy-2,2-dimethyl-6-((4-phenoxyphenyl)ethynyl)-4H-benzo[d][1,3]dioxin-4-one (13e)
White solid: mp 138–140 °C. 1H NMR (500 MHz, CDCl3) δ 8.07 (s, 1H), 7.49 (dt, J = 8.8, 2.0 Hz, 2H), 7.36 (m, 2H), 7.14 (tt, J = 7.4, 1.0 Hz, 1H), 7.04 (m, 2H), 6.96 (dt, J = 8.8, 2.0 Hz, 2H), 6.44 (s, 1H), 3.94 (s, 3H), 1.75 (s, 6H). Mass spectra (ESI): m/e 401 (M + H)+. HRMS (ESI) calcd for C25H21O5+ [(M + H)+], 401.1384; found, 401.1394.
General procedures for the preparation of 15a–e
Compounds 15a–e were synthesized in two steps from compounds 13a–e. Compounds 14a–e were prepared from compounds 13a–e using procedures similar to those described in the literature.39 To a solution of compounds 13a–e in acetonitrile, two equivalents of iodine and NaHCO3 were added. After stirring at 70 °C for 12 h, one additional equivalent of iodine and NaHCO3 were added and the resulting mixtures were heated for another 12 h. Then the solvent was removed and ethyl acetate was added. The organic phase was washed with saturated aqueous Na2SO3, H2O, and saturated aqueous NaCl, and dried over Na2SO4. Solvent was removed by evaporation to leave the iodide as yellow solids which were used in the next step without further purification. The crude iodide 14a–e were reacted with trimethylsilylacetylene in the presence of catalytic amounts of Pd(PPh3)2Cl2 and CuI to give compounds 15a–e.
2,2-Dimethyl-7-(naphthalen-1-yl)-6-((trimethylsilyl)ethynyl)-4H-[1,3]dioxino[5,4-f]benzofuran-4-one (15a)
White solid: mp 181–182 °C. 1H NMR (500 MHz, CDCl3) δ 8.41 (s, 1H), 8.26 (m, 1H), 8.05 (d, J = 7.0 Hz, 1H), 7.98 (d, J = 8.2 Hz, 1H), 7.92 (m, 1H), 7.57 (m, 3H), 7.14 (s, 1H), 1.77 (s, 6H), 0.18 (s, 9H). Mass spectra (ESI): m/e 441 (M + H)+. HRMS (ESI) calcd for C27H25O4Si+ [(M + H)+], 441.1517; found, 441.1516.
7-([1,1'-Biphenyl]-4-yl)-2,2-dimethyl-6-((trimethylsilyl)-4H-[1,3]dioxino[5,4-f]benzofuran-4-one (15b)
Pale yellow solid: mp 185–186 °C. 1H NMR (500 MHz, CDCl3) δ 8.34 (s, 1H), 8.32 (s, 2H), 7.70 (m, 2H), 7.66 (m, 2H), 7.47 (t, J = 7.9 Hz, 2H), 7.40 (m, 1H), 7.06 (s, 1H), 1.76 (s, 6H), 0.36 (s, 9H). 13C NMR (125M, CDCl3) δ 161.51, 158.35, 157.71, 154.59, 142.43, 140.27, 129.05, 128.27, 127.99, 127.37, 127.18, 126.44, 126.01, 122.55, 110.67, 106.63, 104.77, 99.97, 99.48, 95.50, 25.98, 0.13. Mass spectra (ESI): m/e 467 (M + H)+. HRMS (ESI) calcd for C29H27O4Si+ [(M + H)+], 467.1673; found, 467.1679.
7-(3-Chlorophenyl)-2,2-dimethyl-6-((trimethylsilyl)ethynyl)-4H-[1,3]dioxino[5,4-f]benzofuran-4-one(15c)
White solid: mp 208–209 °C. 1H NMR (500 MHz, CDCl3) δ 8.36 (t, J = 1.7 Hz, 1H), 8.08 (dt, J = 7.5, 1.6 Hz, 1H), 7.39 (m, 2H), 7.07 (s, 1H), 1.77 (s, 6H), 0.35 (s, 9H). Mass spectra (ESI): m/e 425 (M + H)+. HRMS (ESI) calcd for C23H22ClO4Si+ [(M + H)+], 425.0970; found, 425.0975.
2,2-Dimethyl-7-(4-(trifluoromethoxy)phenyl)-6-((trimethylsilyl)ethynyl)-4H-[1,3]dioxino[5,4-f]benzofuran-4-one (15d)
Pale yellow solid: mp 146–148 °C. 1H NMR (500 MHz, CDCl3) δ 8.32 (s, 1H), 8.29 (m, 2H), 7.31 (d, J = 8.1 Hz, 2H), 7.06 (s, 1H), 1.77 (s, 6H), 0.35 (s, 9H). 13C NMR (125M, CDCl3) δ 161.38, 157.64, 156.96, 154.76, 149.91, 149.90, 128.02, 127.53, 125.71, 122.79, 121.08, 120.55 (q, JCF = 256.5 Hz), 110.86, 106.67, 105.17, 100.09, 95.00, 25.97, 0.03. Mass spectra (ESI): m/e 475 (M + H)+. HRMS (ESI) calcd for C24H22F3O5Si+ [(M + H)+], 475.1183; found, 475.1187.
2,2-Dimethyl-7-(4-phenoxyphenyl)-6-((trimethylsilyl)ethynyl)-4H-[1,3]dioxino[5,4-f]benzofuran-4-one (15e)
Off-white solid: mp 175–177 °C. 1H NMR (500 MHz, CDCl3) δ 8.30 (s, 1H), 8.23 (m, 2H), 7.71 (m, 1H), 7.53 (m, 1H), 7.39 (m, 2H), 7.18 (m, 1H), 7.09 (m, 5H), 7.05 (s, 1H), 1.76 (s, 6H), 0.35 (s, 9H). Mass spectra (ESI): m/e 483 (M + H)+. HRMS (ESI) calcd for C29H27O5Si+ [(M + H)+], 483.1622; found, 483.1600.
General procedures for the preparation of 3a–e
To a solution of 15a–e (0.2 mmol) in THF (2 mL), KOH (0.8 mmol) was added. The obtained mixtures were refluxed for 2 hours, then acidified with 3 M HCl and extracted with ethyl acetate. The organic layers were dried over anhydrous Na2SO4, filtered, and concentrated under reduced pressure. The residues were purified by HPLC to furnish the corresponding products 3a–e.
3-Ethynyl-6-hydroxy-2-(naphthalen-1-yl)benzofuran-5-carboxylic Acid (3a)
Pale yellow solid: mp 213 °C (decomposition). 1H NMR (500 MHz, DMSO-d6) δ 8.15 (m, 2H), 8.13 (s, 1H), 7.99 (d, J = 6.9 Hz, 1H), 7.70 (t, J = 7.7 Hz, 1H), 7.65 (m, 2H), 7.34 (s, 1H), 4.56 (s, 1H). 13C NMR (125M, DMSO-d6) δ 171.95, 160.40, 158.46, 157.48, 133.36, 130.86, 130.00, 128.87, 128.61, 127.24, 126.56, 125.56, 125.39, 125.29, 121.75, 121.02, 110.15, 99.41, 87.84, 73.69. Mass spectra (ESI): m/e 329 (M + H)+. HRMS (ESI) calcd for C21H11O4− [(M - H)−], 327.0663; found, 327.0659.
2-([1,1'-Biphenyl]-4-yl)-3-ethynyl-6-hydroxybenzofuran-5-carboxylic Acid (3b)
Yellow solid: mp 190 °C (decomposition). 1H NMR (500 MHz, DMSO-d6) δ 8.25 (d, J = 8.5 Hz, 2H), 8.04 (s, 1H), 7.90 (d, J = 8.5 Hz, 2H), 7.77 (d, J = 7.5 Hz, 2H), 7.51 (t, J = 7.5 Hz, 2H), 7.42 (t, J = 7.5 Hz, 1H), 7.27 (s, 1H), 4.98 (s, 1H). 13C NMR (125M, DMSO-d6) δ 171.88, 160.56, 156.87, 156.47, 141.19, 138.95, 129.05, 128.05, 127.52, 127.24, 126.66, 125.69, 121.75, 121.57, 110.60, 99.49, 99.21, 97.69, 90.00, 74.28. Mass spectra (ESI): m/e 355 (M + H)+. HRMS (ESI) calcd for C23H13O4− [(M - H)−], 353.0819; found, 353.0811.
2-(3-Chlorophenyl)-3-ethynyl-6-hydroxybenzofuran-5-carboxylic Acid (3c)
Pale yellow solid: mp 207 °C (decomposition). 1H NMR (500 MHz, DMSO-d6) δ 8.05 (m, 2H), 7.95 (s, 1H), 7.55 (t, J = 7.9 Hz, 1H), 7.50 (m, 1H), 7.16 (s, 1H), 4.97 (s, 1H). 13C NMR (125M, DMSO-d6) δ 171.81, 160.75, 156.77, 154.72, 133.77, 130.98, 130.38, 129.40, 124.37, 123.53, 121.85, 121.37, 110.75, 99.14, 98.86, 90.50, 73.81. Mass spectra (ESI): m/e 313 (M + H)+. HRMS (ESI) calcd for C17H8ClO4− [(M - H)−], 311.0117; found, 311.0113.
3-Ethynyl-6-hydroxy-2-(4-(trifluoromethoxy)phenyl)benzofuran-5-carboxylic Acid (3d)
Pale yellow solid: mp 185 °C (decomposition). 1H NMR (500 MHz, DMSO-d6) δ 8.17 (d, J = 8.1 Hz, 2H), 7.95 (s, 1H), 7.50 (d, J = 8.1 Hz, 2H), 7.50 (d, J = 8.1 Hz, 2H), 7.15 (s, 1H), 4.91 (s, 1H). 13C NMR (125M, DMSO-d6) δ 160.72, 156.78, 155.12, 148.73, 127.65, 127.05, 121.77, 121.42, 119.99 (q, JCF = 255.6 Hz), 99.09, 98.41, 89.99, 73.85. Mass spectra (ESI): m/e 363 (M + H)+. HRMS (ESI) calcd for C18H8F3O5− [(M - H)−], 361.0329; found, 361.0333.
3-Ethynyl-6-hydroxy-2-(4-phenoxyphenyl)benzofuran-5-carboxylic Acid (3e)
Pale yellow solid: mp 182 °C (decomposition). 1H NMR (500 MHz, DMSO-d6) δ 8.14 (d, J = 8.8 Hz, 2H), 7.98 (s, 1H), 7.45 (t, J = 7.9 Hz, 2H), 7.22 (m, 2H), 7.13 (m, 4H), 4.86 (s, 1H). 13C NMR (125M, DMSO-d6) δ 171.87, 160.42, 158.17, 156.70, 156.49, 155.53, 130.23, 127.23, 124.30, 123.50, 121.72, 121.36, 119.47, 118.37, 99.49, 99.10, 96.63, 89.38, 74.27. Mass spectra (ESI): m/e 371 (M + H)+. HRMS (ESI) calcd for C23H13O5− [(M - H)−], 369.0768; found, 369.0771.
Synthesis of compounds 4a–i
3-substituented analogues 4a–i, listed in Table 2, were synthesized according to established procedures,39 shown in Scheme 2.
Synthesis of compounds 5a–d
The structures of compounds 5a–d are listed in Table 3, and their syntheses from compound 14d are shown in Schemes 3.
General procedures for the preparation of 19a–d
Under a nitrogen atmosphere, a Schlenk reaction tube was charged with appropriate alkyne substrate (2.4 mmol), compound 14d (2 mmol), Et3N (8 mmol), Pd(PPh3)2Cl2 (0.06 mmol), CuI (0.12 mmol) and DMF (5mL). After the mixture was heated (45 °C) overnight, water was added. The aqueous phase was then extracted 3 times with ethyl acetate. The organic phase was washed with brine, dried over Na2SO4, filtered and concentrated. The crude residues were purified by flash column chromatography on silica gel to give the products 19a–d.
6-((3-Chlorophenyl)ethynyl)-2,2-dimethyl-7-(4-(trifluoromethoxy)phenyl)-4H-[1,3]dioxino[5,4-f]benzofuran-4-one (19a)
White solid: mp 138–140 °C. 1H NMR (500MHz, CDCl3) δ 8.36 (s, 1H), 8.28 (m, 2H), 7.59 (t, J = 1.7 Hz, 1H), 7.49 (dt, J = 7.3, 1.4 Hz, 1H), 7.37 (m, 4H), 7.10 (s, 1H), 1.75 (s, 6H). 13C NMR (125M, CDCl3) δ 161.20, 157.69, 156.31, 154.74, 149.89, 134.51, 131.38, 129.86, 129.79, 129.29, 127.81, 127.47, 125.52, 124.16, 122.53, 121.17, 120.43 (q, JCF = 256.8 Hz), 110.84, 106.64, 100.04, 99.99, 96.67, 80.57, 25.88. Mass spectra (ESI): m/e 513 (M + H)+. HRMS (ESI) calcd for C27H17ClF3O5+ [(M + H)+], 513.0711; found, 513.0708.
6-((3,4-Dichlorophenyl)ethynyl)-2,2-dimethyl-7-(4-(trifluoromethoxy)phenyl)-4H-[1,3]dioxino[5,4-f]benzofuran-4-one (19b)
Off-white solid: mp 158–160 °C. 1H NMR (500MHz, CDCl3) δ 8.34 (s, 1H), 8.26 (m, 2H), 7.68 (d, J = 1.9 Hz, 1H), 7.49 (d, J = 8.3 Hz, 1H), 7.42 (dd, J = 8.3, 1.9 Hz, 1H), 7.36 (d, J = 8.3 Hz, 2H), 7.10 (s, 1H), 1.77 (s, 6H). 13C NMR (125M, CDCl3) δ 161.18, 151.68, 156.47, 154.78, 149.97, 149.96, 133.54, 133.08, 132.97, 130.71, 13069, 127.71, 127.48, 125.39, 122.47, 122.38, 121.18, 120.43 (q, JCF = 256.3 Hz), 110.88, 106.67, 100.09, 100.00, 99.28, 95.70, 81.40, 25.88. Mass spectra (ESI): m/e 547 (M + H)+. HRMS (ESI) calcd for C27H16Cl2F3O5+ [(M + H)+], 547.0321; found, 513.0333.
2,2-Dimethyl-6-(thiophen-3-ylethynyl)-7-(4-(trifluoromethoxy)phenyl)-4H-[1,3]dioxino[5,4-f]benzofuran-4-one (19c)
Off-white solid: mp 160–162 °C. 1H NMR (500MHz, CDCl3) δ 8.37 (s, 1H), 8.29 (m, 2H), 7.64 (dd, J = 3.0, 1.2 Hz, 1H), 7.38 (dd, J = 5.0, 3.0 Hz, 1H), 7.33 (m, 2H), 7.28 (dd, J = 5.0, 1.2 Hz, 1H), 7.08 (s, 1H), 1.77 (s, 6H). 13C NMR (125M, CDCl3) δ 161.41, 157.80, 155.94, 154.78, 149.84, 149.83, 129.85, 129.71, 128.07, 127.45, 126.03, 125.82, 122.73, 121.66, 121.22, 120.55 (q, JCF = 256.44 Hz), 110.83, 106.72, 100.08, 100.05, 93.57, 25.99. Mass spectra (ESI): m/e 585 (M + H)+. HRMS (ESI) calcd for C25H16F3O5S+ [(M + H)+], 485.0665; found, 485.0666.
Methyl 2-(3-((2,2-dimethyl-4-oxo-7-(4-(trifluoromethoxy)phenyl)-4H-[1,3]dioxino[5,4-f]benzofuran-6-yl)ethynyl)phenoxy)acetate (19d)
Off-White solid: mp 118–119 °C. 1H NMR (500MHz, CDCl3) δ 8.37 (s, 1H), 8.30 (m, 2H), 7.35 (m, 3H), 7.27 (m, 1H), 7.14 (m, 1H), 7.09 (s, 1H), 6.99 (dd, J = 8.4, 2.7 Hz, 1H), 4.71 (s, 2H), 3.85 (s, 3H), 1.78 (s, 6H). 13C NMR (125M, CDCl3) δ 169.22, 161.39, 157.85, 157.83, 156.26, 154.81, 130.01, 128.02, 127.55, 125.73, 125.46, 123.85, 122.71, 121.26, 120.55 (q, JCF = 256.44 Hz), 117.46, 116.15, 110.88, 106.74, 100.13, 99.91, 97.90, 79.69, 65.48, 52.51, 25.99. Mass spectra (ESI): m/e 567 (M + H)+. HRMS (ESI) calcd for C30H22F3O8+ [(M + H)+], 567.1261; found, 567.1241.
General procedure for the preparation of 5a–d
To a solution of 19a–d (0.2 mmol) in MeOH (2 mL), KOH (0.8 mmol) was added. The obtained mixtures were refluxed for 2 hours, then acidified with 3 M HCl and extracted with ethyl acetate. The organic layers were dried over anhydrous Na2SO4, filtered, and concentrated under reduced pressure. The residues were purified by HPLC to furnish the corresponding products 5a–d.
3-((3-Chlorophenyl)ethynyl)-6-hydroxy-2-(4-(trifluoromethoxy)phenyl)benzofuran-5-carboxylic Acid (5a)
Off-white solid: mp 196 °C (decomposition). 1H NMR (500MHz, DMSO-d6) δ 8.23 (d, J = 8.8 Hz, 2H), 8.09 (s, 1H), 7.78 (br, 1H), 7.66 (d, J = 7.6 Hz, 1H), 7.56 (m, 3H), 7.50 (t, J = 7.8 Hz, 1H), 7.19 (s, 1H). 13C NMR (125M, DMSO-d6) δ 171.83, 160.70, 156.87, 154.75, 148.72, 133.38, 130.73, 130.57, 130.25, 129.29, 127.61, 127.18, 123.60, 122.06, 121.49, 120.95, 119.94 (q, JCF = 252.9 Hz), 110.77, 99.45, 99.06, 98.63, 96.05, 80.67. Mass spectra (ESI): m/e 473 (M + H)+. HRMS (ESI) calcd for C24H11ClF3O5− [(M - H)−], 471.0253; found, 471.0247.
3-((3,4-Dichlorophenyl)ethynyl)-6-hydroxy-2-(4-(trifluoromethoxy)phenyl)benzofuran-5-carboxylic Acid (5b)
Off-white solid: mp 213 °C (decomposition). 1H NMR (500MHz, DMSO-d6) δ 8.33 (d, J = 8.7 Hz, 2H), 8.20 (s, 1H), 8.01 (s, 1H), 7.72 (br, 2H), 7.59 (d, J = 8.7 Hz, 2H), 7.20 (s, 1H). 13C NMR (125M, DMSO-d6) δ 172.48, 161.49, 157.52, 155.28, 149.38, 133.25, 132.25, 132.66, 132.15, 131.95, 131.27, 128.18, 127.71, 122.84, 122.65, 121.86, 120.49 (q, JCF = 255.21 Hz), 99.99, 99.34, 99.07, 95.89, 81.97. Mass spectra (ESI): m/e 507 (M + H)+. HRMS (ESI) calcd for C24H10Cl2F3O5− [(M - H)−], 504.9863; found, 504.9876.
6-Hydroxy-3-(thiophen-3-ylethynyl)-2-(4-(trifluoromethoxy)phenyl)benzofuran-5-carboxylic Acid (5c)
Off-white solid: mp 206 °C (decomposition). 1H NMR (500MHz, DMSO-d6) δ 8.26 (m, 2H), 8.12 (m, 1H), 8.07 (s, 1H), 7.73 (dd, J = 5.0, 3.0 Hz, 1H), 7.57 (d, J = 8.4 Hz, 2H), 7.44 (dd, J = 5.0, 1.0 Hz, 1H), 7.22 (s, 1H). 13C NMR (125M, DMSO-d6) δ 171.86, 160.65, 156.93, 154.27, 148.62, 130.93, 129.66, 127.80, 127.12, 126.99, 121.97, 121.49, 121.15, 120.57, 119.97 (q, JCF = 255.6 Hz), 110.60, 99.11, 93.28, 78.69. Mass spectra (ESI): m/e 445 (M + H)+. HRMS (ESI) calcd for C22H10Cl2F3O5S− [(M - H)−], 443.0207; found, 443.0227.
3-((3-(Carboxymethoxy)phenyl)ethynyl)-6-hydroxy-2-(4-(trifluoromethoxy)phenyl)benzofuran-5-carboxylic Acid (5d)
Off-white solid: mp 190 °C (decomposition). 1H NMR (500MHz, DMSO-d6) δ 13.10 (br, 1H), 8.26 (m, 2H), 8.11 (s, 1H), 7.59 (d, J = 8.5 Hz, 2H), 7.41 (t, J = 7.8 Hz, 1H), 7.31 (d, J = 7.8 Hz, 1H), 7.25 (m, 1H), 7.23 (s, 1H), 7.07 (dd, J = 8.5 Hz, 2.4 Hz, 1H), 4.80 (s, 2H). Mass spectra (ESI): m/e 513 (M + H)+. HRMS (ESI) calcd for C26H14F3O8− [(M - H)−], 511.0646; found, 511.0643.
Synthesis of compounds 6a and 6b
The structures and synthesis of compounds 6a and 6b are shown in Scheme 4.
Methyl 2-(3-ethynylphenoxy)acetate (23) and methyl 2-(4-ethynylphenoxy)acetate (27)
Compounds 23 and 27 were synthesized from compounds 21 and 25 via Sonogashira coupling.54 Compounds 21 and 25 were reacted with trimethylsilylacetylene in the presence of catalytic amounts of Pd(PPh3)2Cl2 and CuI to give compounds 22 and 26, which were treated with TBAF to furnish compounds 23 and 27. Compound 23: White solid: mp 50–51 °C. 1H NMR (500MHz, CDCl3) δ 7.23 (m, 1H), 7.13 (d, J = 7.6 Hz, 1H), 7.01 (s, 1H), 6.92 (m, 1H), 4.62 (s, 2H), 3.80 (s, 3H), 3.08 (s, 1H). 13C NMR (125M, CDCl3) δ 169.09, 157.49, 129.60, 125.76, 123.33, 117.81, 115.93, 83.22, 77.46, 65.23, 52.32. HRMS (ESI) calcd for C10H11O3+ [(M + H)+], 191.0703; found, 191.0716. Compound 27: White solid: mp 82–83 °C. 1H NMR (500MHz, CDCl3) δ 7.42 (dt, J = 8.9, 2.1 Hz, 2H), 6.84 (dt, J = 8.9, 2.1 Hz, 2H), 4.62 (s, 2H), 3.78 (s, 3H), 3.02 (s, 1H). 13C NMR (125M, CDCl3) δ 169.00, 158.04, 133.70, 115.43, 114.62, 83.32, 76.36, 65.14, 52.34. HRMS (ESI) calcd for C10H11O3+ [(M + H)+], 191.0703; found, 191.0711.
Methyl 2-(3-((7-methoxy-2,2-dimethyl-4-oxo-4H-benzo[d][1,3]dioxin-6-yl)ethynyl)phenoxy)acetate (28)
Under a nitrogen atmosphere, a Schlenk reaction tube was charged with compound 23 (12 mmol), compound 12 (10 mmol), Et3N (40 mmol), Pd(PPh3)2Cl2 (0.3 mmol), CuI (0.6 mmol) and DMF (50 mL). After the mixture was stirred at room temperature overnight, water was added. The aqueous phase was then extracted 3 times with ethyl acetate. The organic phase was washed with brine, dried over Na2SO4, filtered and concentrated. The crude residues were purified by flash column chromatography on silica gel to give the products 28. Yellow solid: mp 44–46 °C. 1H NMR (500MHz, CDCl3) δ 8.07 (s, 1H), 7.27 (m, 1H), 7.17 (m, 1H), 7.05 (m, 1H), 6.91 (m, 1H), 6.45 (s, 1H), 4.67 (s, 2H), 3.94 (s, 3H), 3.82 (s, 3H), 1.74 (s, 6H). 13C NMR (125M, CDCl3) δ 169.19, 166.07, 160.19, 157.96, 157.56, 134.80, 129.61, 125.34, 124.38, 117.18, 115.58, 108.23, 106.79, 105.95, 99.10, 92.92, 93.98, 65.28, 56.52, 52.35, 25.86. Mass spectra (ESI): m/e 397 (M + H)+. HRMS (ESI) calcd for C22H21O7+ [(M + H)+], 397.1282; found, 397.1277.
Methyl 2-(3-(6-iodo-2,2-dimethyl-4-oxo-4H-[1,3]dioxino[5,4-f]benzofuran-7-yl)phenoxy)acetate (29)
To a solution of compound 28 (5 mmol) in acetonitrile were added iodine (10 mmol) and NaHCO3 (10 mmol). After stirring at 70 °C for 12 h, additional 5 mmol iodine and 5 mmol NaHCO3 were added and the resulting mixture was heated for another 12 h. Then the solvent was removed and ethyl acetate was added. The organic phase was washed with saturated aqueous Na2SO3, H2O, and saturated aqueous NaCl, and dried over Na2SO4. The crude residues were purified by flash column chromatography on silica gel to give the product 29. Pale yellow solid: mp 206–207 °C. 1H NMR (500MHz, CDCl3) δ 8.12 (s, 1H), 7.80 (d, J = 8.0 Hz, 1H), 7.70 (t, J = 2.0 Hz, 1H), 7.43 (t, J = 8.0 Hz, 1H), 7.08 (s, 1H), 7.02 (dd, J = 8.0, 2.5 Hz, 1H), 4.74 (s, 2H), 3.84 (s, 3H), 1.77 (s, 6H). 13C NMR (125M, CDCl3) δ 169.11, 161.18, 157.98, 157.83, 154.85, 153.84, 130.49, 129.96, 128.78, 124.08, 120.83, 116.32, 113.38, 110.75, 106.59, 99.81, 65.40, 61.10, 52.40, 25.86. Mass spectra (ESI): m/e 509 (M + H)+. HRMS (ESI) calcd for C21H18IO7+ [(M + H)+], 509.0092; found, 509.0084.
Methyl 2-(3-(6-((3-chlorophenyl)ethynyl)-2,2-dimethyl-4-oxo-4H-[1,3]dioxino[5,4-f]benzofuran-7-yl)phenoxy)acetate (30)
Under a nitrogen atmosphere, a Schlenk reaction tube was charged with 1-chloro-3-ethynylbenzene (8.4 mmol), compound 29 (7 mmol), Et3N (28 mmol), Pd(PPh3)2Cl2 (0.21 mmol), CuI (0.42 mmol) and DMF (30 mL). After the mixture was stirred at room temperature overnight, water was added. The aqueous phase was then extracted 3 times with ethyl acetate. The organic phase was washed with brine, dried over Na2SO4, filtered and concentrated. The crude residues were purified by flash column chromatography on silica gel to give the product 30. Off-white solid: mp 164 °C (decomposition). 1H NMR (500MHz, CDCl3) δ 8.33 (s, 1H), 7.82 (m, 1H), 7.60 (m, 1H), 7.51 (dt, J = 7.3, 1.5 Hz, 1H), 7.43 (t, J = 8.05 Hz, 1H), 7.37 (m, 2H), 7.08 (s, 1H), 7.00 (m, 1H), 4.72 (s, 1H), 3.80 (s, 3H), 1.77 (s, 6H). 13C NMR (125M, CDCl3) δ 169.17, 161.43, 158.17, 157.78, 154.77, 134.58, 131.47, 130.66, 130.29, 129.96, 129.94, 125.77, 124.46, 122.55, 119.65, 116.54, 111.98, 110.84, 106.74, 100.15, 100.12, 99.49, 96.83, 81.08, 65.45, 52.54, 26.01. Mass spectra (ESI): m/e 517 (M + H)+. HRMS (ESI) calcd for C29H22ClO7+ [(M + H)+], 517.1049; found, 517.1040.
2-(3-(Carboxymethoxy)phenyl)-3-((3-chlorophenyl)ethynyl)-6-hydroxybenzofuran-5-carboxylic Acid (6a)
To a solution of 30 (0.2 mmol) in THF (2 mL), KOH (0.8 mmol) was added. The obtained mixture was refluxed 2 hours, then acidified with 3 M HCl and extracted with ethyl acetate. The organic layers were dried over anhydrous Na2SO4, filtered, and concentrated under reduced pressure. The residue was purified by HPLC to furnish the corresponding product 6a. Pale yellow solid: mp 162 °C (decomposition). 1H NMR (500 MHz, DMSO-d6) δ 11.7 (br, 1H), 8.10 (s, 1H), 7.77 (m, 2H), 7.67 (m, 1H), 7.64 (d, J = 7.6 Hz, 1H), 7.53 (t, J = 7.6 Hz, 1H), 7.49 (m, 2H), 7.22 (s, 1H), 7.05 (dd, J = 8.3, 2.3 Hz, 1H), 4.77 (s, 2H). 13C NMR (125M, DMSO-d6) δ 172.43, 170.41, 161.11, 158.51, 157.37, 156.50, 133.96, 131.22, 131.16, 130.91, 130.63, 130.23, 129.78, 124.25, 122.49, 121.64, 118.74, 116.59, 111.64, 111.13, 99.64, 98.75, 96.55, 81.61, 65.03. Mass spectra (ESI): m/e 463 (M + H)+. HRMS (ESI) calcd for C25H14ClO7− [(M - H)−], 461.0434; found, 461.0427.
Methyl 2-(4-((7-methoxy-2,2-dimethyl-4-oxo-4H-benzo[d][1,3]dioxin-6-yl)ethynyl)phenoxy)acetate (31)
Under a nitrogen atmosphere, a Schlenk reaction tube was charged with 27 (12 mmol), compound 12 (10 mmol), Et3N (40 mmol), Pd(PPh3)2Cl2 (0.3 mmol), CuI (0.6 mmol) and DMF (50 mL). After the mixture was stirred at room temperature overnight, water was added. The aqueous phase was then extracted three times with ethyl acetate. The organic phase was washed with brine, dried over Na2SO4, filtered and concentrated to yield compound 31 as white solid: mp 160–161 °C. 1H NMR (500MHz, CDCl3) δ 8.03 (s, 1H), 7.45 (m, 2H), 6.86 (m, 2H), 6.41 (s, 1H), 4.63 (s, 2H), 3.91 (s, 2H), 3.19 (s, 3H), 1.72 (s, 6H). 13C NMR (125M, CDCl3) δ 169.09, 165.96, 160.23, 157.84, 157.73, 134.60, 133.24, 116.56, 114.71, 108.66, 106.75, 105.98, 99.06, 93.02, 82.85, 65.27, 56.51, 52.39, 25.90. Mass spectra (ESI): m/e 397 (M + H)+. HRMS (ESI) calcd for C22H21O7+ [(M + H)+], 397.1282; found, 397.1260.
Methyl 2-(4-(6-iodo-2,2-dimethyl-4-oxo-4H-[1,3]dioxino[5,4-f]benzofuran-7-yl)phenoxy)acetate (32)
Following the method described for compound 29, the expected compound 32 was obtained. Off-white solid: mp 193 °C (decomposition). 1H NMR (500MHz, CDCl3) δ 8.11 (m, 2H), 8.08 (s, 1H), 7.05 (s, 1H), 7.02 (m, 2H), 4.72 (s, 2H), 3.84 (s, 3H), 1.77 (s, 6H). 13C NMR (125M, CDCl3) δ 168.96, 161.27, 158.72, 157.97, 154.58, 154.32, 128.99, 128.91, 123.63, 122.85, 114.71, 110.56, 106.53, 99.68, 65.19, 59.21, 52.42, 25.85. Mass spectra (ESI): m/e 509 (M + H)+. HRMS (ESI) calcd for C21H18IO7+ [(M + H)+], 509.0092; found, 509.0097.
Methyl 2-(4-(6-((3-chlorophenyl)ethynyl)-2,2-dimethyl-4-oxo-4H-[1,3]dioxino[5,4-f]benzofuran-7-yl)phenoxy)acetate (33)
Following the method described for compound 30, the titled compound 33 was obtained. White solid: mp 173–174 °C. 1H NMR (500MHz, CDCl3) δ 8.28 (s, 1H), 8.17 (m, 2H), 7.56 (m, 1H), 7.46 (m, 1H), 7.35 (m, 2H), 7.03 (m, 3H), 4.72 (s, 2H), 3.84 (s, 3H), 1.76 (s, 6H). 13C NMR (125M, CDCl3) δ 169.03, 161.45, 158.95, 157.81, 157.60, 154.40, 134.46, 131.34, 129.88, 129.80, 127.76, 125.87, 124.61, 123.09, 122.00, 115.02, 110.57, 106.61, 99.95, 97.47, 96.00, 81.33, 65.25, 52.51, 25.93. Mass spectra (ESI): m/e 517 (M + H)+. HRMS (ESI) calcd for C29H22ClO7+ [(M + H)+], 517.1049; found, 517.1044.
2-(4-(Carboxymethoxy)phenyl)-3-((3-chlorophenyl)ethynyl)-6-hydroxybenzofuran-5-carboxylic Acid (6b)
Following the method described for compound 6a, the title compound 6b was obtained. Pale yellow solid: mp 171 °C (decomposition). 1H NMR (500 MHz, DMSO-d6) δ 13.14 (br, 1H), 11.73 (br, 1H), 8.14 (d, J = 8.4 Hz, 2H), 8.11 (s, 1H), 7.80 (s, 1H), 7.67 (d, J = 7.1 Hz, 1H), 7.52 (m, 2H), 7.24 (s, 1H), 7.17 (d, J = 8.4 Hz, 2H), 4.80 (s, 2H). 13C NMR (125M, DMSO-d6) δ 17.033, 159.44, 157.27, 157.19, 133.92, 131.15, 130.65, 129.59, 127.56, 124.49, 122.16, 121.85, 115.71, 99.99, 99.68, 96.55, 95.73, 81.99, 64.97, 31.15. Mass spectra (ESI): m/e 463 (M + H)+. HRMS (ESI) calcd for C25H14ClO7− [(M - H)−], 461.0434; found, 461.0441.
Preparation Libraries 7 and 8
The libraries were set up in 96-well plates. Compound 6a, 6b, amines (Figure 2), 2-(1H-benzotriazole-1-yl)-1, 1, 3, 3,-tetramethylaminium hexafluorophosphate (HBTU), N-hydroxybenzotriazole (HOBt), and diisopropylethylamine (DIPEA) were dissolved as following: 0.25 M for 6a–b, 0.5 M for amines, 0.5 M for HBTU and HOBt, and 1.25 M for DIPEA solutions in dry DMF in 96-deep-well plates. First, 40 µL of stock 6a or 6b solution (0.25 M) was added to each well of a 96-well plate (reaction plate) excluding the 12th column, which contained all other reagents (amines, HBTU, HOBt, DIPEA, DMF, DMSO) as background controls. Next, 20 µL of HBTU and HOBt were transferred to the reaction plates from the 0.5 M 96-deep-well plates. After 5 minutes, 20 µL of DIPEA and amines were transferred to the reaction plates from the master 96-deep-well plates. The reaction plates were sealed and shaken for 24 hours at room temperature. The products were detected by LC/MS. Finally, 130 µL of DMSO was added to the each well to yield the final product concentration of 40 mM, according to a 100% yield. Compounds in the reaction plates were screened at both 10 and 1 µM concentrations to detect inhibition against LYP. The top hits from the libraries were selected and re-synthesized in large scale and purified by HPLC, and their inhibition constants for LYP and selectivity against other PTPs were determined..
3-((3-Chlorophenyl)ethynyl)-6-hydroxy-2-(3-(2-((4-isopropylphenyl)amino)-2-oxoethoxy)phenyl)benzofuran-5-carboxylic Acid (7a)
Off-white solid: mp 236 °C (decomposition). 1H NMR (500 MHz, DMSO-d6) δ 10.05 (s, 1H), 8.15 (s, 1H), 7.86 (d, J = 8.0 Hz, 1H), 7.81 (s, 1H), 7.67 (d, J = 7.7 Hz, 1H), 7.55 (m, 4H), 7.47 (t, J = 7.7 Hz, 1H), 7.23 (s, 1H), 7.19 (d, J = 8.2 Hz, 2H), 7.15 (dd, J = 8.2 Hz, 2.3 Hz, 1H), 4.79 (s, 2H), 2.85 (m, 1H), 1.18 (s, 6H). 13C NMR (125M, DMSO-d6) δ 171.93, 166.01, 160.74, 158.17, 156.90, 156.03, 143.83, 136.05, 133.49, 130.82, 130.69, 130.51, 130.20, 129.82, 129.32, 126.40, 123.80, 122.08, 121.14, 119.93, 118.47, 116.07, 111.89, 110.92, 99.52, 99.14, 98.37, 96.08, 81.15, 67.27, 32.88, 23.93. Mass spectra (ESI): m/e 580 (M + H)+. HRMS (ESI) calcd for C34H25ClNO6− [(M - H)−], 578.1376; found, 578.1365.
3-((3-Chlorophenyl)ethynyl)-6-hydroxy-2-(4-(2-oxo-2-(propylamino)ethoxy)phenyl)benzofuran-5-carboxylic Acid (8a)
White solid: mp 224 °C (decomposition). 1H NMR (500 MHz, DMSO-d6) δ 8.15 (m, 3H), 8.11 (s, 1H), 7.79 (t, J = 1.6 Hz, 1H), 7.66 (dt, J = 7.4, 1.3 Hz, 1H), 7.55 (dt, J = 8.7, 1.4 Hz, 1H), 7.23 (s, 1H), 7.19 (d, J = 8.9 Hz, 2H), 4.58 (s, 2H), 3.11 (m, 2H), 1.46 (m, 2H), 0.84 (t, J = 7.4 Hz, 3H). 13C NMR (125M, DMSO-d6) δ 172.48, 167.53, 160.86, 159.47, 157.31, 133.94, 131.17, 130.64, 129.64, 127.60, 124.48, 122.26, 122.06, 121.83, 116.00, 99.99, 99.62, 96.63, 95.74, 81.99, 67.48, 40.90, 22.81, 11.78. Mass spectra (ESI): m/e 504 (M + H)+. HRMS (ESI) calcd for C28H21ClNO6− [(M - H)−], 502.1063; found, 502.1081.
3-((3-Chlorophenyl)ethynyl)-2-(4-(2-(cyclopropylamino)-2-oxoethoxy)phenyl)-6-hydroxybenzofuran-5-carboxylic Acid (8b)
White solid: mp 201 °C (decomposition). 1H NMR (500 MHz, DMSO-d6) δ 8.19 (m, 1H), 8.14 (m, 3H), 7.80 (m, 1H), 7.67 (m, 1H), 7.53 (m, 2H), 7.25 (s, 1H), 7.18 (m, 2H), 4.55 (s, 2H), 2.71(m, 1H), 0.65 (m, 2H), 0.50 (m, 2H). 13C NMR (125M, DMSO-d6) δ 171.64, 168.36, 161.25, 158.85, 156.47, 133.48, 130.72, 130.67, 130.15, 129.11, 127.04, 126.97, 124.12, 122.03, 121.38, 115.48, 99.52, 98.58, 96.29, 95.06, 81.93, 66.93, 22.19, 5.18. Mass spectra (ESI): m/e 502 (M + H)+. HRMS (ESI) calcd for C28H19ClNO6− [(M -H)−], 500.0906; found, 500.0911.
3-((3-Chlorophenyl)ethynyl)-6-hydroxy-2-(4-(2-oxo-2-(phenylamino)ethoxy)phenyl)benzofuran-5-carboxylic Acid (8c)
White solid: mp 178 °C (decomposition). 1H NMR (500 MHz, DMSO-d6) δ 11.70 (br, 1H), 10.14 (s, 1H), 8.17 (d, J = 8.9 Hz, 2H), 8.12 (s, 1H), 7.80 (m, 1H), 7.66 (m, 3H), 7.52 (m, 2H), 7.34 (t, J = 7.7 Hz, 2H), 7.25 (m, 3H), 7.09 (t, J = 7.4 Hz, 1H), 4.83 (s, 2H). 13C NMR (125M, DMSO-d6) δ 166.13, 160.39, 159.12, 156.85, 156.82, 138.36, 133.47, 130.74, 130.70, 130.20, 129.17, 128.75, 127.19, 124.00, 123.73, 121.82, 121.60, 121.39, 119.71, 115.52, 99.52, 99.17, 96.17, 95.31, 81.49, 67.09. Mass spectra (ESI): m/e 538 (M + H)+. HRMS (ESI) calcd for C31H19ClNO6− [(M - H)−], 536.0906; found, 536.0898.
2-(4-(2-((3s,5s,7s)-Adamantan-1-ylamino)-2-oxoethoxy)phenyl)-3-((3-chlorophenyl)ethynyl)-6-hydroxybenzofuran-5-carboxylic Acid (8d)
Pale yellow solid: mp 166°C (decomposition). 1H NMR (500 MHz, DMSO-d6) δ 8.14 (m, 3H), 7.80 (s, 1H), 7.66 (d, J = 7.5 Hz, 1H), 7.55 (m, 1H), 7.51 (t, J = 7.7 Hz, 1H), 7.42 (s, 1H), 7.25 (s, 1H), 7.17 (d, J = 8.9 Hz, 2H), 4.51 (s, 2H), 2.02 (m, 4H), 1.97 (m, 6H), 1.62 (m, 6H). Mass spectra (ESI): m/e 596 (M + H)+. HRMS (ESI) calcd for C35H29ClNO6− [(M - H)−], 594.1689; found, 594.1694.
3-((3-Chlorophenyl)ethynyl)-2-(4-(2-(4-(3,4-dichlorophenyl)piperidin-1-yl)-2-oxoethoxy)phenyl)-6-hydroxybenzofuran-5-carboxylic Acid (8e)
Pale yellow solid: mp 123–124 °C. 1H NMR (500 MHz, DMSO-d6) δ 8.14 (m, 3H), 7.80 (m, 1H), 7.66 (m, 1H), 7.54 (m, 2H), 7.42 (d, J = 8.9 Hz, 1H), 7.25 (s, 1H), 7.19 (d, J = 6.5 Hz, 2H), 7.18 (s, 1H), 6.97 (m, 1H), 5.02 (s, 2H), 3.61 (m, 4H), 3.30 (m, 2H), 3.21 (m, 2H), 3.17 (m, 1H). Mass spectra (ESI): m/e 674 (M + H)+. HRMS (ESI) calcd for C36H25Cl3NO6− [(M - H)−], 672.0753; found, 672.0684.
3-((3-Chlorophenyl)ethynyl)-2-(4-(2-((3,4-dimethoxybenzyl)amino)-2-oxoethoxy)phenyl)-6-hydroxybenzofuran-5-carboxylic Acid (8f)
Pale yellow solid: mp 185 °C (decomposition). 1H NMR (500 MHz, DMSO-d6) δ 8.63 (t, J = 6.0 Hz, 1H), 8.16 (d J = 8.9 Hz, 2H), 8.12 (s, 1H), 7.80 (m, 1H), 7.66 (m, 1H), 7.54 (m, 2H), 7.24 (s, 1H), 7.21 (m, 2H), 6.86 (m, 2H), 6.78 (m, 1H), 4.67 (s, 2H), 4.29 (d, J = 6.0 Hz, 2H), 3.70 (s, 6H). Mass spectra (ESI): m/e 612 (M + H)+. HRMS (ESI) calcd for C34H25ClNO8− [(M - H)−], 601.1274; found, 601.1275.
3-((3-Chlorophenyl)ethynyl)-2-(4-(2-((3,4-dichlorobenzyl)amino)-2-oxoethoxy)phenyl)-6-hydroxybenzofuran-5-carboxylic Acid (8g)
Off-white solid: mp 135–136 °C. 1H NMR (500 MHz, DMSO-d6) δ 8.26 (t, J = 5.8 Hz, 1H), 8.14 (m, 4H), 7.80 (m, 1H), 7.67 (m, 1H), 7.53 (d, J = 1.0 HZ, 2H), 7.24 (s, 1H), 7.17 (m, 3H), 4.57 (s, 2H), 3.40 (q, J = 6.8 Hz, 2H), 2.88 (t, J = 6.8 Hz, 2H). Mass spectra (ESI): m/e 634 (M + H)+. HRMS (ESI) calcd for C33H21Cl3NO6− [(M - H)−], 632.0440; found, 632.0406.
Expression and purification of the LYP catalytic domain
N-terminal (His)6-tagged LYP catalytic domain (residues 1–303) was subcloned into pET28a. For protein expression, the LYP expressing construct was transformed into Escherichia coli BL21-(DE3). Transformed cells were grown at 37 °C in Luria broth (LB) containing 100 µg/mL ampicillin for 4 h until the OD600 reached 0.6, and then induced for growth overnight at room temperature with 0.4 mM IPTG. Cells were harvested by centrifugation (6000 rpm for 15 min at 4 °C), and the cell pellets from 1.5 L of LB medium were suspended in 30 mL of ice-cold lysis buffer consisting of 5 mM imidazole, 500 mM NaCl, 20 mM Tris-HCl (pH 7.9), 0.05 mg/mL trypsin inhibitor, and 0.1 mM PMSF. The suspensions were passed twice through a French Press at 1000 psi, and the cell lysates were centrifuged at 4 °C for 30 min at 15000 rpm. The supernatants were mixed with 2 mL of Ni-NTA Agarose (His*Bind Resin) (Qiagen) at 4 °C for 1 h, and then the mixture was transferred to an empty column. The column was washed with 200 mL of binding buffer (5 mM imidazole, 500 mM NaCl, 20 mM Tris-HCl (pH 7.9)), followed by 20 mL of wash buffer (20 mM imidazole, 500 mM NaCl, 20 mM Tris-HCl (pH 7.9)), and then eluted with 20 mL of elution buffer (200 mM imidazole, 500 mM NaCl, 20 mM Tris-HCl (pH 7.9), 5 mM DTT). The elution was dialyzed for 6 h at 4 °C against 1 L buffer A (50 mM NaCl, 20 mM MES (pH 5.8), 1 mM EDTA), and then loaded onto a Mono S column equilibrated at 4 °C with buffer A. The column was washed with 10 mL of buffer A and then eluted with a 40 mL of linear gradient of 0 to 1 M NaCl in buffer A. The column fractions were analyzed by measuring the absorbance at 280 nm and by carrying out SDS-PAGE analysis. The fractions were combined, concentrated at 4 °C to ≤ 1 mL using an Amicon concentrator and then loaded onto a gel filtration column Superdex 75. The column was eluted with buffer A, and then the fractions which contained protein were combined and concentrated to 8 mg/ml and stored at −80 °C. The LYP preparation was shown to be homogeneous by SDS-PAGE analysis.
Crystallization and data collection
For co-crystallization of LYP with compound 8b, 100 µl of 7 mg/ml LYP was mixed with 4 µl stock of compound 8b (20 mM in DMSO). Crystals were then grown by vapor diffusion in hanging drops at room temperature. Drops containing 1:1 volumes of protein in stock buffer and reservoir solutions were equilibrated against the reservoir solution A (0.2 M sodium formate pH 7.2, 20% PEG3350). The crystal was transferred into a reservoir solution B (0.2 M sodium formate pH 7.2, 30% PEG3350, 1 mM 8b, 5% DMSO), soaked for 10 minutes, and flash-cooled in liquid nitrogen. X-ray data were collected at 100 K at SBC-CAT beamline 19-BM at the Advanced Photon Source (Argonne, IL) equipped with a mosaic CCD detector. The crystals belong to space group P212121 with the following unit cell parameters: a = 46.19 Å, b = 93.64 Å and c = 153.50 Å. There are two protein monomers in the asymmetric unit. All data were processed with HKL3000,55 and the statistics are provided in Table 6.
Structural refinement of LYP•8b
The structure of LYP•8b was solved by molecular replacement using the program AMoRe.56 The structure of the LYP catalytic domain (PDB entry code 2P6X),40 without the solvent molecules and other small molecules, was used as a search model. The map revealed the density for the bound compound 8b in the active site of LYP. The structure was refined to 2.30 Å resolution with the program CNS1.1,57 first using simulated annealing at 2,500 K, and then alternating positional and individual temperature factor refinement cycles. The progress of the refinement was evaluated by the improvement in the quality of the electron density maps, and the reduced values of the conventional R factor (R = Σh||Fo| - |Fc||/Σh|Fo|), and the free R factor (4.2% of the reflections omitted from the refinement).58 Electron density maps were inspected and the model was modified on an interactive graphics workstation with the program O.59 Finally, water molecules were added gradually as the refinement progressed. They were assigned in the |Fo| - |Fc| difference Fourier maps with a 3σ cutoff level for inclusion in the model. The statistics of refinements were also provided in Table 6. Molecular graphics were prepared by using Pymol (www.pymol.sourceforge.net).
Data deposition
The coordinates for the structure of the LYP•8b complex (PDB ID 4J51) have been deposited in the Protein Data Bank.
Enzyme kinetic assay
PTP activity was assayed using p-nitrophenyl phosphate (pNPP) as a substrate in 3,3-dimethylglutarate buffer (50 mM 3,3-dimethylglutarate, pH 7.0, 1 mM EDTA, 150 mM NaCl) at 25 °C. The assays were performed in 96-well plates. Normally, to determine the IC50 values for LYP, the reaction was initiated by the addition of enzyme (final concentration at 20 nM) to a reaction mixture (0.2 mL) containing 5.0 mM (Km for the substrate against LYP) pNPP with serial dilutions. To determine the IC50 values for other PTPs, the assays were carried out under the same conditions used for LYP except that the concentration of the pNPP was set at the corresponding Km value for each PTP. All PTPs used in the study were recombinant proteins prepared in-house. Concentration of compounds used to determine IC50 values ranged from 0.2- to 5-fold of the IC50 values. The reaction rate was measured using a SpectraMax Plus 384 Microplate Spectrophotometer (Molecular Devices). To determine the mode of inhibition, the reactions were initiated by the addition of LYP (final concentration at 5 nM) to the reaction mixtures (0.2 mL) containing various concentrations of pNPP and inhibitor 8b. Data were fitted using SigmaPlot Enzyme Kinetics Module (Systat Software, Inc.).
Cell culture
Jurkat T cells expressing the SV-40 large T Antigen (JTAg)60 were kept at logarithmic growth in RPMI 1640 medium (Mediatech, Manassas, VA) supplemented with 10% fetal bovine serum (Omega Scientific, Tarzana, CA), 2 mM glutamine, 1 mM sodium pyruvate, 10 mM HEPES pH 7.3, 2.5 mg/ml D-glucose, 100 units/ml of penicillin and 100 µg/ml streptomycin (Life Technologies, Carlsbad, CA). Murine bone marrow derived mast cells (BMMC) were obtained from 4–6 week culture of cells from bone marrow of PEP+/+ and PEP−/− mice essentially as described.61 The cells were cultured in IMDM supplemented with 10% heat-inactivated fetal calf serum (FBS), 2 mM L-glutamine, 1 mM pyruvate, 5 ng/ml IL-3 and 100 ng/ml stem cell factor (SCF). Cells were cultured at 37 °C in a CO2 incubator.
Phospho-flow cytometry
JTAg cells were pretreated with 15 µM compound 8b or DMSO for 30 minutes in RPMI 1640 at 37°C. Cells were then stimulated with supernatants of C305 hybridoma62 for 2 min at 37°C. Cells were fixed immediately with BD Cytofix buffer, permeabilized using BD Phosflow Perm Buffer III and stained with AlexaFluor-conjugated anti-pZAP-70(Y319) antibody according to the manufacturer’s protocols (BD Biosciences, San Jose, CA). Cell fluorescence was analyzed by FACS using a BD LSR II (BD Biosciences). Data was analyzed using FlowJo software (TreeStar, Ashland, OR).
Thymocyte isolation
Nur77GFP reporter mice were kindly provided by K. Hogquist (University of Minnesota, MN).47 To isolate mouse thymocytes, thymi were homogenized and passed through a 70 µM nylon strainer. Cells were washed in RPMI-1640, and red blood cells were depleted following treatment of the cell pellets with RBC lysis buffer according to the manufacturer’s protocol (eBioscience, San Diego, CA). Thymocytes then were further washed in RPMI-1640, counted, and used for the experiments described above.
T cell activation assays
CD69 expression on JTAg cells was measured following incubation with 15 µM 8b or DMSO for 4.5 hours in RPMI 1640 at 37°C. Cells were then stained with a FITC-conjugated anti-CD69 antibody (Biolegend, San Diego, CA). CD69 and Nur77 expression on CD4 and CD8 double-positive (DP) mouse thymocytes from Nur77GFP reporter mice was measured following incubation with 15 µM 8b or DMSO for 4.5 hours in RPMI 1640 at 37°C. Cells were then stained with PE-conjugated-anti-CD69, APC-conjugated-anti-CD8, eFluor-450-conjugated anti-CD4 and PerCP-Cy5.5-conjugated-anti-TCRβ antibodies (Biolegend and eBioscience). Nur77 expression was assessed by fluorescence of GFP. Cell fluorescence was analyzed by FACS using a BD LSR II (BD Biosciences, San Jose, CA). Data were analyzed using FlowJo software (TreeStar, Ashland, OR).
Animals
PEP+/− mice on a C57BL/6 background were generated by Hasegawa et al.,63 and kindly provided by Genentech Inc., South San Francisco, CA, USA. The mice were subsequently bred in house on the same background and crossed to obtain wild type and knockout littermates for the study. Nur77GFP were generously obtained from K. Hogquist. The genotypes of the mice were established by tissue biopsies and subsequent PCR analysis as previously described.47,51 All the animal experiments were performed according to European and German statutory regulations.
Passive systemic anaphylaxis (PSA)
PSA was carried out essentially as described by Obiri et al.51 In brief, 8–9 month old female mice (20–25g) were sensitized by intra-peritoneal (i.p.) injection with anti-DNP IgE (1 mg/kg) for 24 h. Compound 8b (20 µM) per mouse or vehicle (PBS) were administered by IP injection 1 h to the end of sensitization period. Anaphylaxis was initiated by intravenous (i.v.) injection of 200 µl dinitrophenyl human serum albumin DNP-HSA (1 mg/ml PBS). Body temperature was measured with a Microlife VT 1831 Vet-Temp (Tiershop, Trier, Germany) every 5 min over a period of 60 min.
Luciferase Reporter Gene Analysis
8×10⁶ BMMC cells were transfected with 4.5 µg 3X NFAT-luciferase and 0.8 µg of pUbi-Renilla Luc vectors by electroporation using the Nucleofector II (Amaxa) Program T-023. The cells were then plated in 2 ml culture medium (IMDM supplemented with 10% heat-inactivated FBS, 2 mM L-glutamine, 1 mM pyruvate, 5 ng/ml IL-3 and 100 ng/ml SCF) for 24 h to recover from the electroporation. The cells were then left unsensitized or sensitized with anti-DNP IgE for 18 h. They were then left untreated or activated with DNP-HSA for 8 h. Thereafter they were lysed in passive lysis buffer (Promega Mannheim, Germany) and the lysates were centrifuged at 10,000 rpm for 10 min at 4° C. Firefly and Renilla luciferase activity were then measured using Perkin Elmer luminescence counter 1420 (Victor light).
Measurement of β hexosaminidase
5×10⁶ cells/ml BMMC from PEP+/+ and PEP−/− mice were sensitized with anti DNP-IgE for 16 h and treated with C-28 (5 µM), 8b (5 µM) or 8b (20 µM) for 1 h at the end of IgE incubation. The cells were then activated with DNP-HAS (200 ng/ml) for various time points. Cells were harvested washed and re-suspended in 100 µl of Tyrodes buffer (135 mM NaCl, 5 mM KCl, 1 mM MgCl2, 1 mM CaCl2, 5 mM Glucose, 20 mM HEPES, pH 7.4) at 37°C and b-hexosaminidase activity determined in an Ultra micro-plate reader ELx808IU (Bio-Tec-Instruments, Inc.) at a wavelength of 405 nm as previously described.as previously described.64 Percent degranulation was calculated as the released activity/total activity ×100.
Acknowledgements
This work was supported in part by the National Institutes of Health Grants RO1CA152194 to Z.-Y. Z., R01AI070544 to N.B., and funds from the DFG (SPP 1394) to A. C. B. C. S.M.S. is supported by a Postdoctoral Fellowship from the Juvenile Diabetes Research Foundation. Compound screening was carried out in the Chemical Genomics Core Facility at Indiana University School of Medicine. We thank Jutta Stober, Rebecca Dittus, Selma Huber and Manuela Sauer for their excellent technical assistance.
Abbreviations Used
- LYP
lymphoid-specific tyrosine phosphatase
- PTK
protein tyrosine kinase
- PTP
protein tyrosine phosphatase
- TCR
T cell receptor
- Lck
lymphoid T cell tyrosine kinase
- ZAP-70
ζ-chain-associated protein kinase 70
- Csk
Src C-terminal kinase
- pNPP
p-nitrophenyl phosphate
- SAR
structure-activity relationship
- DMF
dimethylformamide
- IC50
concentration at 50% inhibition
- JTAg
Jurkat T leukemia cells expressing SV-40 large T antigen
- PEP
PEST-domain-enriched tyrosine phosphatase
- BMMC
bone marrow derived mast cells
- PSA
passive systemic anaphylaxis
- DMSO
dimethylsulfoxide
- TFA
trifluoroacetic acid
- HBTU
O-(benzotriazol-1-yl)-N,N,N′,N′-tetramethyluronium hexafluorophosphate
- HOBt
hydroxybenzotriazole
- DIPEA
diisopropylethylamine
- THF
tetrahydrofuran
- PBS
phosphate-buffered saline
- FBS
fetal bovine serum
References
- 1.Hunter T. Tyrosine phosphorylation: thirty years and counting. Curr. Opin. Cell Biol. 2009;21:140–146. doi: 10.1016/j.ceb.2009.01.028. [DOI] [PMC free article] [PubMed] [Google Scholar]
- 2.Tonks NK. Protein tyrosine phosphatases: from genes to function, to disease. Nat. Rev. Mol. Cell Biol. 2006;7:833–846. doi: 10.1038/nrm2039. [DOI] [PubMed] [Google Scholar]
- 3.Cohen P, Alessi DR. Kinase Drug Discovery - What's Next in the Field? ACS Chem. Biol. 2013;8:96–104. doi: 10.1021/cb300610s. [DOI] [PMC free article] [PubMed] [Google Scholar]
- 4.Zhang Z-Y. Protein Tyrosine Phosphatases: Prospects for Therapeutics. Curr. Opin. Chem. Biol. 2001;5:416–423. doi: 10.1016/s1367-5931(00)00223-4. [DOI] [PubMed] [Google Scholar]
- 5.Julien SG, Dubé N, Hardy S, Tremblay ML. Inside the human cancer tyrosine phosphatome. Nat. Rev. Cancer. 2011;11:35–49. doi: 10.1038/nrc2980. [DOI] [PubMed] [Google Scholar]
- 6.Cohen S, Dadi H, Shaoul E, Sharfe N, Roifman CM. Cloning and characterization of a lymphoid-specific, inducible human protein tyrosine phosphatase, Lyp. Blood. 1999;93:2013–2024. [PubMed] [Google Scholar]
- 7.Gjorloff-Wingren A, Saxena M, Williams S, Hammi D, Mustelin T. Characterization of TCR-induced receptor-proximal signaling events negatively regulated by the protein tyrosine phosphatase PEP. Eur. J. Immunol. 1999;29:3845–3854. doi: 10.1002/(SICI)1521-4141(199912)29:12<3845::AID-IMMU3845>3.0.CO;2-U. [DOI] [PubMed] [Google Scholar]
- 8.Cloutier J-F, Veillette A. Cooperative inhibition of T-cell antigen receptor signaling by a complex between a kinase and a phosphatase. J. Exp. Med. 1999;189:111–121. doi: 10.1084/jem.189.1.111. [DOI] [PMC free article] [PubMed] [Google Scholar]
- 9.Wu J, Katrekar A, Honigberg LA, Smith AM, Conn MT, Tang J, Jeffery D, Mortara K, Sampang J, Williams SR, Buggy J, Clark JM. Identification of substrates of human protein-tyrosine phosphatase PTPN22. J. Biol. Chem. 2006;281:11002–11010. doi: 10.1074/jbc.M600498200. [DOI] [PubMed] [Google Scholar]
- 10.Bottini N, Musumeci L, Alonso A, Rahmouni S, Nika K, Rostamkhani M, MacMurray J, Meloni GF, Lucarelli P, Pellecchia M, Eisenbarth GS, Comings D, Mustelin T. A functional variant of lymphoid tyrosine phosphatase is associated with type I diabetes. Nat. Genet. 2004;36:337–338. doi: 10.1038/ng1323. [DOI] [PubMed] [Google Scholar]
- 11.Begovich AB, Carlton VE, Honigberg LA, Schrodi SJ, Chokkalingam AP, Alexander HC, Ardlie KG, Huang Q, Smith AM, Spoerke JM, Conn MT, Chang M, Chang SY, Saiki RK, Catanese JJ, Leong DU, Garcia VE, McAllister LB, Jeffery DA, Lee AT, Batliwalla F, Remmers E, Criswell LA, Seldin MF, Kastner DL, Amos CI, Sninsky JJ, Gregersen PK. A missense single-nucleotide polymorphism in a gene encoding a protein tyrosine phosphatase (PTPN22) is associated with rheumatoid arthritis. Am. J. Hum. Genet. 2004;75:330–337. doi: 10.1086/422827. [DOI] [PMC free article] [PubMed] [Google Scholar]
- 12.Carlton VE, Hu X, Chokkalingam AP, Schrodi SJ, Brandon R, Alexander HC, Chang M, Catanese JJ, Leong DU, Ardlie KG, Kastner DL, Seldin MF, Criswell LA, Gregersen PK, Beasley E, Thomson G, Amos CI, Begovich AB. PTPN22 genetic variation: evidence for multiple variants associated with rheumatoid arthritis. Am. J. Hum. Genet. 2005;77:567–581. doi: 10.1086/468189. [DOI] [PMC free article] [PubMed] [Google Scholar]
- 13.Smyth D, Cooper JD, Collins JE, Heward JM, Franklyn JA, Howson JM, Vella A, Nutland S, Rance HE, Maier L, Barratt BJ, Guja C, Ionescu-Tirgoviste C, Savage DA, Dunger DB, Widmer B, Strachan DP, Ring SM, Walker N, Clayton DG, Twells RC, Gough SC, Todd JA. Replication of an association between the lymphoid tyrosine phosphatase locus (LYP/PTPN22) with type 1 diabetes, and evidence for its role as a general autoimmunity locus. Diabetes. 2004;53:3020–3023. doi: 10.2337/diabetes.53.11.3020. [DOI] [PubMed] [Google Scholar]
- 14.Kyogoku C, Langefeld CD, Ortmann WA, Lee A, Selby S, Carlton VE, Chang M, Ramos P, Baechler EC, Batliwalla FM, Novitzke J, Williams AH, Gillett C, Rodine P, Graham RR, Ardlie KG, Gaffney PM, Moser KL, Petri M, Begovich AB, Gregersen PK, Behrens TW. Genetic association of the R620W polymorphism of protein tyrosine phosphatase PTPN22 with human SLE. Am. J. Hum. Genet. 2004;75:504–507. doi: 10.1086/423790. [DOI] [PMC free article] [PubMed] [Google Scholar]
- 15.Vandiedonck C, Capdevielle C, Giraud M, Krumeich S, Jais JP, Eymard B, Tranchant C, Gajdos P, Garchon HJ. Association of the PTPN22*R620W polymorphism with autoimmune myasthenia gravis. Ann. Neurol. 2006;59:404–407. doi: 10.1002/ana.20751. [DOI] [PubMed] [Google Scholar]
- 16.Greve B, Hoffmann P, Illes Z, Rozsa C, Berger K, Weissert R, Melms A. The autoimmunity- related polymorphism PTPN22 1858C/T is associated with anti-titin antibodypositive myasthenia gravis. Hum. Immunol. 2009;70:540–542. doi: 10.1016/j.humimm.2009.04.027. [DOI] [PubMed] [Google Scholar]
- 17.Canton I, Akhtar S, Gavalas NG, Gawkrodger DJ, Blomhoff A, Watson PF, Weetman AP, Kemp EH. A single-nucleotide polymorphism in the gene encoding lymphoid protein tyrosine phosphatase (PTPN22) confers susceptibility to generalised vitiligo. Genes. Immun. 2005;6:584–587. doi: 10.1038/sj.gene.6364243. [DOI] [PubMed] [Google Scholar]
- 18.LaBerge GS, Bennett DC, Fain PR, Spritz RA. PTPN22 is genetically associated with risk of generalized vitiligo, but CTLA4 is not. J. Investig. Dermatol. 2008;128:1757–1762. doi: 10.1038/sj.jid.5701233. [DOI] [PubMed] [Google Scholar]
- 19.Burn GL, Svensson L, Sanchez-Blanco C, Saini M, Cope AP. Why is PTPN22 a good candidate susceptibility gene for autoimmune disease? FEBS Lett. 2011;585:3689–3698. doi: 10.1016/j.febslet.2011.04.032. [DOI] [PubMed] [Google Scholar]
- 20.Vang T, Congia M, Macis MD, Musumeci L, Orru V, Zavattari P, Nika K, Tautz L, Tasken K, Cucca F, Mustelin T, Bottini N. Autoimmune-associated lymphoid tyrosine phosphatase is a gain-of-function variant. Nat. Genet. 2005;37:1317–1319. doi: 10.1038/ng1673. [DOI] [PubMed] [Google Scholar]
- 21.Rieck M, Arechiga A, Onengut-Gumuscu S, Greenbaum C, Concannon P, Buckner JH. Genetic variation in PTPN22 corresponds to altered function of T and B lymphocytes. J. Immunol. 2007;179:4704–4710. doi: 10.4049/jimmunol.179.7.4704. [DOI] [PubMed] [Google Scholar]
- 22.Arechiga AF, Habib T, He Y, Zhang X, Zhang Z-Y, Funk A, Buckner JH. Cutting edge: the PTPN22 allelic variant associated with autoimmunity impairs B cell signaling. J. Immunol. 2009;182:3343–3347. doi: 10.4049/jimmunol.0713370. [DOI] [PMC free article] [PubMed] [Google Scholar]
- 23.Habib T, Funk A, Rieck M, Brahmandam A, Dai X, Panigrahi AK, Luning Prak ET, Meyer-Bahlburg A, Sanda S, Greenbaum C, Rawlings DJ, Buckner JH. Altered B cell homeostasis is associated with type I diabetes and carriers of the PTPN22 allelic variant. J Immunol. 2012;188:487–496. doi: 10.4049/jimmunol.1102176. [DOI] [PMC free article] [PubMed] [Google Scholar]
- 24.Vang T, Liu WH, Delacroix L, Wu S, Vasile S, Dahl R, Yang L, Musumeci L, Francis D, Landskron J, Tasken K, Tremblay ML, Lie BA, Page R, Mustelin T, Rahmouni S, Rickert RC, Tautz L. LYP inhibits T-cell activation when dissociated from CSK. Nat. Chem. Biol. 2012;8:437–446. doi: 10.1038/nchembio.916. [DOI] [PMC free article] [PubMed] [Google Scholar]
- 25.Orrú V, Tsai SJ, Rueda B, Fiorillo E, Stanford SM, Dasgupta J, Hartiala J, Zhao L, Ortego-Centeno N, D'Alfonso S, Italian Collaborative Group, Arnett FC, Wu H, Gonzalez-Gay MA, Tsao BP, Pons-Estel B, Alarcon-Riquelme ME, He Y, Zhang Z-Y, Allayee H, Chen XS, Martin J, Bottini N. A loss-of-function variant of PTPN22 is associated with reduced risk of systemic lupus erythematosus. Hum. Mol. Genet. 2009;18:569–579. doi: 10.1093/hmg/ddn363. [DOI] [PMC free article] [PubMed] [Google Scholar]
- 26.Brownlie RJ, Miosge LA, Vassilakos D, Svensson LM, Cope A, Zamoyska R. Lack of the phosphatase PTPN22 increases adhesion of murine regulatory T cells to improve their immunosuppressive function. Sci Signal. 2013;5:ra87. doi: 10.1126/scisignal.2003365. [DOI] [PMC free article] [PubMed] [Google Scholar]
- 27.Zheng P, Kissler S. PTPN22 Silencing in the NOD Model Indicates the Type 1 Diabetes- Associated Allele Is Not a Loss-of-Function Variant. Diabetes. 2012;62:896–904. doi: 10.2337/db12-0929. [DOI] [PMC free article] [PubMed] [Google Scholar]
- 28.Yu X, Sun JP, He Y, Guo XL, Liu S, Zhou B, Hudmon A, Zhang Z-Y. Structure, inhibitor, and regulatory mechanism of Lyp, a lymphoid-specific tyrosine phosphatase implicated in autoimmune diseases. Proc. Natl. Acad. Sci. USA. 2007;104:19767–19772. doi: 10.1073/pnas.0706233104. [DOI] [PMC free article] [PubMed] [Google Scholar]
- 29.Xie YL, Liu YD, Gong GL, Rinderspacher A, Deng SX, Smith DH, Toebben U, Tzilianos E, Branden L, Vidovic D, Chung C, Schurer S, Tautz L, Landry DW. Discovery of a novel submicromolar inhibitor of the lymphoid specific tyrosine phosphatase. Bioorg. Med. Chem. Lett. 2008;18:2840–2844. doi: 10.1016/j.bmcl.2008.03.079. [DOI] [PMC free article] [PubMed] [Google Scholar]
- 30.Wu S, Bottini M, Rickert RC, Mustelin T, Tautz L. In silico screening for PTPN22 inhibitors: active hits from an inactive phosphatase conformation. ChemMedChem. 2009;4:440–444. doi: 10.1002/cmdc.200800375. [DOI] [PMC free article] [PubMed] [Google Scholar]
- 31.Karver MR, Krishnamurthy D, Kulkarni RA, Bottini N, Barrios AM. Identifying potent selective protein tyrosine phosphatase inhibitors from a library of Au(I) complexes. J. Med. Chem. 2009;52:6912–6918. doi: 10.1021/jm901220m. [DOI] [PMC free article] [PubMed] [Google Scholar]
- 32.Karver MR, Krishnamurthy D, Bottini N, Barrios AM. Gold(I) phosphine mediated selective inhibition of lymphoid tyrosine phosphatase. J. Inorg. Biochem. 2010;104:268–273. doi: 10.1016/j.jinorgbio.2009.12.012. [DOI] [PMC free article] [PubMed] [Google Scholar]
- 33.Vidović D, Xie Y, Rinderspacher A, Deng SX, Landry DW, Chung C, Smith DH, Tautz L, Schürer SC. Distinct functional and conformational states of the human lymphoid tyrosine phosphatase catalytic domain can be targeted by choice of the inhibitor chemotype. J. Comput. Aided. Mol. Des. 2011;25:873–883. doi: 10.1007/s10822-011-9469-2. [DOI] [PMC free article] [PubMed] [Google Scholar]
- 34.Stanford SM, Krishnamurthy D, Falk MD, Messina R, Debnath B, Li S, Liu T, Kazemi R, Dahl R, He Y, Yu X, Chan AC, Zhang Z-Y, Barrios AM, Woods VL, Jr, Neamati N, Bottini N. Discovery of a novel series of inhibitors of lymphoid tyrosine phosphatase with activity in human T cells. J. Med. Chem. 2011;54:1640–1654. doi: 10.1021/jm101202j. [DOI] [PMC free article] [PubMed] [Google Scholar]
- 35.Vang T, Xie Y, Liu WH, Vidović D, Liu Y, Wu S, Smith DH, Rinderspacher A, Chung C, Gong G, Mustelin T, Landry DW, Rickert RC, Schürer SC, Deng SX, Tautz L. Inhibition of lymphoid tyrosine phosphatase by benzofuran salicylic acids. J. Med. Chem. 2011;54:562–571. doi: 10.1021/jm101004d. [DOI] [PMC free article] [PubMed] [Google Scholar]
- 36.He Y, Zeng L-F, Yu Z-H, He R, Liu S, Zhang Z-Y. Bicyclic benzofuran and indole-based salicylic acids as protein tyrosine phosphatase inhibitors. Bioorg. Med. Chem. 2012;20:1940–1946. doi: 10.1016/j.bmc.2011.11.004. [DOI] [PMC free article] [PubMed] [Google Scholar]
- 37.Puius YA, Zhao Y, Sullivan M, Lawrence DS, Almo SC, Zhang Z-Y. Identification of a Second Aryl Phosphate-Binding Site in Protein-Tyrosine Phosphatase 1B: A Paradigm for Inhibitor Design. Proc. Natl. Acad. Sci. USA. 1997;94:13420–13425. doi: 10.1073/pnas.94.25.13420. [DOI] [PMC free article] [PubMed] [Google Scholar]
- 38.Zhang Z-Y. Protein Tyrosine Phosphatases: Structure and function Substrate Specificity and Inhibitor Development. Annu. Rev. Pharmacol. Toxicol. 2002;42:209–234. doi: 10.1146/annurev.pharmtox.42.083001.144616. [DOI] [PubMed] [Google Scholar]
- 39.He Y, Xu J, Yu Z-H, Gunawan AM, Wu L, Wang L, Zhang Z-Y. Discovery and evaluation of novel inhibitors of Mycobacterium protein tyrosine phosphatase B from the 6-hydroxy-benzofuran-5-carboxylic acid scaffold. J. Med. Chem. 2013;56:832–842. doi: 10.1021/jm301781p. [DOI] [PMC free article] [PubMed] [Google Scholar]
- 40.Barr AJ, Ugochukwu E, Lee WH, King ON, Filippakopoulos P, Alfano I, Savitsky P, Burgess-Brown NA, Muller S, Knapp S. Large-scale structural analysis of the classical human protein tyrosine phosphatome. Cell. 2009;136:352–363. doi: 10.1016/j.cell.2008.11.038. [DOI] [PMC free article] [PubMed] [Google Scholar]
- 41.Sarmiento M, Wu L, Keng YF, Song L, Luo Z, Huang Z, Wu G-Z, Yuan AK, Zhang Z-Y. Structure-based discovery of small molecule inhibitors targeted to protein tyrosine phosphatase 1B. J. Med. Chem. 2000;43:146–155. doi: 10.1021/jm990329z. [DOI] [PubMed] [Google Scholar]
- 42.Liang F, Huang Z, Lee S-Y, Liang J, Ivanov MI, Alonso A, Bliska JB, Lawrence DS, Mustelin T, Zhang Z-Y. Aurintricarboxylic acid blocks in vitro and in vivo activity of YopH, an essential virulent factor of Yersinia pestis, the agent of plague. J. Biol. Chem. 2003;278:41734–41741. doi: 10.1074/jbc.M307152200. [DOI] [PubMed] [Google Scholar]
- 43.Zhang X, He Y, Liu S, Yu Z, Jiang Z-X, Yang Z, Dong Y, Nabinger SC, Wu L, Gunawan AM, Wang L, Chan RJ, Zhang Z-Y. Salicylic acid-based small molecule inhibitor for the oncogenic Src homology-2 domain containing protein tyrosine phosphatase-2 (SHP2) J. Med. Chem. 2010;53:2482–2493. doi: 10.1021/jm901645u. [DOI] [PMC free article] [PubMed] [Google Scholar]
- 44.Sarmiento M, Puius YA, Vetter SW, Keng YF, Wu L, Zhao Y, Lawrence DS, Almo SC, Zhang Z-Y. Structural basis of plasticity in protein tyrosine phosphatase 1B substrate recognition. Biochemistry. 2000;39:8171–8179. doi: 10.1021/bi000319w. [DOI] [PubMed] [Google Scholar]
- 45.Bottini N, Vang T, Cucca F, Mustelin T. Role of PTPN22 in type 1 diabetes and other autoimmune diseases. Semin. Immunol. 2006;18:207–213. doi: 10.1016/j.smim.2006.03.008. [DOI] [PubMed] [Google Scholar]
- 46.Cosulich ME, Rubartelli A, Risso A, Cozzolino F, Bargellesi A. Functional characterization of an antigen involved in an early step of T-cell activation. Proc. Natl. Acad. Sci. USA. 1987;84:4205–4209. doi: 10.1073/pnas.84.12.4205. [DOI] [PMC free article] [PubMed] [Google Scholar]
- 47.Moran AE, Holzapfel KL, Xing Y, Cunningham NR, Maltzman JS, Punt J, Hogquist KA. T cell receptor signal strength in Treg and iNKT cell development demonstrated by a novel fluorescent reporter mouse. J. Exp. Med. 2011;208:1279–1289. doi: 10.1084/jem.20110308. [DOI] [PMC free article] [PubMed] [Google Scholar]
- 48.Peavy RD, Metcalfe DD. Understanding the mechanisms of anaphylaxis. Curr. Opin. Allergy Clin Immunol. 2008;8:310–315. doi: 10.1097/ACI.0b013e3283036a90. [DOI] [PMC free article] [PubMed] [Google Scholar]
- 49.Bischoff SC. Role of mast cells in allergic and non-allergic immune responses: comparison of human and murine data. Nat. Rev. Immunol. 2007;7:93–104. doi: 10.1038/nri2018. [DOI] [PubMed] [Google Scholar]
- 50.Griffiths GM. Secretory lysosomes - a special mechanism of regulated secretion in haemopoietic cells. Trends Cell Biol. 1996;6:329–332. doi: 10.1016/0962-8924(96)20031-5. [DOI] [PubMed] [Google Scholar]
- 51.Obiri DD, Flink N, Maier JV, Neeb A, Maddalo D, Thiele W, Menon A, Stassen M, Kulkarni RA, Garabedian MJ, Barrios AM, Cato AC. PEST-domain-enriched tyrosine phosphatase and glucocorticoids as regulators of anaphylaxis in mice. Allergy. 2012;67:175–182. doi: 10.1111/j.1398-9995.2011.02731.x. [DOI] [PubMed] [Google Scholar]
- 52.Gilfillan AM, Metcalfe DD, Austin SJ. Mast cell biology: Introduction and overview. In: Gilfillan AM, Metcalfe DD, editors. Mast cell biology: Contemporary and emerging topics. Austin, TX: Landes Bioscience; 2011. pp. 2–13. [Google Scholar]
- 53.Schorpp M, Jager R, Schellander K, Schenkel J, Wagner EF, Weiher H, Angel P. The human ubiquitin C promoter directs high ubiquitous expression of transgenes in mice. Nucleic Acids Res. 1996;24:1787–1788. doi: 10.1093/nar/24.9.1787. [DOI] [PMC free article] [PubMed] [Google Scholar]
- 54.Spurg A, Waldvogel SR. High-Yielding Cleavage of (Aryloxy)acetates. Eur. J. Org. Chem. 2008;2008:337–342. [Google Scholar]
- 55.Minor W, Cymborowski M, Otwinowski Z, Chruszcz M. HKL-3000: the integration of data reduction and structure solution--from diffraction images to an initial model in minutes. Acta. Crystallogr. D. 2006;62:859–866. doi: 10.1107/S0907444906019949. [DOI] [PubMed] [Google Scholar]
- 56.Navaza J. AMoRe: an automated package for molecular replacement. Acta. Crystallogr. A. 1994;50:157–163. [Google Scholar]
- 57.Brünger AT, Adams PD, Clore GM, DeLano WL, Gros P, Grosse-Kunstleve RW, Jiang JS, Kuszewski J, Nilges M, Pannu NS, Read RJ, Rice LM, Simonson T, Warren GL. Crystallography & NMR system: a new software suite for macromolecular structure determination. Acta. Crystallogr. D. Biol. Crystallogr. 1998;54:905–921. doi: 10.1107/s0907444998003254. [DOI] [PubMed] [Google Scholar]
- 58.Brünger AT. Free R value: a novel statistical quantity for assessing the accuracy of crystal structures. Nature. 1992;355:472–475. doi: 10.1038/355472a0. [DOI] [PubMed] [Google Scholar]
- 59.Jones TA, Zou JY, Cowan SW, Kjeldgaard M. Improvedmethods for building protein models in electron density maps and the location of errors in these models. Acta. Crystallogr. A. 1991;47:110–119. doi: 10.1107/s0108767390010224. [DOI] [PubMed] [Google Scholar]
- 60.Shaw JP, Utz PJ, Durand DB, Toole JJ, Emmel EA, Crabtree GR. Identification of a putative regulator of early T cell activation genes. Science. 1988;241:202–205. [PubMed] [Google Scholar]
- 61.Kassel O, Sancono A, Krätzschmar J, Kreft B, Stassen M, Cato AC. Glucocorticoids inhibit MAP kinase via increased expression and decreased degradation of MKP-1. EMBO J. 2001;20:7108–7116. doi: 10.1093/emboj/20.24.7108. [DOI] [PMC free article] [PubMed] [Google Scholar]
- 62.Weiss A, Stobo JD. Requirement for the coexpression of T3 and the T cell antigen receptor on a malignant human T cell line. J. Exp. Med. 1984;160:1284–1299. doi: 10.1084/jem.160.5.1284. [DOI] [PMC free article] [PubMed] [Google Scholar]
- 63.Hasegawa K, Martin F, Huang G, Tumas D, Diehl L, Chan AC. PEST domain-enriched tyrosine phosphatase (PEP) regulation of effector/memory T cells. Science. 2004;303:685–689. doi: 10.1126/science.1092138. [DOI] [PubMed] [Google Scholar]
- 64.Maier JV, Brema S, Tuckermann J, Herzer U, Klein M, Stassen M, Moorthy A, Cato AC. Dual specificity phosphatase 1 knockout mice show enhanced susceptibility to anaphylaxis but are sensitive to glucocorticoids. Mol. Endocrinol. 2007;21:2663–2671. doi: 10.1210/me.2007-0067. [DOI] [PubMed] [Google Scholar]


