

Abstract
Nanopores can be used to analyse DNA by monitoring ion currents as individual strands are captured and driven through the pore in single file order by an applied voltage. Here we show that serial replication of individual DNA templates can be achieved by DNA polymerases held at the α-hemolysin nanopore orifice. Replication is blocked in the bulk phase, and is initiated only after the DNA is captured by the nanopore. We used this method, in concert with active voltage control, to observe DNA replication catalyzed by bacteriophage T7 DNA polymerase (T7DNAP) and by the Klenow fragment of DNA polymerase I (KF). T7DNAP advanced on a DNA template against an 80 mV load applied across the nanopore, and single nucleotide additions were measured on the millisecond time scale for hundreds of individual DNA molecules in series. Replication by KF was not observed when this enzyme was held atop the nanopore orifice at 80 mV applied potential. Sequential nucleotide additions by KF were observed upon controlled voltage reversals.
DNA polymerases catalyze template-directed DNA replication, advancing along template DNA by one nucleotide with each catalytic cycle. Nanopore analysis has emerged as a tool for studying these polymerases at the single-molecule level 1-5. Figure 1a illustrates a single (-hemolysin nanopore inserted in a lipid bilayer. When voltage is applied across the pore, capture of a polymerase-DNA complex results in a current blockade with a characteristic structure 1,3-5. Typical capture events for complexes between an A family DNA polymerase (the Klenow fragment of E. coli DNA polymerase I (KF)) and primer/template DNA substrates are shown in Figure 1b. The black current trace results from capture of a KF-DNA complex formed with a substrate composed solely of standard DNA residues; the charcoal current trace is for a KF-DNA complex formed with a substrate bearing a six consecuetive abasic (1′,2′-dideoxy) residues (Fig. 1c) in the template strand. The open channel current (Io) at 180 mV applied potential in buffer containing 0.3 M KCl is 60+/−2 pA. An initial current decrease upon capture of DNA in the enzyme bound state (EBS) occurs when the polymerase, which is too large to enter the pore vestibule, holds the duplex portion of the DNA substrate atop the pore (Fig. 1b,i; IEBS). The DNA template strand is suspended in the pore lumen, which is wide enough to accommodate single-stranded but not duplex DNA 6. The amplitude of this initial IEBS segment is augmented using DNA templates bearing abasic residues that are positioned to reside in the nanopore lumen when the DNAP complex is atop the pore 5. Upon voltage-promoted polymerase dissociation, the duplex DNA segment is drawn into the pore vestibule, which is just sufficiently wide to accommodate it 6, causing a further current decrease (Fig. 1b,ii; IDNA). Open channel current is restored following electrophoresis of the DNA through the pore (Fig. 1b,iii).
Figure 1. The nanopore device.
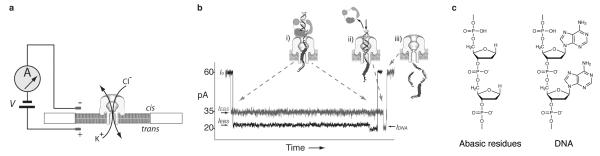
a, A patch-clamp amplifier supplies voltage and measures ionic current through a single α-hemolysin channel inserted in a ~30-μm diameter lipid bilayer. Current through the nanopore is carried by K+ and Cl− ions. b, Characteristic current blockade event structure for A family DNAP-DNA complexes captured in the nanopore. The black current trace corresponds to a KF-DNA complex formed with a substrate composed solely of standard DNA residues; the charcoal current trace is for a KF-DNA complex formed with a substrate bearing an insert of six consecutive abasic residues in the template strand. Cartoons i-iii illustrate the molecular events that correspond to each current level 1,5, with the abasic residues indicated as red circles. The initial longer blockade (i) is the enzyme bound state (IEBS) observed upon capture of a DNAP-DNA complex, with the duplex DNA held atop the pore vestibule by the polymerase. The amplitude of this initial segment is increased when abasic residues are positioned to reside in the nanopore lumen during the EBS 5. The shorter terminal step (IDNA; ii) occurs upon voltage-promoted DNAP dissociation, when the duplex DNA is drawn into the nanopore vestibule. Electrophoresis of the unbound DNA through the nanopore (iii) restores the open channel current (60+/−2 pA at 180 mV in buffer containing 0.3 M KCl). This event structure is observed for DNAP-DNA binary complexes and for DNAP-DNA-dNTP ternary complexes, with both KF and T7DNAP. Average EBS duration for DNA substrates bearing a 3′-H terminated primer is increased in the presence of correct dNTP in a concentration-dependent manner 3,5. c, Structure of abasic residues. A section of a strand bearing abasic (1′,2′-dideoxy) residues is compared to a section of a DNA strand, in which the nucleobases at the 1′ position are represented as unsubstituted purines.
Catalysis of DNA synthesis by polymerase complexes coupled to the nanopore would provide a means to control the rate and distance that DNA moves through the pore. Such control may be important for high-throughput nanopore DNA sequencing 7,8 and would permit examination of polymerase mechanics at higher bandwidth than can be attained with optical tweezers 9. Previous studies have employed α-hemolysin to measure binding properties of DNAP-DNA complexes under equilibrium 1,3,5 and pre-equilibrium 4 conditions. However, observation of DNA synthesis has been limited to experiments requiring sequential addition of substrates to the pore chamber. In these experiments only the covalent products of synthesis could be measured, either by direct detection of the DNA product 2, or by detection of enzyme complexes that reported the presence of the DNA product 5.
Thus, efficient use of nanopores to monitor DNA synthesis requires two advances: 1) a means to restrict synthesis to individual DNA substrate molecules captured in the nanopore; and 2) a means to accurately register and monitor DNA replication by polymerases adjacent to the nanopore orifice in real time. Here we report a strategy where individual DNA substrate molecules were rendered accessible for polymerase binding and catalysis only upon capture in the nanopore electric field. Replication was blocked in bulk phase. We used DNA tethering combined with active voltage control, in which finite state machine (FSM) logic is implemented on a field programmable gate array 4, to control the register of DNA templates in the nanopore at Angstrom precision on the millisecond time scale. We applied this method to measure DNA replication by bacteriophage T7 DNA polymerase (T7DNAP(exo-)) and KF(exo-) in real time on hundreds of substrate molecules in series.
Inhibition of DNA synthesis in bulk phase
We used modified DNA oligomers to block DNA polymerase binding at the primer/template junction of target substrates and thus inhibit DNA replication in bulk phase. Figure 2a,i shows a DNA primer/template substrate, highlighting the junction where the polymerase binds and initiates DNA synthesis (n=0). Blocking oligomers are diagrammed in Figure 2a,ii-v. These oligomers are designed to hybridize immediately adjacent to the 3′ end of a synthesis primer. They feature a seven nucleotide non-complementary tail at their 3′ ends intended to promote unzipping upon nanopore capture.
Figure 2. Blocking oligomer inhibition of DNAP-catalyzed DNA synthesis.

a, (i) DNA polymerase substrate consisting of a 79 mer template strand (tan and black) and a 23 mer primer strand (dark blue). The primer/template junction where DNA polymerase binds and initiates replication at the first unpaired base (n=0) and the single-stranded region of the template just beyond the 3′ end of the primer strand, are magnified. This region is the target for a series of oligonucleotides (ii-v) tested for their ability to inhibit DNA synthesis in the bulk phase bathing the nanopore. These oligomers (in red) are (ii) a standard DNA oligonucleotide complementary to 25 template nucleotides, extended on its 3′ end by 7 non-complementary cytosine residues; (iii) the oligonucleotide shown in (ii), with a single acridine residue, represented in yellow, at its 5′ terminus. This acridine replaces the nucleobase that participates in the terminal base pair of the fully base paired segment of (ii); (iv) the oligonucleotide shown in (ii), with its 5′ terminus extended by a single acridine overhang, represented in orange; and (v) the oligonucleotide shown in (ii), with two acridine residues at its 5′ terminus. In (v), one acridine residue, (yellow), replaces the nucleobase that participates in the terminal base pair of the fully base paired segment of (ii) and a second acridine residue (orange), is an overhang. b, Inhibition of T7DNAP-catalyzed primer extension. Denaturing gel electrophoresis showing the effect of the blocking oligomers shown in panel a, ii-v, on primer extension catalyzed by T7DNAP for 60 minutes under nanopore buffer conditions. The location of bands corresponding to the 5′-6-FAM primer, the +1 extension product, and the full-length extension product (+56) are indicated. Also indicated is the location of bands arising from the fluorescence of the acridine moieties of blocking oligomers iii-v. The presence of these bands in lanes for reactions conducted with (lanes 1, 3, 5) and without (lanes 2, 4, 6) enzyme confirms that they are not extension products. c, Inhibition of KF-catalyzed primer extension. Denaturing gel electrophoresis showing the effect of blocking oligomers iv and v shown in panel a on primer extension catalyzed by KF under nanopore buffer conditions in 60 minutes (left panel), or 10 and 20 minutes (right panel).
We tested the ability of blocking oligomers to inhibit DNA polymerase function in bulk phase using a primer extension assay. In this assay, the buffer conditions, DNA polymerase concentration, and DNA concentration were identical to those used for nanopore experiments. Absent blocking oligomer, T7DNAP catalyzed quantitative full-length extension of a 5′-fluorescein labeled 23 mer primer hybridized to a 79 mer DNA template (Fig. 2b, lane 10). An unmodified DNA oligomer (Fig. 2a,ii) did not significantly inhibit primer extension (Fig. 2b, lane 8) consistent with the nick binding and strand displacement activities of 3′ -5′ exonuclease deficient T7DNAP 10-13. To augment inhibition by the blocking oligomer, we reasoned that addition of an acridine residue at the 5′ end could distort DNA structure at the primer/template junction, yielding a structure at the nick that is difficult for the polymerase to recognize. When covalently linked to oligonucleotides and hybridized to a complementary sequence, acridine intercalates into duplex DNA, increasing the Tm of the duplex 14,15. We found that substitution of acridine for the 5′ dCMP residue of the blocking oligomer (Fig. 2a, blocking oligomer iii) measurably decreased full-length primer extension but supported detectable +1 addition (Fig. 2b, lane 6). Extension of the blocking oligomer duplex with a 5′ acridine overhang (Fig. 2a, blocking oligomer iv) was more effective, completely inhibiting full-length synthesis and most +1 addition (Fig. 2b, lane 4), even after incubation for 60 minutes. A di-acridine blocking oligomer that combined substitution of the 5′ terminal dCMP residue with the 5′ acridine overhang (Fig. 2a, blocking oligomer v) did not further inhibit T7DNAP catalysis and permitted slightly more +1 addition (Fig. 2b, lane 2) than the blocking oligomer with the single 5′-acridine overhang (Fig. 2b, lane 4).
Absent blocking oligomer, KF also catalyzed quantitative full-length primer extension under nanopore conditions (Fig. 2c, lanes 1, 8, 10), consistent with previous results 1. Primer extension by KF was inhibited less by oligomer iv (Fig. 2c, lane 3) than was primer extension by T7DNAP (Fig 2b, lane 4). The di-acridine blocking oligomer v (Fig. 2a,v) suppressed KF-catalyzed synthesis more effectively than blocking oligomer iv, although after 60 minutes reaction time, full-length extension product was detectable (Fig. 2c, lane 5). The full-length product accumulated slowly, and was below the limit of detection of our assay after 10 minutes reaction time (Fig. 2c, lane 9) and barely discernible after 20 minutes (Fig.2c, lane 7). As it did with T7DNAP, the di-acridine blocking oligomer v (Fig. 2a, v) permitted significant accumulation of the +1 addition product.
The nanopore reliably reports capture of polymerase-DNA complexes formed in bulk phase (Figs. 1b and 3a,b). We exploited this to independently test whether blocking oligomers inhibited polymerase binding to DNA. A primer/template DNA substrate with a 3′ H terminated primer was pre-annealed with the blocking oligomer bearing a single 5′ acridine overhang (Fig. 2a,iv) and added to the nanopore chamber along with T7DNAP. Events characteristic of unbound DNA capture (IDNA) were observed (Fig. 3c,d), but a plot of dwell time vs amplitude for tens of captured molecules (Fig. 3d) revealed almost no events with the IEBS level characteristic of polymerase binding that is shown in Figure 3a and 3b. This is consistent with efficient inhibition of T7DNAP-catalyzed primer extension by this blocking oligomer.
Figure 3. Blocking oligomer inhibition of bulk phase T7DNAP binding and voltage-promoted deprotection of individual DNA substrate molecules.

a, Characteristic current blockade event structure for T7DNAP-DNA complexes captured in the nanopore. Cartoons i-iii illustrate the molecular events that correspond to each current level (see Figure 1b for a detailed description). b, Dwell time vs. amplitude plot for an experiment in which hundreds of T7DNAP-DNA-dNTP ternary complexes were captured. In dwell time vs. amplitude plots in panels b, d , and f the IEBS segments of the polymerase-DNA events are represented as black dots, the lower amplitude, terminal portion of the polymerase-DNA events as blue dots, and unbound DNA events as red dots (for a description of how events were identified and quantified, see the Methods section). c, Representative current trace for events observed when the primer/template substrate used in panels a and b is pre-annealed with a blocking oligomer bearing a single acridine overhang at its 5′ terminus (Fig. 2a, iv). (i) The blocked DNA substrate is captured. The 7 nucleotide non-complementary 3′ tail is designed to promote blocking oligomer dissociation upon nanopore capture (ii-iii). In concert with blocking oligomer dissociation the primer/template junction is drawn into the pore vestibule (iii). Open channel current is restored (iv) upon electrophoresis of the DNA through the pore. d, Dwell time vs. amplitude plot for the experiment that produced the current trace in panel c. Numerous unbound IDNA events at 18 pA, but almost no 28 pA IEBS events, were observed. e, Voltage-promoted deprotection of individual DNA substrate molecules renders them accessible for T7DNAP binding. Lower case Roman numerals (i-vi) in the current trace correspond to the states depicted in the cartoons above. Upon capture (+160 mV) of a protected DNA substrate pre-annealed with the blocking oligomer (i), the 7-dC tail of the blocking oligomer is unzipped as the DNA substrate is driven into the pore, where the primer/template junction is protected from polymerase binding (ii). This state is detected by the FSM, voltage is reduced (+45 mV) and the template strand in the trans compartment can anneal to a tethering oligomer (iii). The potential is reversed (-20 mV) to drive the newly deprotected DNA primer/template into the cis compartment where it is exposed to T7DNAP and dGTP and can form a ternary complex (iv). The duration of this ‘fishing’ exposure can be precisely controlled and was 100 ms in the experiment shown. After the programed fishing exposure, voltage is again reversed (to +160 mV in the experiment shown), drawing the DNA substrate back to the nanopore orifice. In this ‘probing’ step, either unbound DNA (IDNA; v) or a T7DNAP-bound molecule is drawn back to the pore (IEBS; vi). Detection of IEBS indicates the blocking oligomer was removed and the DNA substrate was thus made accessible for polymerase binding. Detection of IDNA in (v), or of IDNA following voltage-promoted dissociation of the enzyme in (vi), prompts voltage reversal to −20 mV to fish again after a 2 ms delay. The fish and probe cycle is iterative until the DNA molecule is ejected, whereupon another can be captured. f, Dwell time vs. amplitude plot for hundreds of IEBS events measured in iterative fish and probe cycles for dozens of individually DNA substrate molecules captured and deprotected in series. Note that in this panel, the duration of the terminal portion of enzyme-bound events (after polymerase dissociation), represented by the blue dots, is truncated by the FSM logic, which upon recognition of this lower amplitude state in which the DNA duplex has dropped into the vestibule, commands a rapid voltage reversal.
Nanopore deprotection of individual DNA molecules
To monitor DNA replication at the nanopore, the blocking oligomer must be removed from each individual DNA substrate molecule upon nanopore capture to render it accessible for polymerase binding. Simultaneously, the dsDNA/ssDNA junction of the newly deprotected DNA substrate must be sequestered in the nanopore so that replication can be initiated subsequently under voltage control at sub-millisecond temporal resolution.
To achieve these two objectives, we designed the blocking oligomers to contain a seven nucleotide non-complementary 3′ tail (Fig. 2a, ii-v). Our logic was that charge repulsion between the 7 dC tail and proximal nucleotides of the DNA template strand would force the tail outward so that it would become wedged against the (-hemolysin outer surface upon DNA capture. As the template strand advanced into the nanopore under applied voltage, the poly dC tail would promote base-by-base unzipping of the blocking oligomer from the protected DNA substrate (Fig. 3e,i) and ensure tightly coupled delivery of the dsDNA/ssDNA junction into the pore vestibule (Fig. 3e,ii). Once inside the vestibule, the dsDNA/ssDNA junction would be protected from polymerases which are too large to enter.
The strategy we used to test this design is diagrammed in Figure 3e. Upon DNA capture (Fig. 3e,i-ii) a finite state machine (FSM) recognizes the IDNA state and instantaneously commands a voltage decrease. At this lower voltage (typically +45 mV trans-side) the DNA primer/template can be retained in the nanopore indefinitely which allows time to anneal a tethering oligomer in the trans chamber (Fig. 3e, iii). Once the DNA molecule is tethered, the membrane potential can be reversed, in a step termed ‘fishing’. This drives the dsDNA/ssDNA junction into the cis compartment (Fig. 3e,iv), where it can bind polymerase and dNTP (provided the blocking oligomer has been removed). The duration of this exposure to the bulk phase can be precisely controlled. For example, in the experiment in Figure 3e-f, the fishing exposures was set at 100 ms to allow ternary complex assembly to proceed to equilibrium. After each fishing interval, the voltage is again reversed, drawing the primer/template junction back to the nanopore. During this probing step, the FSM tests for an ionic current characteristic of unbound DNA (Fig. 3e,v), or a current characteristic of polymerase-bound DNA (Fig. 3e,vi). Detection of unbound DNA (either initially or upon polymerase dissociation) triggers the FSM to fish again. In contrast to the constant voltage capture measurements made in Figure 3a and 3d, this method of active voltage control allows repeated measurements to be made with each individual DNA molecule.
If the blocking oligomer was successfully removed upon nanopore capture (Fig. 3e,i), IEBS states should be detected in iterative fish/probe cycles. We found this to be the case. A current trace for a typical tethered DNA molecule (Fig. 3e, bottom) reveals IEBS values that correspond to polymerase-bound DNA when probed at 160 mV (Fig. 3e,vi). As predicted, at equilibrium these enzyme bound events were randomly interspersed among IDNA events (unbound DNA; Fig. 3e,v). A plot of dwell time vs. amplitude for hundreds of events obtained with dozens of DNA molecules captured in series confirmed an IEBS value at 28 pA (Fig. 3f) that was absent for protected DNA molecules without FSM-controlled activation (Fig. 3d). Thus, individual DNA substrate molecules that are inhibited from binding polymerase in bulk phase by blocking oligomers (Fig. 3c, d) can be deprotected and and made available for polymerase binding upon capture and voltage reversal (Fig. 3e,f).
As the blocking oligomer dissociates, it is evident that the newly exposed primer/template junction is protected in the pore vestibule. This is shown by the contrast between Figure 3c and d, where the initial capture required to remove the blocking oligomer occurs (Fig. 3c i,ii), but the deprotected primer terminus is never exposed to the cis chamber containing T7DNAP and dNTP, and Figure 3e and f, where controlled exposure is effected. Once the blocking oligomer is unzipped upon capture, re-exposure of the DNA molecule to the bulk phase is required to observe T7DNAP binding. This protection in the vestibule, in concert with blocking oligomer protection in the bulk phase, enables the use of DNA tethering and FSM logic to exert precise temporal control of exposure to enzyme and dNTP substrates for each captured DNA molecule.
Serial replication of individual DNA molecules
We exploited nanopore-capture mediated deprotection and active voltage control of individual DNA substrates to monitor DNA polymerase-catalyzed synthesis in real time. In the following text describing experiments with T7DNAP or KF, there are two possible scenarios wherein DNAP catalysis and the nanopore probing step may be coupled. In the first (Fig. 4a), the deprotected dsDNA/ssDNA junction of a tethered DNA substrate is exposed to DNAP in the cis chamber (Fig. 4a, i). During this fishing step, DNAP binding, nucleotide addition, and polymerase translocation relative to the DNA template (Fig. 4a ii-iv, respectively) occur while the complex is held away from the nanopore orifice by the applied potential (- trans-side voltage). When the applied voltage is reversed to probe the DNAP-DNA complex atop the nanopore orifice (+ trans-side voltage), the product of catalysis is detected (Fig. 4a, v); however, the catalytic cycle itself is not observed. In the second scenario (Fig. 4b), the probing step (+ trans-side voltage, Fig. 4a, iii) precedes catalysis and is sustained while elongation proceeds. Thus, DNA replication is observable in real time while the complex is held directly atop the nanopore orifice (Fig. 4b, iv-v).
Figure 4. Nucleotide addition may occur above the nanopore orifice (prior to the probing step) or at the nanopore orifice (during the probing step).

a, Nucleotide addition above the nanopore orifice prior to the probing step. i) The trans-side oligomer has been annealed following blocking oligomer removal. The trans-side voltage is negative driving the dsDNA/ssDNA junction into the cis compartment (fishing step). ii) During the fishing step, DNAP (ii) and cognate dNTP (iii) may sequentially bind. iv) This can lead to catalytic nucleotide addition and translocation of the DNA substrate relative to the DNAP prior to the probing step (v) when the voltage is reversed (trans-side +). In this scenario, the product of DNA catalysis is detected by the nanopore, but the catalytic cycle itself is not detected. b, Nucleotide addition at the nanopore orifice during the probing step. In this scenario, steps (i) and (ii) are the same as in scenario ‘a’. However, here the probing step (iii) precedes and then is sustained during catalytic turnover and translocation (iv-v). In this scenario, the catalysis is observed in process. The abbreviation ‘PPi’ refers to pyrophosphate.
T7DNAP experiments
Replication experiments with T7DNAP used the template shown in Figure 5a, hybridized to a 23 mer 3′-OH terminated primer and to a blocking oligomer with a 5′-acridine extension. When the unblocked primer/template junction of this substrate is exposed to T7DNAP, dATP, dGTP, dTTP, and ddCTP in the nanopore cis chamber, 10 nucleotide additions can be catalyzed. With each nucleotide addition, the 6 abasic insert in the template strand (Fig. 5a, red Xs) moves closer to the enzyme active site (Fig. 5c). When these polymerase-DNA complexes reside atop the nanopore, the abasic insert is drawn in 5 Å increments toward the region of the pore lumen that is most sensitive to strand composition, thus giving higher IEBS values (Fig. 5c; 5). Upon the addition of the tenth nucleotide, ddCTP (in response to the first G in the template; Fig. 5a, in blue), synthesis is terminated. This 3′-H-terminated primer strand then affords detection of a stable ternary complex due to the presence of the next correct incoming nucleotide (dTTP).
Figure 5. T7DNA replication of individual DNA substrate molecules deprotected and tethered in the nanopore.

a, Primer/template substrate used in T7DNAP replication experiments. The first G residue at position 33 of the template is shown in blue, and the six abasic residues are shown as red Xs. Sequences at the 5′ end of the template, which include the binding site for the tethering oligomer on the trans side of the nanopore, are not shown. b, Representative current trace for a captured molecule in which T7DNAP catalyzed the addition of 10 nucleotides. Following 55 sequential 10 ms fishing exposures and 80 mV probing steps, a progression through three detectable EBS amplitude levels (8.5, 10, and the 10.8 pA ternary complex) occurs (for an expanded illustration of this current trace, see Supplementary Movie 1 and Supplementary Figure 2). c, Position of the 6 abasic residue insert for the template shown in panel a, as T7DNAP atop the pore catalyzes single nucleotide additions that advance the template through the three detectable EBS amplitudes (panels b and d). Assignment of the 8.5, 10, 10.8 pA EBS levels to T7DNAP-DNA complexes in which the primer strand has been extended by eight, nine and ten nucleotides, respectively, was verified using chemically synthesized 3′-H terminated primers corresponding to these extension products that were hybridized to the template in ‘a’. The mean EBS amplitudes and standard deviations for these control complexes are indicated below each cartoon and were based on at least 15 events analyzed using Clampfit software. By comparison, DNA alone gave a current of 6.33±0.56 pA for the same conditions at 80 mV. d, Enlarged view of the region of the current trace in panel b that comprises the three amplitude levels. The red arrows indicate polymerase-catalyzed translocation of the DNA template in the pore as the enzyme advances on the template with each nucleotide addition cycle. Importantly, assignment of these three current values to template positions is rigorously supported by the unique templating G base at position +10 that ensures formation of only one ternary complex in this experiment.
Figure 5b shows a representative current trace from an experiment with 1 μM T7DNAP, 400 μM dATP, 400 μM dGTP, 400 μM dTTP, and 800 μM ddCTP present in the cis chamber (see also Supplementary Movie 1). In this experiment, the FSM commanded 10 ms fishing steps, each followed by an 80 mV probing step. After capture and tethering, this DNA molecule underwent 55 sequential 10 ms fishing exposures (from ~ 0.2 s to 1.0 s in Figure 5b). During this interval, eight nucleotides were added to the primer strand, but could not be observed (see below). In the probe step following the 56th exposure, a progression through three IEBS levels was observed ending at the 10.8 pA ternary complex. The three levels (expanded in Figure 5d) correspond to the following states and transitions illustrated in Figure 5c: 1) the complex at IEBS = 8.5 pA is T7DNAP bound to the DNA primer/template that has been extended by eight nucleotides during the prior fishing exposures. At this 8.5 pA step, the polymerase incorporates the next complementary nucleotide (dGTP); 2) following dGTP incorporation, the DNA advances one nucleotide position relative to both the polymerase and the nanopore (Fig. 5c,d, first arrow) which remain in direct contact due to the 80 mV load; 3) the resulting complex which remains held atop the pore at IEBS = 10 pA, then incorporates ddCTP (Fig. 5c) and the enzyme translocates again, giving rise to the 10.8 pA EBS state. The red arrows in Figure 5, b and d, mark T7DNAP-dependent translocation steps at the beginning and end of a single 17 ms catalytic cycle in which ddCTP was incorporated. In this typical experiment, the median duration of this nucleotide incorporation cycle, measured for 67 individual molecules, was 13 ms (Interquartile range (IQR) = 24 ms), which is predictably a few fold longer than dNTP incorporation by T7DNAP (3.3 ms determined in bulk phase under optimal buffer conditions 16).
T7DNAP catalyzed progression through three detectable IEBS levels for 9% of captured DNA molecules while held atop the nanopore (as depicted in the scenario in Figure 4b). Progression through two detectable levels (IEBS=10 pA, with a transition on the pore to IEBS =10.8 pA) occurred in 19% of captured molecules, corresponding to the catalytic addition of the tenth nucleotide (ddCTP) atop the pore. Approximately half of the captured molecules (48%) displayed a single 10.8 pA IEBS endpoint, indicating that all ten nucleotides (including dGTP and ddCTP at the last two positions) had been incorporated in the bulk phase during the iterative fishing intervals (as depicted in the scenario in Figure 4a). The remaining 24% of captured DNA molecules did not reach an IEBS state; we surmise that in many cases this was because the blocking oligomer had not dissociated from these substrates.
Despite frequent occurrence of two or three sequential IEBS levels that culminate in the ternary complex endpoint, IEBS levels corresponding to the eight preceding nucleotide additions were rarely detected. This is likely due to two factors in tandem: 1) during the initial nucleotide addition cycles with this template, the abasic block is several Angstrom from the most sensitive pore constriction at lysine 147 of α-hemolysin6 and therefore cannot afford robust discrimination between IEBS and IDNA5;and 2) in each nucleotide addition cycle, replicating complexes pass through the polymerase-DNA binary state, during which they are susceptible to voltage-promoted dissociation 3. For T7DNAP, binary complex lability is exacerbated by the 300 mM KCl concentration under which the nanopore experiments were conducted17.
KF experiments
Bulk phase measurements indicate that KF-DNA binary complexes are more stable than T7-DNA binary complexes 18,17 at elevated monovalent salt concentrations. We therefore predicted that IEBS levels that were difficult to discern on the nanopore using T7DNAP in 300 mM KCl could be resolved using KF.
To examine KF-catalyzed DNA replication on the nanopore, we used a di-acridine blocking oligomer (Fig. 2a,v) hybridized to the primer/template DNA shown in Figure 6a. This substrate is similar to the one used with T7DNAP (Fig. 5a), but differs in the position of the six abasic block thus affording a greater dynamic current range. When the unblocked primer/template junction of this substrate is exposed to KF, dATP, dGTP, dTTP, and ddCTP in the nanopore cis chamber, 12 nucleotide additions can be catalyzed. We determined the IEBS levels at 80 mV for states corresponding to the product of each nucleotide addition on this template by forming ternary complexes using synthetic primer/template substrates corresponding to each single-nucleotide addition. The resulting map predicts that catalytic addition of each nucleotide will draw the six abasic reporter (red X’s, Fig. 6a) up to and then through the nanopore lumen (Fig. 6b). This will cause a sequential rise in IEBS followed by a sequential decrease in IEBS until synthesis is terminated at the ddCTP incorporation step (Fig. 6c).
Figure 6. KF replication of individual DNA substrate molecules deprotected and tethered in the nanopore.

a, Primer/template substrate used in KF replication experiments. The first G residue at position 35 of the template is shown in blue, and the six abasic residues are shown as red Xs. Sequences at the 5′ end of the template, which include the binding site for the tethering oligomer on the trans side of the nanopore, are not shown. We note that the distance from position n=0 to the abasic insert is 19nt for this template compared to 23nt for the template in Figure 5. Thus the number of base additions needed to bring the abasic insert to the limiting pore constriction (lysine 147 of α-hemolysin6) differs. That is, +8 nt in Figure 5 places the abasic insert 14-to-19 nt from the catalytic site giving a current of 8.5 pA; the corresponding position here in Figure 6 is +4nt which places the abasic insert 14- to-19 nt from the catalytic site giving a current of 8.1 pA. b, Cartoons depicting the position of the 6 abasic residue insert in the template shown in panel a, as it is drawn in single nucleotide (5 Å) increments by the KF molecule atop the pore during replication of the template. The IEBS values were measured at 80 mV for each of these complexes by capturing ternary complexes formed with a series of synthetic primer/template substrates corresponding to each single-nucleotide addition to the substrate shown in panel a. The mean amplitude and standard deviation from these experiments is indicated below each cartoon. Each of these values was estimated by measuring the mean amplitude of at least 20 events using Clampfit software and then calculating the mean and standard deviation of those measurements. c, EBS amplitude map at 80 mV for the KF-DNA-dNTP ternary complexes illustrated in panel b. The dashed line indicates IDNA at 80 mV which was 6.61±0.64 pA. d, Representative current trace for a captured molecule in which KF catalyzed the addition of 11 nucleotides (for an expanded illustration of this current trace, see Supplementary Figure 3).
A current trace showing KF replication of a single captured DNA template is illustrated in Figure 6d. This trace is typical of numerous DNA templates that were captured, deprotected, and replicated at the nanopore in single file order in real time (Supplementary Movie 2). We limited our analysis of KF replication to the first ten minutes after the addition of enzyme, a period in which the di-acridine blocking oligomer efficiently inhibited bulk phase primer extension (Fig. 2c, lane 9). For most molecules, seven out of twelve possible nucleotide additions were distinguishable (in the order predicted by the amplitude map in Fig. 6c). Positions iii, iv, and v were often not observed. This is likely due to proximity of the IEBS for each of these complexes to baseline IDNA in tandem with lower stability of the KF/DNA complex at that template position (see Supplementary note to Figure 6). Amplitudes corresponding to positions viii-x were consistently observed, but they could not be unambiguously distinguished from one another because of their nearly identical IEBS values.
This progression through a sequential rise in IEBS followed by a sequential decrease in IEBS was also observed when replication of the template in Figure 6a was assayed using T7DNAP (Supplementary Fig. 1). With this polymerase, elongation proceeded rapidly in complexes held atop the nanopore during the 80 mV probing steps, as depicted in the scenario of Figure 4b. Occasionally, individual T7DNAP complexes exhibited ~ seven discrete steps (Supplementary Fig. 1) and traversed the amplitude peak shown in the map in Figure 6c.
We note that in contrast with T7DNAP, which often elongated against an 80 mV load (Fig. 5; Supplementary Movie 1; Supplementary Fig. 1), KF did not advance during the probing step when an 80 mV positive trans-side potential held the KF-DNA complex against the pore orifice (Fig. 6d; Supplementary Movie 2; illustrations in Fig. 4). Nonetheless, KF readily catalyzed nucleotide addition during the 10 ms fishing intervals, when the dsDNA/ssDNA junction was driven away from the pore orifice at negative trans-side potential, as depicted in the scenario of Figure 4a. Therefore, sequential nucleotide additions by KF could be controlled by voltage reversal. This difference in behavior of these two A family polymerases may stem from properties related to their different functional roles in vivo, where T7DNAP is a highly processive replicative enzyme, and KF is a less processive repair enzyme19.
Inspection of the IEBS levels attained at the end of elongation on individual molecules reveals another difference in the behavior of KF and T7DNAP (Figs. 5, 6, and Supplementary Fig. 1). For the experimental conditions shown in Figure 6, KF-driven elongation stalled at IEBS = 10.8 pA (position xii in Figure 6d) and rarely proceeded to IEBS = 7.7 pA (position xiii), even after repeated 10 ms fishing exposures. We reasoned that this occurred because, in order to halt elongation after the first templating G residue, these reactions were conducted in the presence of ddCTP, rather than dCTP. Thus progression to position xiii required catalytic incorporation of ddCTP. KF discriminates against complementary ddNTP incorporation by ~ 1000-fold relative to complementary dNTP incorporation 20. Consistent with this hypothesis, subsequent addition of 400 uM dCTP to the cis compartment allowed elongation to proceed to IEBS = 7.7 pA for nearly all measured molecules (data not shown). By comparison, T7DNAP discriminates against complementary ddNTPs by less than ten-fold relative to complementary dNTPs21. Therefore primer elongation proceeded rapidly through the ddCTP incorporation step when T7DNAP replicated DNA at the nanopore orifice (Fig. 5).
Conclusions
The α-hemolysin nanopore is well-suited for the single molecule study of DNA processing enzymes. This is in part due to the pore dimensions, which permit movement and detection of individual DNA templates in single file nucleotide order past a ~1.5 nm limiting aperture. It is also because serial passage of thousands of DNA templates can be observed in each experiment at 5-10 kHz bandwidth7,22,23.
Here we reported a strategy that extends this technology to measurement of DNA replication in real time on the nanopore. Hundreds of DNA templates were captured in series without the need for sequential substrate additions. This strategy links three technical advances: 1) inhibition of DNA replication in bulk phase using blocking oligomers when all of the components required for catalysis are present; 2) voltage-promoted deprotection of individual DNA molecules upon nanopore capture; and 3) precise control of the exposure of the dsDNA/ssDNA junction of each captured DNA template to DNA polymerases.
We are exploring the use of other DNA polymerases to improve signal detection and the ability to retain replicating complexes on the nanopore. In concert with this, we are working to improve blocking oligomer design to achieve both quantitative blocking oligomer dissociation upon nanopore capture and quantitative inhibition of DNA polymerases that have more robust strand displacement activity than do T7DNAP and KF.
Methods
Materials
α-hemolysin heptamers were a gift from Oxford Nanopore Technologies. Diphytanoyl-phosphatidylcholine (DPyPC) was purchased from Avanti Polar Lipids. T7DNAP(exo-) (45 Units/μl) was purchased from USB, and KF(exo-) (100 Units/μl) was from New England BioLabs. DNA polymerases used throughout this study were engineered to be exonuclease deficient. DNA oligonucleotides were synthesized at the Stanford University School of Medicine PAN Facility, purified by denaturing PAGE, and quantified by absorbance at 260 nM. Oligoucleotides bearing acridine residues were quantified based on their absorbance at 424 nm 14. Fluorescein modified oligonucleotides were quantified by measuring their absorbance at 260 nM and using the OligoCalc program (http://www.basic.northwestern.edu/biotools/oligocalc.html; 24). DNA hybrids were formed by heating a 1:1 molar ratio of primer and template, with or without a 1.2 molar excess of blocking oligomer, at 90 °C, followed by slow cooling to room temperature.
The DNA sequences of the templates used in nanopore DNA replication experiments are shown in Figures 5a and 6a. Sequences for the other oligonucleotides used in this study are:
23 mer 3′-OH synthesis primer: 5′ -GGCTACGACCTGCATGAGAATGC- 3′
23 mer 3′-H primer: 5′ -GGCTACGACCTGCATGAGAATGddC- 3′
5′-6-FAM 3′-OH synthesis primer: 5′-6-FAM -GGCTACGACCTGCATGAGAATGC- 3′
Template used in the experiments shown in Figure 2, with abasic residues (1′,2′-dideoxy) indicated as X:
5′ -CTCACCTATCCTTCCACTCATTCCAATTAATTACCATTCATXXXGATCTCACTA TCGCATTCTCATGCAGGTCGTAGCC- 3′
Blocking oligomers used in Figures 2 and 3, with acridine residues indicated as Z:
ii) 5′ -GATAGTGAGATCTGAATGAATGGTACCCCCCC - 3′
iii) 5′ -ZATAGTGAGATCTGAATGAATGGTACCCCCCC - 3′
iv) 5′ -ZGATAGTGAGATCTGAATGAATGGTACCCCCCC - 3′
v) 5′ -ZZATAGTGAGATCTGAATGAATGGTACCCCCCC - 3′
Blocking oligomer used in Figure 5:
5′ -ZGATAGTGAGCTCTGAATGAATGCCCCCCC - 3′
Blocking oligomer used in Figure 6:
5′ - ZZATAGTGAGATCTGAATGAATGGTACCCCCCC - 3′
Nanopore experiments
General nanopore methods were as described 1,5,4. Briefly, for each experiment an individual α-hemolysin nanopore was inserted into a ca. 30 ⌈m-diameter DPyPC/hexadecane horizontal bilayer that formed a high resistance barrier between two ca. 100 ⌈L baths. Voltage was applied across the nanopore between AgCl pellets immersed in the baths and connected to an Axopatch 200B amplifier. The analog signal was filtered at 5-10 kHz using a low pass Bessel filter and digitized at 50-100 kHz.
Experiments were conducted at 23 ± 0.2 °C in buffer containing 10 mM K-Hepes pH 8.0 and 0.3 M KCl. For experiments with KF, 5 mM MgCl2 was added to the nanopore cis chamber prior to the addition of 1 μM KF; for experiments with T7DNAP, E. coli thioredoxin (13 mM), DTT (7 mM), and MgCl2 (5 mM) were added prior to addition of 1 μM T7DNAP. Nanopore experiments measuring ternary complex capture (Fig. 3a, b), inhibition of ternary complex formation (Fig. 3c, d), and nanopore capture-dependent activation of ternary complex formation (Fig. 3e, f) were conducted with 400 μM dGTP (complementary to n=0) in the nanopore cis chamber. DNA synthesis reactions (Fig. 4) were conducted with 400 μM each of dATP, dGTP, dTTP, and 800 μM ddCTP in the cis chamber. In control experiments, synthesis was dependent upon the presence of nucleotide substrates.
Active voltage control logic was implemented as a finite state machine (FSM), programmed with LabVIEW software (Version 8, National Instruments, Austin, TX) and implemented on an FPGA system (PCI-7831R, National Instruments) as previously described 4. The FPGA was connected to an Axopatch 200B and programmed for transmembrane voltage control and ionic current measurements using 5.3 μs updates. To improve the signal-to-noise ratio, the ionic current signal was filtered on the FPGA using a single-pole low pass filter with a 1.58 kHz cutoff frequency and a 10%-90% risetime of ~0.2 ms. In a typical experiment, the FSM started at a 160 mV capture state. As soon as the capture of a DNA molecule was detected by a current reduction, the FSM transitioned to 45 mV to allow the DNA to anneal with a complementary tethering strand on the trans side of the pore. After annealing, the FSM transitioned to a −20mV “fishing” state, allowing formation of DNA-enzyme complexes in the cis chamber. This fishing voltage was maintained for a defined interval (usually 10 ms) and the voltage was subsequently inverted to a positive value (80 mV), to probe for molecular complexes. We introduced a 3 ms delay at the start of the probing state in order for the capacitive transient to settle. The FSM kept the probing voltage until it detected that the low-pass filtered current remained for 2 ms within a range of the amplitude for unbound DNA. At this point, the FSM returned to the fishing state and the cycle was repeated until detection of the open channel current caused the FSM to transition to the initial capture state.
Current blockade events were identified using MATLAB (2007a, The MathWorks, Natick, MA) and software developed in our laboratory 4,5. A capture event was identified when the current level dropped from the open channel current by at least 3 pA for at least 0.2 ms. To quantify the EBS and terminal steps of individual events, a baseline amplitude was calculated as the mean of the first 0.2 ms of the event amplitude. A threshold value for a downward deviation from the baseline amplitude was determined for the terminal step of events by visual inspection of the current traces. Events that ended with a segment below this threshold were identified by the software as having a terminal step. Dwell time and mean amplitude for the EBS and terminal step segments were separately measured. In dwell time vs. amplitude plots generated from this analysis (Fig. 3b, 3d, and 3f), black dots represent the extracted EBS segment of events, and blue dots represent the extracted lower amplitude terminal segment of those events. The red dots represent events that have only the lower amplitude level throughout their duration (DNA molecules that were captured unbound by polymerase).
Primer extension assays
A primer/template substrate bearing a 5′-6-FAM primer was hybridized with or without a blocking oligomer. Primer extension reactions with T7DNAP or KF were conducted for 60 minutes under the conditions described above for nanopore experiments. Reactions were terminated by the addition of buffer-saturated phenol to ensure that blocking oligomers did not dissociate from DNA templates prior to polymerase denaturation. Following extraction and ethanol precipitation, reaction products were dissolved in 7M urea, 0.1X TBE and resolved by electrophoresis on gels containing 17% acrylamide:bisacrylamide (19:1), 7M urea, 1X TBE. Extension products were visualized on a UVP Gel Documentation system using a Sybr Gold filter. Band intensities were quantified using ImageJ software (NIH).
Supplementary Material
Acknowledgements
We are grateful to Peter Walker at Stanford University PAN for expert oligonucleotide synthesis, Yvette Kolodji for help with data analysis, Brett Gyarfas for making the Supplementary movies and for assistance with FSM implementation, Daniel Garalde for advice on the use of T7DNAP, and Warren Kibbe (Northwestern University) for modifications to OligoCalc. This work was supported by grants from Oxford Nanopore Technologies and from NHGRI (1RC2HG005553-01) to M.A and D.D.
Footnotes
Author Contributions. F.O. designed experiments and performed data analysis; K.R.L. co-authored the manuscript, designed and conducted experiments; S.B., G.M.C., and J.M.D. conducted nanopore experiments including FSM implementation; D.W.D. conceived the idea of coupling polymerases to nanopores and helped design experiments; M.A. co-authored the manuscript, conceived the blocking oligomer strategy, designed experiments, and is responsible for the overall quality of the work.
Competing Financial Interests. M. Akeson and D. Deamer are consultants to Oxford Nanopore Technologies (Oxford, England). Oxford Nanopore Technologies has licensed rights to some of the inventions detailed in this manuscript and has sponsored some of the research presented here through a grant to the University of California.
Additional Information Supplementary information accompanies this paper at www.nature.com/naturenanotechnology.
Reprints and permission information is available online at http://npg.nature.com/reprintsandpermissions/.
References
- 1.Benner S, et al. Sequence-specific detection of individual DNA polymerase complexes in real time using a nanopore. Nat Nanotechnol. 2007;2:718–724. doi: 10.1038/nnano.2007.344. [DOI] [PMC free article] [PubMed] [Google Scholar]
- 2.Cockroft SL, Chu J, Amorin M, Ghadiri MR. A single-molecule nanopore device detects DNA polymerase activity with single-nucleotide resolution. J Am Chem Soc. 2008;130:818–820. doi: 10.1021/ja077082c. [DOI] [PMC free article] [PubMed] [Google Scholar]
- 3.Hurt N, Wang H, Akeson M, Lieberman KR. Specific nucleotide binding and rebinding to individual DNA polymerase complexes captured on a nanopore. J Am Chem Soc. 2009;131:3772–3778. doi: 10.1021/ja809663f. [DOI] [PMC free article] [PubMed] [Google Scholar]
- 4.Wilson NA, et al. Electronic control of DNA polymerase binding and unbinding to single DNA molecules. ACS Nano. 2009;3:995–1003. doi: 10.1021/nn9000897. [DOI] [PMC free article] [PubMed] [Google Scholar]
- 5.Gyarfas B, et al. Mapping the Position of DNA Polymerase-Bound DNA Templates in a Nanopore at 5 A Resolution. ACS Nano. 2009;3:1457–1466. doi: 10.1021/nn900303g. [DOI] [PubMed] [Google Scholar]
- 6.Song L, et al. Structure of staphylococcal alpha-hemolysin, a heptameric transmembrane pore. Science. 1996;274:1859–1866. doi: 10.1126/science.274.5294.1859. [DOI] [PubMed] [Google Scholar]
- 7.Kasianowicz JJ, Brandin E, Branton D, Deamer DW. Characterization of individual polynucleotide molecules using a membrane channel. Proc Natl Acad Sci U S A. 1996;93:13770–13773. doi: 10.1073/pnas.93.24.13770. [DOI] [PMC free article] [PubMed] [Google Scholar]
- 8.Branton D, et al. The potential and challenges of nanopore sequencing. Nat Biotechnol. 2008;26:1146–1153. doi: 10.1038/nbt.1495. [DOI] [PMC free article] [PubMed] [Google Scholar]
- 9.Moffitt JR, Chemla YR, Smith SB, Bustamante C. Recent advances in optical tweezers. Annu Rev Biochem. 2008;77:205–228. doi: 10.1146/annurev.biochem.77.043007.090225. [DOI] [PubMed] [Google Scholar]
- 10.Lechner RL, Engler MJ, Richardson CC. Characterization of strand displacement synthesis catalyzed by bacteriophage T7 DNA polymerase. J Biol Chem. 1983;258:11174–11184. [PubMed] [Google Scholar]
- 11.Lechner RL, Richardson CC. A preformed, topologically stable replication fork. Characterization of leading strand DNA synthesis catalyzed by T7 DNA polymerase and T7 gene 4 protein. J Biol Chem. 1983;258:11185–11196. [PubMed] [Google Scholar]
- 12.Tabor S, Richardson CC. Selective inactivation of the exonuclease activity of bacteriophage T7 DNA polymerase by in vitro mutagenesis. J Biol Chem. 1989;264:6447–6458. [PubMed] [Google Scholar]
- 13.Canceill D, Viguera E, Ehrlich SD. Replication slippage of different DNA polymerases is inversely related to their strand displacement efficiency. J Biol Chem. 1999;274:27481–27490. doi: 10.1074/jbc.274.39.27481. [DOI] [PubMed] [Google Scholar]
- 14.Asseline U, et al. Nucleic acid-binding molecules with high affinity and base sequence specificity: intercalating agents covalently linked to oligodeoxynucleotides. Proc Natl Acad Sci U S A. 1984;81:3297–3301. doi: 10.1073/pnas.81.11.3297. [DOI] [PMC free article] [PubMed] [Google Scholar]
- 15.Asseline U, Bonfils E, Dupret D, Thuong NT. Synthesis and binding properties of oligonucleotides covalently linked to an acridine derivative: new study of the influence of the dye attachment site. Bioconjug Chem. 1996;7:369–379. doi: 10.1021/bc960024o. [DOI] [PubMed] [Google Scholar]
- 16.Patel SS, Wong I, Johnson KA. Pre-steady-state kinetic analysis of processive DNA replication including complete characterization of an exonuclease-deficient mutant. Biochemistry. 1991;30:511–525. doi: 10.1021/bi00216a029. [DOI] [PubMed] [Google Scholar]
- 17.Huber HE, Tabor S, Richardson CC. Escherichia coli thioredoxin stabilizes complexes of bacteriophage T7 DNA polymerase and primed templates. J Biol Chem. 1987;262:16224–16232. [PubMed] [Google Scholar]
- 18.Datta K, LiCata VJ. Salt dependence of DNA binding by Thermus aquaticus and Escherichia coli DNA polymerases. J Biol Chem. 2003;278:5694–5701. doi: 10.1074/jbc.M208133200. [DOI] [PubMed] [Google Scholar]
- 19.Rothwell PJ, Waksman G. Structure and mechanism of DNA polymerases. Adv Protein Chem. 2005;71:401–440. doi: 10.1016/S0065-3233(04)71011-6. [DOI] [PubMed] [Google Scholar]
- 20.Astatke M, Grindley ND, Joyce CM. How E. coli DNA polymerase I (Klenow fragment) distinguishes between deoxy- and dideoxynucleotides. J Mol Biol. 1998;278:147–165. doi: 10.1006/jmbi.1998.1672. [DOI] [PubMed] [Google Scholar]
- 21.Tabor S, Richardson CC. A single residue in DNA polymerases of the Escherichia coli DNA polymerase I family is critical for distinguishing between deoxy- and dideoxyribonucleotides. Proc Natl Acad Sci U S A. 1995;92:6339–6343. doi: 10.1073/pnas.92.14.6339. [DOI] [PMC free article] [PubMed] [Google Scholar]
- 22.Akeson M, Branton D, Kasianowicz JJ, Brandin E, Deamer DW. Microsecond time-scale discrimination among polycytidylic acid, polyadenylic acid, and polyuridylic acid as homopolymers or as segments within single RNA molecules. Biophys J. 1999;77:3227–3233. doi: 10.1016/S0006-3495(99)77153-5. [DOI] [PMC free article] [PubMed] [Google Scholar]
- 23.Meller A, Nivon L, Brandin E, Golovchenko J, Branton D. Rapid nanopore discrimination between single polynucleotide molecules. Proc Natl Acad Sci U S A. 2000;97:1079–1084. doi: 10.1073/pnas.97.3.1079. [DOI] [PMC free article] [PubMed] [Google Scholar]
- 24.Kibbe WA. OligoCalc: an online oligonucleotide properties calculator. Nucleic Acids Res. 2007;35:W43–W46. doi: 10.1093/nar/gkm234. [DOI] [PMC free article] [PubMed] [Google Scholar]
Associated Data
This section collects any data citations, data availability statements, or supplementary materials included in this article.