

Abstract
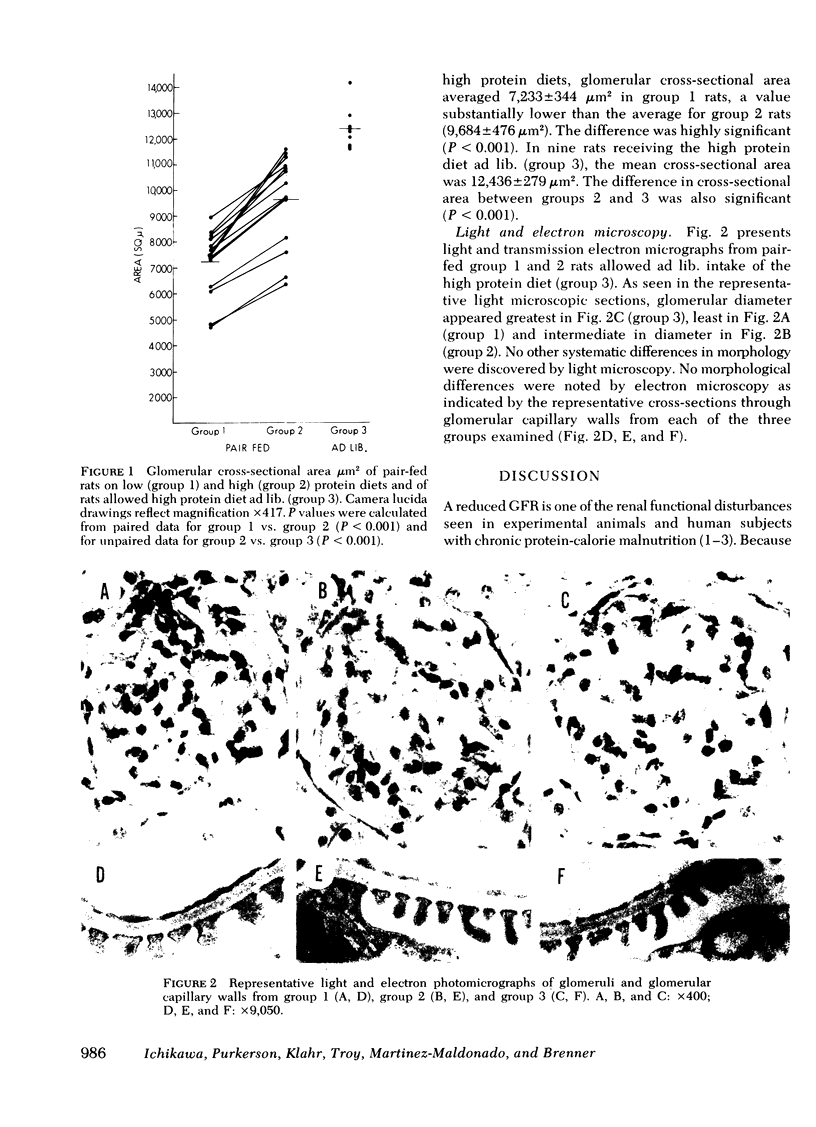
To determine the physiological basis for the low glomerular filtration rate in chronic malnutrition, micropuncture studies were performed in Munich-Wistar rats chronically pair-fed isocaloric diets of either low (group 1, nine rats) or high protein content (group 2, nine rats). Despite the absence of hypoalbuminemia, average values for single nephron and total kidney glomerular filtration rate were nearly 35% lower in group 1 than in group 2. Mean values for glomerular capillary and Bowman's space hydraulic pressures were essentially identical in the two groups, thereby excluding glomerular transcapillary hydraulic pressure difference as the cause for the low filtration rates in group 1 animals. On the other hand, average glomerular capillary plasma flow rate and glomerular capillary ultrafiltration coefficient were significantly lower (by ∼25 and ∼50%, respectively) in group 1 than in group 2. The fall in glomerular capillary plasma flow rate was the consequence of increased afferent and efferent arteriolar resistances. Plasma and erythrocyte volumes were found to be equal in five additional pairs of group 1 and group 2 rats. Thus, the substantial alterations in the ultrafiltration coefficient, glomerular capillary plasma flow rate, and renal arteriolar resistances responsible for the low filtration rate in group 1 animals were not merely a consequence of decreased circulating blood or plasma volumes. Mean values for glomerular cross sectional area were significantly lower in group 1 than in group 2 despite similar values for kidney weight in the two groups. This reduction in glomerular cross sectional area in group 1 rats is presumed to reflect a decrease in effective filtration surface area and therefore likely accounts, at least in part, for the decline in ultrafiltration coefficient observed in this group.
Finally, since the daily caloric intake of group 2 animals was restricted because of pair feeding requirements tied to the group 1 rats, we studied a third group of seven rats (group 3) allowed an ad lib. intake of the same high protein diet as given to group 2 rats. Average values for single nephron glomerular filtration rate and its determinants were found to be indistinguishable between groups 2 and 3. These results suggest that low protein intake, rather than calorie deficiency per se, is primarily responsible for the reduction in filtration rate seen in this experimental model of chronic malnutrition.
Full text
PDF
Images in this article
Selected References
These references are in PubMed. This may not be the complete list of references from this article.
- Alleyne G. A. The effect of severe protein calorie malnutrition on the renal function of Jamaican children. Pediatrics. 1967 Mar;39(3):400–411. [PubMed] [Google Scholar]
- Blantz R. C., Konnen K. S., Tucker B. J. Angiotensin II effects upon the glomerular microcirculation and ultrafiltration coefficient of the rat. J Clin Invest. 1976 Feb;57(2):419–434. doi: 10.1172/JCI108293. [DOI] [PMC free article] [PubMed] [Google Scholar]
- Brenner B. M., Falchuk K. H., Keimowitz R. I., Berliner R. W. The relationship between peritubular capillary protein concentration and fluid reabsorption by the renal proximal tubule. J Clin Invest. 1969 Aug;48(8):1519–1531. doi: 10.1172/JCI106118. [DOI] [PMC free article] [PubMed] [Google Scholar]
- CRISPELL K. R., PORTER B., NIESET R. T. Studies of plasma volume using human serum albumin tagged with radioactive iodine. J Clin Invest. 1950 May;29(5):513–516. doi: 10.1172/JCI102288. [DOI] [PMC free article] [PubMed] [Google Scholar]
- Cowan W. M., Wann D. F. A computer system for the measurement of cell and nuclear sizes. J Microsc. 1973 Dec;99(3):331–348. doi: 10.1111/j.1365-2818.1973.tb04630.x. [DOI] [PubMed] [Google Scholar]
- FUHR J., KACZMARCZYK J., KRUTTGEN C. D. Eine einfache colorimetrische Methode zur Inulinbestimmung für Nieren-Clearance-Untersuchungen bei Stoffwechselgesunden und Diabetikern. Klin Wochenschr. 1955 Aug 1;33(29-30):729–730. doi: 10.1007/BF01473295. [DOI] [PubMed] [Google Scholar]
- Hall J. E., Guyton A. C., Jackson T. E., Coleman T. G., Lohmeier T. E., Trippodo N. C. Control of glomerular filtration rate by renin-angiotensin system. Am J Physiol. 1977 Nov;233(5):F366–F372. doi: 10.1152/ajprenal.1977.233.5.F366. [DOI] [PubMed] [Google Scholar]
- JAENIKE J. R., SCHREINER B. F., Jr, WATERHOUSE C. The relative volumes of distribution of I131-tagged albumin and high molecular weight dextran in normal subjects and patients with heart disease. J Lab Clin Med. 1957 Feb;49(2):172–181. [PubMed] [Google Scholar]
- Klahr S., Alleyne G. A. Effects of chronic protein-calorie malnutrition on the kidney. Kidney Int. 1973 Mar;3(3):129–141. doi: 10.1038/ki.1973.21. [DOI] [PubMed] [Google Scholar]
- Klahr S., Tripathy K. Evaluation of renal function in malnutrition. Arch Intern Med. 1966 Oct;118(4):322–325. [PubMed] [Google Scholar]
- Kritzinger E. E., Kanengoni E., Jones J. J. Effective renin activity in plasma of children with kwashiorkor. Lancet. 1972 Feb 19;1(7747):412–413. doi: 10.1016/s0140-6736(72)90859-8. [DOI] [PubMed] [Google Scholar]
- Maddox D. A., Price D. C., Rector F. C., Jr Effects of surgery on plasma volume and salt and water excretion in rats. Am J Physiol. 1977 Dec;233(6):F600–F606. doi: 10.1152/ajprenal.1977.233.6.F600. [DOI] [PubMed] [Google Scholar]
- STERLING K., GRAY S. J. Determination of the circulating red cell volume in man by radioactive chromium. J Clin Invest. 1950 Dec;29(12):1614–1619. doi: 10.1172/JCI102404. [DOI] [PMC free article] [PubMed] [Google Scholar]
- Viets J. W., Deen W. M., Troy J. L., Brenner B. M. Determination of serum protein concentration in nanoliter blood samples using fluorescamine or 9-phthalaldehyde. Anal Biochem. 1978 Aug 1;88(2):513–521. doi: 10.1016/0003-2697(78)90451-7. [DOI] [PubMed] [Google Scholar]