

Abstract
Human ether-á-gogo-related gene (HERG) encodes a potassium channel that is highly susceptible to deleterious mutations resulting in susceptibility to fatal cardiac arrhythmias. Most mutations adversely affect HERG channel assembly and trafficking. Why the channel is so vulnerable to missense mutations is not well understood. Since nothing is known of how mRNA structural elements factor in channel processing, we synthesized a codon-modified HERG cDNA (HERG-CM) where the codons were synonymously changed to reduce GC content, secondary structure, and rare codon usage. HERG-CM produced typical IKr-like currents; however, channel synthesis and processing were markedly different. Translation efficiency was reduced for HERG-CM, as determined by heterologous expression, in vitro translation, and polysomal profiling. Trafficking efficiency to the cell surface was greatly enhanced, as assayed by immunofluorescence, subcellular fractionation, and surface labeling. Chimeras of HERG-NT/CM indicated that trafficking efficiency was largely dependent on 5′ sequences, while translation efficiency involved multiple areas. These results suggest that HERG translation and trafficking rates are independently governed by noncoding information in various regions of the mRNA molecule. Noncoding information embedded within the mRNA may play a role in the pathogenesis of hereditary arrhythmia syndromes and could provide an avenue for targeted therapeutics.—Sroubek, J., Krishnan, Y., McDonald, T V. Sequence- and structure-specific elements of HERG mRNA determine channel synthesis and trafficking efficiency.
Keywords: codon-usage, KCNH2, LQTS, SNP, protein translation
The hereditary long QT syndrome (LQTS) is a cardiac disorder characterized by faulty ventricular repolarization, with susceptibility to life-threatening arrhythmias and sudden death (1, 2). Mutations in the LQT2 locus (the second of 13 loci) affect human ether-à-go-go-related gene (HERG; a.k.a. KCNH2; refs. 3, 4) that encodes the pore-forming subunit of the channel, which carries the rapidly activating delayed rectifier K+ current (IKr). To date, there are >500 mutations identified in HERG, including missense, nonsense, frameshift, and splice site (Human Genetic Mutation Database, Cardiff, UK; http://www.hgmd.cf.ac.uk/). The mutations are well distributed throughout the length of the protein, and most cause problems with the protein folding or trafficking (5–7). This is in contrast to mutations in the other cardiac channel genes, such as slowly delayed rectifier potassium channel (KCNQ1)/accessory subunit for KCNQ1 (KCNE1) and cardiac voltage-gated sodium channel (SCN5A), where the defects are more often biophysical, perturbing the current-carrying properties (8).
As genomic sequencing technology has evolved, many more single-nucleotide polymorphisms (SNPs) have been identified. SNPs are nucleotide changes that exist in a measurable percentage of the general population that may or may not change the amino acid sequence of the protein (nonsynonymous and synonymous, respectively). SNPs are generally considered neutral variants, since they tend not to result in overt disease. There is emerging evidence however, that SNPs may play roles as modifiers of disease susceptibility. Furthermore, when considering the cumulative effects of an entire haplotype, multiple SNPs can dramatically alter the expression of a “single-gene” disease phenotype (9). Interestingly, ∼30% of clinically diagnosed patients with LQTS do not carry mutations in any of the 13 known loci (10, 11). Possible explanations for this are that there are still unidentified loci or that copy number variants play a larger role than previously appreciated. Another explanation could be that these patients harbor SNPs that modify disease phenotype. For example, Crotti et al. (12) identified a common nonsynonymous SNP HERG-K897T that exacerbated symptoms in a patient carrying a latent disease-causing mutation A1116V. The relatives carrying A1116V alone were asymptomatic. Studies have also identified SNPs that alter susceptibility of drug binding to HERG that could lead to acquired LQTS (13).
Another important question to resolve is the contribution of synonymous SNPs to disease phenotype. Typically, synonymous SNPs are thought to be benign and neutral since they do not result in an amino acid change for the protein product. Synonymous SNPs have been reported to have an effect on a number of disease-related proteins, however, such as the cystic fibrosis transmembrane conductance regulator (CFTR), multidrug resistance gene 1 (MDR1) for P-glycoprotein, the dopamine receptor D2 (DRD2), and corneodesmosin (CDSN) (14–17). Bartozewski et al. (16) recently showed that a synonymous SNP in the ΔF508 mutant of CFTR significantly altered mRNA stability, leading to enhanced mutant protein expression. Kimchi-Sarfaty et al. (15) showed that synonymous SNPs in P-glycoprotein perturbed the protein-folding process, such that substrate specificity was altered. In a third study, Duan et al. (14) showed that a synonymous SNP in DRD2 caused increased degradation of the mRNA and reduced receptor expression. There is now accumulating evidence that synonymous SNPs do have an effect, as they can alter mRNA structure, folding, and stability. These changes in mRNA may affect the protein translation rate, folding of the nascent protein, and/or function. Each of these examples is a large protein, containing multiple-transmembrane domains and structured cytosolic domains comparable to HERG. Given that evidence suggests similarities between HERG and CFTR in terms of propensity toward folding errors and aberrant trafficking (18–20), we sought to investigate the effect of synonymous mRNA changes on HERG as a potential modifier of pathogenesis.
For this study, we examined the biophysical properties, synthesis, and trafficking of a resynthesized HERG cDNA with codons modified to alter mRNA structure but not amino acid sequence. In this work, we have shown that global synonymous codon modification of the HERG mRNA results in less efficient translation and more efficient maturation/trafficking. Furthermore, we found that the noncoding elements that affect translation and trafficking efficiencies are localized to specific portions of the mRNA and that the regions that affect translation and trafficking efficiencies are not identical.
MATERIALS AND METHODS
DNA constructs
HERG-NT cDNA was inserted into the pCMV-tag3a vector as a myc-tagged construct or into the p3xCMV-FLAG vector (Sigma-Aldrich, St. Louis, MO, USA) as a FLAG-tagged construct. Using the program Gene Designer 2.0 (DNA 2.0, Menlo Park, CA, USA), the codon modified HERG (HERG-CM) was designed as an alternative sequence to the native HERG cDNA (HERG-NT), where each codon that could be altered while preserving the amino acid coding was altered synonymously. Our constraints were that only codons with >10% frequency in human genome were chosen, and the GC content and stem-loop presence were minimized. The desired cDNA was synthesized, and sequence was fully verified by DNA 2.0. All restriction enzymes were from New England Biolabs, (Ipswich, MA, USA). Neither the HERG-NT nor HERG-CM constructs contained any endogenous 5′ or 3′ untranslated regions (UTRs); rather, they contained only the open reading frame (ORF) or coding region. For mammalian expression, the cDNA was ligated into pCMV-tag3a vector using BamHI/HindIII restriction sites. To create the chimeric constructs, we first performed PCR on HERG-NT cDNA to isolate the N-terminal (primers: 5′-gcatggatccaatgccggtgcggaggg-3′ and 5′-cgatgaattcgcggtgcctgcagc-3′); transmembrane (primers: 5′-gcatgaattcaccgctggaccatcctgc-3′ and 5′-cgatggtacccgagtacagccgctgg-3′); and C-terminal (primers: 5′-cgataagcttctaactgcccgggtcc-3′ and 5′-ggacccgggcagttagaagcttatcg-3′) regions. Chimera HERG-NCC was made by ligating the N-terminal PCR product into pCMV-tag3a-HERG-CM via Bam HI/EcoRI sites. Chimeras HERG-CNC and HERG-CCN were made by ligating the transmembrane PCR product (via Eco RI/Kpn I) and C-terminal PCR product (via Kpn I/Hind III), respectively, into pJ246-HERG-CM; these full-length chimeric cDNA inserts were then moved to the expression vector pCMV-tag3a via BamHI/HindIII (direct insertion into this vector was not possible because of the presence of multiple KpnI sites in the pCMV plasmid).
Dwelling time plots
The relative values of codon abundance were obtained from the Codon Usage Database (ref. 21; http://www.kazusa.or.jp/codon/). To estimate the relative time a translating ribosome spends on each segment (termed “relative dwelling time” of the ribosome) of the translated mRNA, we assumed that peptide synthesis on a translating ribosome is a first-order process in [tRNAa] (where [tRNAa] is the concentration of the tRNA matching the codon a that is being translated). Given that [tRNAa] levels are difficult to obtain accurately, we made use of the observation that, in general, relative values of [tRNAa] in a human cell are proportional to the relative abundance of the matching codon a in human genome. In other words, if codon a is twice as common in the human genome as codon b, then [tRNAa] will be twice as high as [tRNAb] in most human cells.
To summarize these assumptions in a mathematical form:
where x is a physical distance over which a translating ribosome travels over time t, k is a proportionality constant, and RAa is relative abundance of codon a.
This relation can be rewritten as
This equation can now be integrated over an interval 〈x1,x1+c〉 (where x1 is an arbitrary position on the RNA, and c is the increment distance a ribosome travels on translating 1 codon), yielding
Hence, the relative time that it takes a ribosome to translate a codon a is proportional to the inverse of the relative abundance of that codon in the human genome. We call this time the relative ribosomal dwelling time (RDT) over codon a.
To minimize the noise in our display, we chose to perform sliding window averaging on RDTs within the analyzed mRNA sequence (a window of 31 was arbitrarily chosen as an approximation of a ribosomal footprint on mRNA):
Average of values for every set of 31 consecutive codons was taken and assigned to each codon (i.e., to codon ai we assigned the averaged relative dwelling time over codons ai, ai+1, ai+2, …, ai+30).We normalized the data against the highest and lowest values of the combined HERG-NT and HERG-CM data sets. The normalized, averaged relative dwelling times were then plotted as a function of codon position.
Analysis of KCNH2 sequences
All cDNA or mRNA sequences were downloaded from the U.S. National Center for Biotechnology Information (NCBI; Bethesda, MD, USA) database (http://www.ncbi.nlm.nih.gov/) using the accession numbers listed. The protein coding regions were determined using the Translate tool from ExPASy (ref. 22; http://web.expasy.org/translate). The sequences were then analyzed using a custom program written in MATLAB. The G and C characters were counted, and the GC content was calculated as a percentage of the total sequence length. To calculate the number of CpG islands, the sequences were run though the EMBOSS CpGPlot program (ref. 23; http://www.ebi.ac.uk/Tools/emboss/cpgplot/). The default settings were used as follows: window size 100, step 1, MinPC 50, length 200, reverse no, and complement no. The CpG plot was done through the MethPrimer program (ref. 24; http://www.urogene.org/methprimer/index1.html).
Cell culture and construction of stable cell lines
All experiments were done in transiently or stably transfected HEK293 cells (American Type Cell Culture, Manassas, VA, USA). HEK293 cells were maintained at 37°C in 5% CO2 in RPMI 1640 medium (Mediatech, Manassas, VA) supplemented with 10% FBS (HyClone, Logan, UT, USA) and penicillin/streptomycin (Mediatech). For imaging studies, phenol red-free medium was used. Transfections were done using FuGene 6 (Roche, Indianapolis, IN, USA) with GFP as an identifier of positively transfected cells. To establish a stable cell line expressing HERG-CM (HEK-HERG-CM), we transfected pCMV-tag3a-HERG-CM into HEK293 cells and applied selective pressure using 800 μg/ml geneticin (Gibco/Invitrogen, Carlsbad, CA, USA). Limiting dilution cloning led to the isolation of several stable lines. Clone 15 was used throughout these studies, as it maintained consistent expression for more than several months. A stable line expressing HERG-NT (HEK-HERG-NT) was used as described previously (25).
Electrophysiology
Whole-cell patch-clamp experiments were performed as described previously with minor modifications (26). Briefly, cells were grown on gelatin-coated coverslips and then placed on an acrylic/polystyrene perfusion chamber (Warner Instruments, Hamden, CT, USA). All chemicals were purchased from Sigma-Aldrich. The pipette (internal) solution consisted of 126 mM KCl, 2 mM MgSO4, 0.5 mM CaCl2, 5 mM EGTA, 4 mM Mg-ATP, and 25 mM HEPES (pH 7.2; osmolality, 280±10 mosmol/kg), while the bath (external) solution consisted of 150 mM NaCl, 1.8 mM CaCl2, 4 mM KCl, 1 mM MgCl2, 5 mM glucose, and 10 mM HEPES (pH 7.4; 320±10 mosmol/kg).
Recordings were made using heat-polished pipettes with a tip resistance of 2–3 MΩ in the patch-clamp solutions. All experiments were done at room temperature (20–22°C) using an inverted microscope, electronic patch-pipette micromanipulators, and Axopatch 200B patch-clamp amplifiers (Molecular Devices, Sunnyvale, CA, USA) controlled by pClamp10 software. The pipette offset potential in these solutions was corrected to 0 just prior to seal formation. The recorded series resistance was ∼9–10 MΩ. Whole-cell capacitance (generally 10–25 pF) was compensated electronically through the amplifier. Whole-cell series resistance was compensated to 80% using amplifier circuitry, such that the voltage errors for currents of 2 nA were always <6 mV. A standard holding potential was −80 mV. To elicit HERG potassium currents, cells were depolarized to various potentials from a holding potential of −70 mV for 2500 ms, followed by stepwise repolarization to −40 mV (for 1000 ms) and then to −120 mV (for 500 ms) to measure outward tail currents. Signals were analog filtered using an 8-pole Bessel filter at 1000 Hz and sampled between 5000 and 10,000 Hz. Current-voltage relationship (I-V curve) was obtained by plotting the average currents from the last ∼100 ms of the depolarizing pulse vs. the depolarizing voltage. Voltage dependence of activation was derived by plotting the peak current during the −40-mV test pulse vs. the voltage in the corresponding depolarizing pulse.
SDS-PAGE and immunoblots
Unless otherwise specified, cells were lysed with ice-cold NDET buffer [150 mM NaCl; 5 mM EDTA; 1% Nonidet P-40; 0.4% deoxycholate; 25 mM Tris, pH 7.5; and Complete protease inhibitors (Roche)] and shaken on ice for 20 min to 1 h. Postnuclear supernatant was obtained by a 10 min 13,000 rpm centrifugation of the samples. The lysate was then combined with loading buffer (containing dithiothreitol) and was separated using 7.5% SDS-PAGE. The protein content was then transferred onto nitrocellulose membrane (Bio-Rad, Hercules, CA, USA) using a semidry blotting unit (Fisher Scientific, Waltham, MA, USA). After 30 min of blocking in 5% nonfat milk, specific proteins were detected using the following antibodies: rabbit anti-HERG H175 (Santa Cruz Biotechnology, Santa Cruz, CA, USA), mouse anti-Na+/K+ ATPase (ThermoFisher, Waltham, MA, USA), goat anti-calnexin (Santa Cruz Biotechnology), and mouse anti-cadherin (Novus, Littleton, CO, USA). All immunoblots were analyzed using the Odyssey system (Li-Cor, Lincoln, NE, USA).
Immunofluorescence microscopy
HEK293 cells transfected with HERG-NT or HERG-CM were fixed with 4% paraformaldehyde 48 h post-transfection. The cells were then stained with rabbit anti-HERG H175 (Santa Cruz Biotechnology) along with goat anti-calnexin (Santa Cruz Biotechnology), mouse anti-cadherin (Abcam, Cambridge, MA, USA) or mouse anti-Na+/K+ ATPase (Upstate, Lake Placid, NY, USA) antibodies, followed by appropriate secondary antibodies carrying Alexa Fluor dyes 488 or 568 (Invitrogen). Images were collected using the Leica AOBS SP5 or Leica TCS AOBS SP2 laser-scanning confocal microscope.
Image analysis
All image analysis was done using the ImageJ program (U.S. National Institutes of Health, Bethesda, MD, USA) with the Intensity Correlation plug-in (27–29). Colocalization was estimated by selecting tight regions of interest (ROIs) encompassing single cells or small groups of cells and then calculating Pearson's correlation coefficient for HERG and organelle marker signal. Alternatively, line plots for antibody signals were calculated across individual cells.
Cell surface biotinylation
Cell surface protein expression was determined by labeling with the membrane-impermeant biotinylation reagent, NHS-SS-biotin (ThermoFisher). Cells were washed twice with PBS containing 0.1 mM CaCl2 and 1 mM MgCl2 (PBS-Ca/Mg), and incubated on ice in NHS-SS-biotin (1.5 mg/ml) in 20 mM HEPES (pH 9.0), 2 mM CaCl2, and 150 mM NaCl for 45 min on ice. After labeling, the cells were rinsed briefly with PBS-Ca/Mg and incubated in 100 mM glycine in PBS-Ca/Mg for 15 min on ice to quench unreacted NHS-SS-biotin. Cells were lysed in 100 μl of lysis buffer (50 mM Tris-HCl, pH 7.5; 1% Triton X-100; 1% SDS; 150 mM NaCl; 5 mM EDTA; and protease inhibitor) with gentle shaking on ice for 15 min. The cell lysates were diluted by the addition of 900 μl of lysis buffer without SDS and then homogenized by QiaShredder (Qiagen, Valencia, CA, USA). Protein concentration of each sample was determined by Micro BCA Assay (ThermoFisher). Equal amounts of biotinylated proteins were precipitated from the supernatant solution with UltraLink immobilized streptavidin (ThermoFisher) and overnight incubation at 4°C with gentle agitation. The beads were washed 3 times with lysis buffer, twice with high-salt lysis buffer (lysis buffer with 500 mM NaCl and 0.1% Triton X-100), and once with 50 mM Tris-HCl (pH 7.5). The biotinylated surface proteins were eluted from the beads with SDS sample loading buffer at room temperature for 30 min. The remaining supernatant represented the unlabeled proteins that had not yet been trafficked to the cell surface. Proteins were then subjected to SDS-PAGE and immunoblotting. Cadherin was used as a positive control for cell-surface pulldown, and calnexin was used as the negative control for intracellular proteins.
Velocity gradient fractionation
Separation of plasma membrane (PM) and endoplasmic reticulum (ER) membrane vesicles was achieved via velocity gradient centrifugation following the procedure of Hurt et al. (30) with minor modifications as described previously (31). Briefly, confluent HEK-HERG-NT and HEK-HERG-CM cells (one 15-mm plate each) were scraped with 0.5 ml ice-cold HT buffer (20 mM HEPES, pH 7.4; 2 mM EDTA; 2 mM EGTA; 6 mM MgCl2; and protease inhibitors). Next, the cells were lysed by 3–7 strokes of a tight-fitting Dounce homogenizer and subsequently centrifuged at 1000 g for 5 min. The supernatant was collected and immediately supplemented with sucrose to a final concentration of 200 mM and then loaded on a discontinuous gradient of the following composition: 2.0 M sucrose (0.4 ml), 1.5 M sucrose (0.75 ml), 1.35 M sucrose (0.75 ml), 1.2 M sucrose (0.75 ml), 0.9 M sucrose (0.5 ml), and 0.5 M sucrose (0.5 ml), all made in HT buffer. After 16 h centrifugation at 32,000 g using the Sw60Ti rotor (Beckman Instruments, Brea, CA, USA), 0.5 ml fractions were collected from the top and (except for the first 3, presumably cytosolic fractions) analyzed by SDS-PAGE with immunoblot. The ratio of PM and ER pools of HERG was calculated by dividing the combined HERG immunoblot intensity from the top 3 fractions by the combined HERG intensity from the bottom 2 fractions.
In vitro translation (IVT)
IVT experiments were done using the Promega (Madison, WI, USA) micrococcal nuclease-treated rabbit reticulocyte system, and the protocol was adapted from Lu and Deutsch (32). Complementary RNA containing the 5′ cap was transcribed in vitro from linearized plasmid DNA using the T3 Message Machine kit and purified on the MEGAClear column from Ambion/Life Sciences (Carlsbad, CA, USA). The plasmid constructs (in pCMVtag3a) contained the HERG-NT or HERG-CM coding regions but did not contain 5′ or 3′ untranslated regions. Proteins were synthesized in the presence of [35S]methionine (10 μCi/μl; EasyTag; Perkin Elmer, Waltham, MA, USA) for 0 to 60 min at 30°C, according to manufacturer's instructions. For each sample, 200 ng of cRNA was used per 25 μl reaction. The reaction contained all essential reagents with canine pancreatic microsomal membranes and RNase inhibitor (RNAsin; Promega). Reactions were quenched on ice, in 4× volume of buffer composed of 20 mM HEPES, 4 mM MgCl2, 100 mM NaCl, and 1 mM DTT (pH 7.4–7.5). The quenched translation reactions were loaded onto a sucrose cushion of equal volume (containing 0.5 M sucrose, 100 mM KCl, 5 mM MgCl2, 50 mM HEPES, and 1 mM DTT, pH 7.5) and subjected to ultracentrifugation using a TLA100.1 Beckman rotor at 77,000 rpm (200,000 g) for 30 min at 4°C. The supernatant was removed, and the pellet was resuspended in 10 μl of quench buffer and 10 μl SDS-PAGE sample buffer. Samples were loaded on to a 4–15% gradient Tris-glycine gels and electrophoresed at constant voltage (Bio-Rad). Gels were then transferred using the semidry electroblotting system onto nitrocellulose membranes. Membranes were soaked in a solution of 0.5 M sodium salicylate, 5% methanol, and 10% glycerol for 10 min and then exposed to film at −80°C for autoradiography.
IVT analysis
Autoradiography films were scanned and converted into digital files for densitometry analysis using ImageJ. Line scan analysis was done by taking a vertical line ROI for each lane. Membranes were washed in Tris-buffered saline with Tween 20 (TBS-T) and then Ponceau S stained to visualize total protein and lane boundaries. Next, pieces were cut from each lane for liquid scintillation counting and quantitation. For HERG, a piece was cut between the molecular mass markers for 100–150 kDa, representing a full-length product, and the rest of the lane representing the remainder was counted separately. Membrane pieces were dissolved in Filtron-X liquid scintillation cocktail (National Diagnostics, Atlanta, GA, USA). The ratio of [35S]methionine counts was calculated by taking the counts for full-length product divided by the counts of the remainder of the lane.
Polysomal profiling
Polysomal profile analysis was performed as described previously (33). Linear 10–50% (w/v) sucrose gradients were prepared by consecutively freezing each layer until all 5 layers were added. Sucrose solutions of 10, 20, 30, 40, and 50% were made in the following buffer: 10 mM Tris (pH 7.4), 100 mM NaCl, 2.5 mM MgCl2, and RNAsin. For each Sw 41Ti tube, 2 ml of 50% sucrose was added to the bottom and frozen, and then the next 2-ml layer of 40% sucrose was added, frozen, etc., until all 5 layers were added. Frozen gradients were thawed overnight at 4°C and used the next day.
For polysomal profiling experiments, two 15-cm plates of stably transfected HEK-HERG cells roughly 70% confluent were used per gradient. Prior to lysis, cells were treated with 100 μg/ml cycloheximide for 10 min at 37°C. Cells were lysed on ice in a buffer composed of 100 mM NaCl, 2.5 mM MgCl2, 25 mM, Tris-HCl (pH 7.5), 1% Nonidet P-40, 0.4% sodium deoxycholate, 1 mM DTT, 100 μg/ml cycloheximide, and RNAsin. Lysate was spun at 13,000 rpm on a tabletop centrifuge at 4°C for 10 min. A portion of the cleared lysate was saved for the total RNA determination. The rest of the lysate (∼1-1.5 ml) was layered onto the top of the sucrose gradient. Gradients were spun at 38,000 rpm for 2 h at 4°C using a Sw 41Ti rotor and Beckman Optima LE ultracentrifuge.
Gradients were scanned by absorbance at 254 nm using an ISCO UA-6 continuous UV reader. For each gradient, 1-ml fractions were collected into tubes containing 200 μl of 1% SDS. RNA was then extracted from the fractions by sodium acetate and ethanol precipitation with incubation at −80°C overnight. The samples were centrifuged at 13,000 rpm for 10 min at 4°C using a tabletop centrifuge. The RNA pellets were resuspended and purified using the RNeasy Mini Kit (Qiagen).
Quantitative real-time PCR
First-strand synthesis was done on the pooled RNA fractions using the SuperScript VILO cDNA synthesis kit (Invitrogen). Fractions were pooled using equal volumes of RNA, and the total starting concentration for the first-strand synthesis reactions was 2500 ng. The primers were a mix of oligo-dT and random hexamers. The reaction proceeded as follows using the Veriti thermocycler (Applied Biosystems, Carlsbad, CA, USA): 10 min at 25°C, 50 min at 50°C, and min at 85°C, and the final step included the addition of Escherichia coli RNase (Ambion, Austin, TX, USA) for 25 min at 37°C.
After first-strand synthesis, qRT-PCR was done using Power SYBR Green Master Mix and the Step One System (Applied Biosystems). Primers for HERG-NT, HERG-CM, GAPDH, β-actin, and N-cadherin were commercially synthesized (IDT DNA, Coralville, IA, USA). Reactions were prepared in triplicate. Cycling conditions were as follows: a holding stage 2 min at 50°C and 10 min at 95°C, 40 cycles of 15 s 95°C, 1 min 60°C, 30 s 72°C, and a final melt curve stage of 15 s at 95°C, 1 min at 60°C, and 15 s at 95°C.
Data were collected using the Step One software to determine threshold cycle (Ct) for relative quantification. Data analysis was normalized by calculating the percent of total RNA for each fraction.
PCR primer sequences were as follows: HERG-NT, forward 5′-TCAACCTGCGAGATACCAACATG-3′ and reverse 5′-CTGGCTGCTCCGTGTCCTT-3′; HERG-CM, forward 5′-TCAATCTCAGGGACACAAACATG-3′ and reverse 5′-AAGATACCGAACAACCCGGC-3′; GAPDH, forward 5′-TCAACGACCACTTTGTCAAGCTCA-3′ and reverse 5′-AGTAAGACCCCTGGACCACCAGC-3′; actin, forward 5′-CTCTTCCAGCCTTCCTTCCT-3′ and reverse 5′-CTGTACGCCAACACAGTGCT-3′; N-cadherin, forward 5′-ACAGATGTGGACAGGATTGTGGGT-3′ and reverse 5′-TATCCCGGCGTTTCATCCATACCA-3′
Statistics
All data are expressed as means ± se. The 2-tailed Student's t test was used, and a value of P < 0.05 was considered significant.
RESULTS
Codon modification of the HERG cDNA coding sequence
Analysis of HERG mRNA sequence revealed 66% GC content, 59 potential complementary repeats, and 28 GC-rich repeats. Such transcript characteristics are known to cause potentially problematic secondary structures, particularly hairpins, in RNA that may decrease the efficiency of translation (34–36). Analysis of potential secondary structures using the RNAFOLD program (ref. 37; http://rna.tbi.univie.ac.at/cgi-bin/RNAfold.cgi) resulted in statistics shown in the Table 1.
Table 1.
Analysis of potential secondary structures
| Parameter | HERG-NT | HERG-CM |
|---|---|---|
| Thermodynamic ensemble (kcal/mol) | ||
| Predicted | −1716 | −1320 |
| Centroid secondary structurea | −1372 | −857 |
| GC content (%) | 65.6 | 51.1 |
| Complementary repeats (>n) | 59 | 13 |
| 8-nt GC runs (n) | 161 | 0 |
Structure with the minimum total base-pair distance to all structures in the thermodynamic ensemble.
To determine whether the primary sequence of the ORF of HERG mRNA had any influence on the properties of the protein product, we synthesized a synonymous mRNA sequence with the following properties: whenever possible, each codon was modified compared to the native sequence; only high-frequency human codons were used; overall GC content target was 50%; local GC-rich segments were eliminated; and the presence of secondary structure elements was minimized. This sequence was named HERG-CM in distinction to the naturally occurring HERG-NT sequence. While HERG-CM shared a 65.9% nucleotide homology with HERG-NT, there was only a 12.8% identity at the codon level (Table 1). Furthermore, HERG-CM GC content was reduced to 51.1%, containing 13 complementary repeats and no 8-nt GC runs. The predicted free energy of HERG-CM RNA structure was reduced from −1716 kcal/mol to −1320 kcal/mol as determined by RNAFOLD (http://rna.tbi.univie.ac.at/cgi-bin/RNAfold.cgi). Comparable results were achieved using other RNA structure analysis programs (MFold: http://mfold.rna.albany.edu/; SFold: http://sfold.wadsworth.org/cgi-bin/index.pl; and NUPack: http://www.nupack.org/). The final plasmids used for all experiments contained only the ORF coding sequence without 5′ or 3′ UTRs for both HERG-NT and HERG-CM.
We analyzed the codon frequency usage of HERG-NT and HERG-CM for the human codon bias (using the Codon Usage Database: http://www.kazusa.or.jp/codon/) by assigning an inverse value of the relative codon frequency and averaged the values in a 30-codon window to estimate the relative dwell time [assuming that rate of ribosome translocation was inversely correlated with tRNA abundance (38)]. The normalized averages (relative dwelling times) were plotted as a function of the first codon in each window of 31 (Fig. 1A). HERG-NT shows several slow-translating regions (indicated by peaks in blue tracing), particularly following the PAS and CNBD domains. These indicate patches of rare codon usage and inferred increased ribosome dwell time. No such regions are present in the more uniform HERG-CM mRNA (Fig. 1A). The dwell time values range from 0 to 1 for HERG-NT, while the values for HERG-CM show a smaller range from 0.2 to 0.7. The average molecule-wide dwell-time average was not significantly different between the two sequences (0.437 for HERG-NT and 0.431 for HERG-CM).
Figure 1.
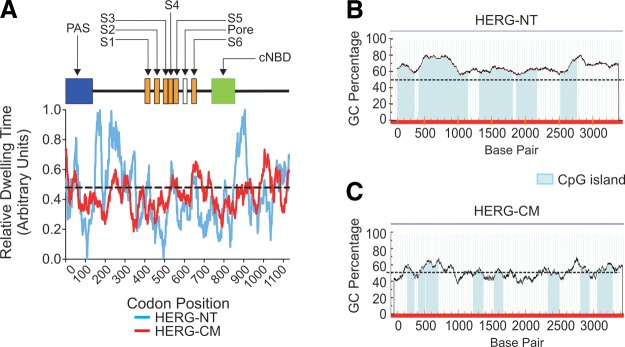
HERG-NT and HERG-CM sequence details, relative ribosomal dwelling times, and GC content. A) Graphical illustration comparing the relative ribosomal dwelling time using the HERG-NT and HERG-CM sequences. Top portion is a schematic linear representation of the HERG protein with the major domains identified: PAS, Per-Arnt-Sim domain; S1–S6, transmembrane regions; pore, pore-loop domain; cNBD, cyclic nucleotide binding domain. Graph shows predicted translating ribosome dwelling time for a 31-codon sliding window, which was calculated and plotted as a function of the position of the first codon in each window. B, C) Plot of the GC percentage of HERG-NT (B) and HERG-CM (C), respectively, using a sliding window of 100 bp for the full-length sequence of HERG. Dashed line indicates 50%; blue boxes denote CpG islands of >200 bp.
In addition to the unique characteristics of rare codon usage, the HERG-NT sequence displays significant conservation of its high GC content across mammalian species. The average genome-wide GC content in humans is ∼41%, while in the coding regions, it is ∼52% (39, 40). In general, the GC content in human genome ranges from 30 to 60% and is organized in isochores, contiguous regions of similar GC content (41–43). HERG coding sequence has a particularly high GC content at 65.9% (Table 2). Figure 1B shows a plot of GC percentage vs. base pair position for the full-length coding sequence of HERG-NT. The blue boxes indicate that HERG-NT has 5 CpG islands of >200 bp in length. These may represent areas of slower translation. By comparison, HERG-CM reduced GC content, and CpG islands are shown in Fig. 1C. When compared across 8 mammalian species, the KCNH2 GC content is in the range of 60–65% (Table 2). The GC content of homologous sequences in phylogenetically distinct species, such as fish, is significantly lower at 54–57%. Invertebrate orthologs in fruit flies and worms also have a lower GC content at 57 and 43%, respectively. A second comparison is shown with other human cardiac ion channels (Table 2). The HERG-coding sequence generally has the highest GC content of the listed human channels. KCNQ1 and KCNA5 also have high GC contents similar to HERG. Also of note is the high number of CpG islands (>200 bp in length) in the native HERG sequence. KCNA5 has a high GC content and relatively high number of CpG islands. These unique features of the HERG-NT sequence could impart greater complexity of mRNA structure and impact translation efficiency. The other cardiac channels listed, which include voltage-gated potassium, sodium, and calcium channels, have a lower GC content. The CFTR protein, which has a relatively low GC content, was included in this comparison since it has been well established that this protein is subject to misfolding, processing, and trafficking errors much like the HERG protein.
Table 2.
GC content analysis across multitransmembrane domain proteins
| Sequence name | Protein or common name | Length (aa) | GC content (%) | Accession number |
|---|---|---|---|---|
| Protein name | ||||
| HERG-NT KCNH2 | HERG | 1159 | 65.89 | U04270 |
| HERG-CM | 1159 | 51.15 | ||
| KCNQ1 | KCNQ1 | 676 | 64.205 | NM_000218.2 |
| KCNA4 | Kv 1.4 | 653 | 52.039 | M60450.1 |
| KCNA5 | Kv 1.5 | 613 | 65.092 | NM_002234.2 |
| KCND3 | Kv 4.3 | 803 | 58.994 | NM_004980.4 |
| KCNJ2 | Kir 2.1 | 427 | 48.442 | NM_000891.2 |
| SCN5A | Nav 1.5 | 1983 | 57.241 | BC144621.1 |
| CACNA1C | Cav 1.2 | 2135 | 56.632 | BC146846.1 |
| CFTR | CFTR | 1480 | 41.526 | NM_000492.3 |
| Common name | ||||
| Pan troglodytes (predicted) KCNH2 | Chimpanzee | 1159 | 65.89 | XM_001137384.2 |
| Bos taurus KCNH2 | Cow | 849 | 65.84 | BC142496.1 |
| Equus caballus KCNH2 | Horse | 1158 | 65.57 | NM_001193658.1 |
| Oryctolagus cuniculus KCNH2 | Rabbit | 1144 | 65.33 | NM_001082384.1 |
| Canis lupus familiaris KCNH2 | Dog | 1158 | 62.93 | NM_001003145.1 |
| Cavia porcellus KCNH2 | Guinea pig | 1158 | 62.93 | NM_001172973.1 |
| Mus musculus Merg1 | Mouse | 1162 | 60.59 | NM_013569.2 |
| Rattus norvegicus KCNH2 | Rat | 1163 | 60.74 | NM_053949.1 |
| Danio rerio KCNH2 | Zebrafish | 1186 | 54.82 | NM_212837.1 |
| Oncorhynchus mykiss KCNH2 | Rainbow trout | 1167 | 57.79 | NM_001124676.1 |
| Drosophila melanogaster eag | Fruitfly | 1174 | 57.39 | M61157.1 |
| Caenorhabditis elegans Herg-like unc 103 | Worm | 791 | 42.97 | AF257518.1 |
HERG-CM produces functional K+ channels carrying IKr-like current
To determine whether HERG-CM would produce functional channels, we compared electrophysiological data obtained using the whole-cell patch-clamp technique from stably transfected HEK-HERG-NT and HEK-HERG-CM cells (Fig. 2). The HERG-CM channels produced a current qualitatively indistinguishable from HERG-NT when using an activation protocol (Fig. 2A, B). On stimulation with a standard 3-step activation protocol, we observed the characteristic fast inactivation, release from inactivation occurring at the −40 mV repolarization step, and tail current at the −120 mV step (Fig. 2A). In addition, the voltage dependence of activation and I-V relationship were nearly identical (Fig. 2C, D). The voltage dependence of activation curves was fit using the Boltzmann equation, which gave the half-maximal activation (V1/2) values of −11.36 ± 3.35 and −15.26 ± 1.67 mV for HERG-NT and HERG-CM, respectively. This difference was not statistically significant.
Figure 2.
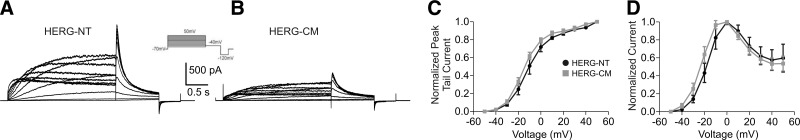
Electrophysiological analysis of HERG-NT and HERG-CM channels. A) Family of whole-cell current recordings from HEK-HERG-NT cells during the voltage-step activation protocol shown in the inset. B) Current tracing from HEK-HERG-CM cells during the same activation protocol as in A. Cells were transfected the same day and with the same amount of plasmid; note the consistently reduced current density for HERG-CM. C) Voltage-dependent activation curves for both channels. Curves were fitted with a Boltzmann function; V1/2 is −11.36 ± 3.35 mV for HERG-NT and −15.26 ± 1.67 mV for HERG-CM; n = 3–7. D) Normalized I-V relationship for HERG-NT and HERG-CM. There were no statistically significant differences in C or D.
HERG-NT and HERG-CM protein expression are quantitatively and qualitatively different in HEK293 cells
When expressed as myc-tagged fusion proteins, both HERG-NT and HERG-CM constructs could be detected on immunoblots as 2 bands: 135 and 155 kDa (Fig. 3A). It has been established that the immature glycosylated (135-kDa) form of HERG represents the ER-restricted pool of the channel, while the mature glycosylated (155-kDa) form represents HERG from other subcellular compartments, primarily the Golgi apparatus and the PM (44). The ratio of 155/135-kDa HERG bands, therefore, may be considered a surrogate marker for surface expression of the channel. The relative intensity (and ratio) of the mature and immature forms, was significantly different for HERG-NT and HERG-CM. The mature/immature band ratio was 0.60 ± 0.12 for HERG-NT but markedly higher (2.90±0.33) for HERG-CM (Fig. 3B). The total HERG expression was greater for HERG-NT than HERG-CM. To determine whether the altered ratio of mature/immature was a function of expression levels, we transfected various amounts of cDNA and assessed the band patterns on immunoblot (Fig. 3C–E). HERG-NT expressed 2–3 times more than HERG-CM given the same amount of starting DNA (Fig. 3D). The increased expression of 155-kDa band for HERG-CM is conserved throughout the various expression levels (Fig. 3E). These results suggest that the two protein products may have a different intracellular fate, despite having identical amino acid sequences.
Figure 3.

Protein expression of HERG-NT and HERG-CM in HEK cells. A) Immunoblot of HERG-NT- and HERG-CM-expressing HEK cells. Doublet bands show immature (135 kDa) and mature (155 kDa) HERG. Na+/K+ ATPase was used as a loading control. B) Quantification of immunoblot densitometry of the 155/135-kDa ratio for HERG-CM and HERG-NT. ***P < 0.001; n = 10. C) Immunoblot of different transient transfections using various amounts (from 250 ng to 1 μg/35-mm dish) of HERG-NT and HERG-CM plasmid DNA in HEK cells. Na+/K+ ATPase was used as a loading control. D) Quantitation of the total HERG protein expression normalized to loading control. E) Quantitation of the ratio of mature/immature band for HERG-NT and HERG-CM.
HERG-CM localizes preferentially to the PM
On the basis of the initial immunoblot patterns, we sought to determine whether a higher percentage of HERG-CM resides at the PM compared to HERG-NT. To more accurately measure differences in membrane localization, we performed colocalization experiments with confocal microscopy (Fig. 4A). Typical line profile plots from HEK293 cells stained for HERG along with the PM marker cadherin show that the two proteins have a comparable distribution pattern for HERG-CM cells, with the ion channel preferentially appearing at the PM. This is in contrast to the control HERG-NT, which appears to have a large intracellular pool (Fig. 4B, C). Global intracellular localization was quantitatively assessed using Pearson's correlation coefficient (R) calculated for colocalization of HERG with either cadherin or the ER marker calnexin (Fig. 4D, E). HERG-NT colocalized with calnexin to a significantly greater degree than did HERG-CM (r=0.56±0.04 vs. 0.19±0.08). Conversely, HERG-NT cosegregated with cadherin significantly less than HERG-CM (r=0.53±0.04 vs. 0.65±0.02).
Figure 4.

Confocal immunofluorescence analysis of HERG subcellular localization. A) Micrographs of HEK293 cells expressing HERG-NT or HERG-CM, which were fixed, permeabilized, and stained with anti-HERG antibody and counterstained with anti-cadherin antibody to indicate the PM. Rectangles indicate the region selected for analysis. Scale bars = 2 μm. B, C) Analysis of linear regions selected across cells expressing HERG-NT (B) or HERG-CM (C) with fluorescent signal intensit plotted as a function of distance. D) Micrographs of HEK293 cells expressing HERG-NT or HERG-CM, which were fixed, permeabilized, and stained with anti-HERG antibody and counterstained with anti-calnexin antibody to indicate the ER. Scale bars = 20 μm. E) Quantitation of HERG and cadherin or calnexin colocalization using the Pearson's correlation coefficient for the whole-cell region. *P < 0.05, n = 11–15; **P < 0.01, n = 6–7.
A complementary quantitative approach to examine differences in cell surface expression is biotin labeling of surface proteins followed by streptavidin pulldown. Figure 5A, B shows that the 155-kDa form is preferentially expressed at the surface for HERG-NT and HERG-CM and that a greater fraction of HERG-CM is labeled at the surface than HERG-NT (4.24±1.26 times more). Furthermore, velocity centrifugation experiments that separate PMs from ER membranes (Fig. 5C–E) confirmed the other localization results. HERG-NT appeared in both PM and ER membrane fractions (fractions 1 and 2 for PM and fractions 5 and 6 for ER). HERG-CM, in contrast, was recovered almost exclusively in the PM fractions. Quantitation of the velocity centrifugation data shows that the PM/ER ratio for HERG-CM is 4 times that of HERG-NT, consistent with the surface labeling analysis.
Figure 5.

Cell-surface assays show increased PM expression of HERG-CM. A) Immunoblot of cell surface proteins that were isolated by biotin labeling and pulldown from intact HEK cells with similar HERG protein levels by using DNA concentrations that were in a ratio of 1:3 for HERG-NT:HERG-CM. Ctrl denotes the control group of GFP-transfected HEK cells. Calnexin was the negative control for surface labeling, and cadherin was the positive control for surface labeling in the bottom panels. Immunoblot was performed with anti-HERG, anti-calnexin, and anti-cadherin antibodies. B) Summary data for A. Densitometry analysis of the surface expression of HERG proteins was quantified as the amount of surface HERG divided by the total cellular HERG and also normalized for streptavidin pulldown of biotinylated protein (normalization calculated using cadherin and calnexin controls). Graph shows densitometry analysis of the surface expression of HERG proteins quantified as the amount of surface HERG over total cellular HERG. HERG-NT is normalized to 1.0. *P < 0.05; n = 7. C–E) Differential velocity gradient sedimentation experiments on HERG-NT and HERG-CM. C) Top panel: HERG-NT expression among fractions 1–6 where 1 is the top and 6 is the bottom of the sucrose gradient. Middle and bottom panels: immunoblots using anti-Na+/K+-ATPase antibody to indicate the PM fractions and anti-calnexin antibody to show the ER fractions. D) HERG-CM expression among fractions 1–6. E) Quantification of densitometry, where the ratio of PM/ER HERG represents the quantity of HERG in the top 3 fractions divided by the bottom 2 fractions. HERG-NT is normalized to 1.0, as indicated by dashed line. *P < 0.05; n = 3.
HERG-CM translation is inherently attenuated compared to HERG-NT
To investigate the reason for the apparent lower protein expression of HERG-CM, we examined differences in HERG synthesis using in vitro translation and polysomal profiling. Figure 6A shows cell-free in vitro translation products for HERG-NT and HERG-CM metabolically labeled with [35S]-methionine. The full-length product at 130 kDa is first detected around 25 min after initiation of translation (indicated by arrow). To quantify this result, the full-length product bands were excised then scintillation counted and the ratio of [35S]-methionine in the final products was divided by counts of the rest of the lane (Fig. 6B). The ratio of full-length product over intermediate products is significantly less for HERG-CM at each time point after 20 min. We performed a second analysis using line scan plots of the film to examine the relative accumulation of full-length and intermediate products (Fig. 6C, D). The peaks correspond with image densitometry of the bands on the film. The non-normalized (Fig. 6C) and normalized (Fig. 6D) line scan plots show that HERG-NT and HERG-CM, in general, exhibit the same pattern, in terms of peak positions, of the intermediate molecular mass products from 5 to 50 kDa. However, the relative quantity of higher-molecular-mass intermediate bands (>50–100 kDa in 6C) varies between HERG-NT and HERG-CM, suggesting differential sites of translation slowing.
Figure 6.

In vitro translation and polysome profiling show HERG-CM is less efficiently translated. A) Autoradiograph of [35S]methionine labeled in vitro translation products of HERG-NT and HERG-CM at 5 time points from 10 to 60 min. Arrow indicates the full-length HERG translation product. B) Quantification and summary data of in vitro translation experiments. Points graphed represent the ratio of [35S]methionine counts of the full-length product over that of the total lane at each time point. **P < 0.01; n = 5. C, D) Line scan plots where non-normalized (C) and normalized (D) image densitometry of the autoradiograph through the center of each lane is plotted against increasing molecular weight at 60 min of translation. Black line represents HERG-NT; gray line represents HERG-CM. D) Plots were normalized to the value of the highest peak representing the full-length HERG product and to 0 for the baseline. E, F) Polyribosomal profiles for stably transfected HEK-HERG-NT (E) and HEK-HERG-CM (F) cells. The y axis shows absorbance at 254 nm plotted against increasing gradient density where heaviest components will sediment to the right. Underlined segments 1–4 show how fractions were collected and used for subsequent quantitative real time-PCR. G–J) Summary data for results of quantitative real time-PCR. The y axis values represent percentage of total RNA that is comprised by HERG (G), GAPDH (H), actin (I), and N-cadherin (J), respectively, per fraction. For the control genes, open bars represent expression in HEK-HERG-NT cells; shaded bars are expression HEK-HERG-CM cells. *P < 0.05, ***P < 0.001; n = 4.
Polyribosome profiling of HEK-HERG-NT and HEK-HERG-CM cells revealed that there were no significant changes in global translation (Fig. 6E, F). The RNA absorbance profiles show the same number of peaks at the same position along the sedimentation axis. The fractions chosen represent 1) cytosolic and small RNAs, 2) ribosomal subunits and the monosome peak, 3) low-molecular-mass polysomes, and 4) high-molecular-mass polysomes. It is generally accepted that proteins are more actively translated when increased numbers of ribosomes are attached to their coding mRNAs (polyribosomes), and thus, their mRNAs would reside in the heaviest sedimentation fraction. Less actively translated proteins would have mRNAs found in the monosome peak. Our analysis using quantitative real-time PCR found that HERG-NT mRNA was most abundant in fraction 4 (high-molecular-mass polysomes), and HERG-CM mRNA was most abundant in fraction 2, the monosome fraction, and lesser amounts in fractions 3 and 4 (Fig. 6G). This result is consistent with the cell expression and in vitro expression studies, suggesting that HERG-CM mRNA is less actively translated. Thus, it is reasonable that all three mRNAs are found mostly in fraction 4 with the polysomes.
HERG-NT and CM chimeras reveal specific locales for mRNA-dependent control of translation and trafficking efficiencies
We next sought to determine whether specific regions localized within the mRNA molecule could be identified as responsible for the observed differences in protein expression. If there is a correlation between the mRNA sequence and nascent peptide folding, it could be expected to follow protein domain boundaries. Hence, we partitioned the HERG sequence along 3 functionally and structurally distinct regions: the cytosolic N terminus, the transmembrane domains, and the cytosolic C terminus (Fig. 7A). This resulted in 6 possible chimeras (NNC, NCC, NCN, CCN, CNN, and CNC, where C and N signify HERG-CM and HERG-NT sequences, respectively: e.g., chimeras with HERG-CM sequence coding the N terminus and HERG-NT coding for the transmembrane and C terminus were named CNN). When expressed in HEK293 cells, incorporation of any HERG-CM sequence in either of the middle or 3′ portions of the cDNA (NCC, NCN, or NNC) greatly enhanced expression efficiency over both HERG-CM and HERG-NT. Placing HERG-CM sequences in the 5′ third of the cDNA (CNN, CNC, or CCN) had no significant effect on expression abundance (Fig. 7B, C). In contrast to expression efficiency, the trafficking efficiency (as measured by 155/135-kDa ratio or colocalization with surface or ER markers) appeared to be controlled primarily by HERG-CM sequences in the 5′ third of the cDNA (Fig. 7B, D). N-terminal native sequence chimeras (NCC, NNC, or NCN) trafficked similarly to HERG-NT. N-terminal codon-modified substitutions (CNN, CNC, or CCN) trafficked similarly to HERG-CM. HERG-NT and all constructs containing the N terminus of HERG-NT show a ratio of mature/immature band of <1.0, whereas HERG-CM and all constructs containing the N terminus of HERG-CM show a ratio of ≥1.75. Thus, it appears that noncoding elements in specific regions of the HERG mRNA affect translation and trafficking efficiencies, and they do not entirely overlap.
Figure 7.

HERG-NT and HERG-CM chimeras indicate regional differences in mRNA elements that affect translation and trafficking efficiencies. A) Schematic diagram showing construction of HERG-NT and HERG-CM chimeras. Black indicates HERG-NT DNA, designated N; gray indicates HERG-CM DNA, designated C. Numbers indicate the base pair position at the boundaries of the constructs. Only 3 constructs are shown, but all 6 possible combinations were made. B) Immunoblot showing expression of HERG-NT, HERG-CM, and the chimeric constructs. Original sequences and chimeras all display doublet bands at 155 and 135 kDa. Na+/K+-ATPase was used as a loading control. C, D) Summary data of the immunoblot in B. C) Summary data of total protein expression for the chimeras normalized to HERG-NT expression at 1.0, indicated by the dashed line. D) Ratio in mature to immature band for the constructs (n=5–13). E, F) Micrographs of HEK293-expressing chimeras NCC and CNN. Cells were fixed, permeabilized, and stained with anti-HERG antibody and anti-Na+/K+-ATPase (E) or anti-calnexin (F) for subcellular localization. Scale bar = 20 μm. G) Summary data of the immunofluorescence with quantification of HERG and Na+/K+-ATPase or calnexin colocalization using the Pearson's correlation coefficient for the whole-cell region. *P < 0.05, **P < 0.01; n = 5–10 cells.
Immunofluorescence of the chimeras was consistent with the trafficking patterns observed by immunoblot (Fig. 7E–G). The chimera NCC (containing the N terminus of HERG-NT) shows significantly decreased colocalization with the PM marker Na+/K+ ATPase then compared to chimera CNN (Fig. 7G). This is consistent with the glycosylation maturation patterns of their N-terminal sequences. In addition, NCC shows greater colocalization with calnexin (an ER marker) as compared to CNN, which shows decreased colocalization. When taken together, these data consistently indicate that the N-terminal sequences of HERG mRNA exert the greatest effect on subcellular localization.
DISCUSSION
The results in this work suggest that mRNA sequence elements that are independent of the HERG protein primary structure may play a role in both translational and trafficking efficiencies. Here, we have shown that synonymous codon modification of the HERG cDNA produces an ion channel protein that clearly carries an IKr current but exhibits reduced translational efficiency and increased trafficking efficiency. This is an interesting and somewhat surprising cellular phenotype given the codon-modification parameters of reduced GC content and use of more abundant codons. Accordingly, we would expect a more smoothly translated protein with ensuing greater production. The native HERG sequence has a very high GC content of 65.9%, compared to the average GC content in the human genome of 41%, and 52% in the coding regions (39, 40). Thus, we presumed that lowering the GC content would create an mRNA with less complex structure that is more easily and rapidly translated as predicted by the dwelling time plots. Our results, however, showed that HERG-CM is less actively translated supported by reduced association with polysomes. It appears that this is inherent to the mRNA since a comparable reduction was observed with cell-free in vitro translation. That codon modification of HERG greatly enhanced its trafficking efficiency might easily be explained as a secondary result of reduced protein translation and burden on the cellular synthetic and sorting mechanisms. This does not seem to be the case since at every expression level examined (low to high), the ratio of mature and immature channel remained the same for HERG-CM and HERG-NT. In further support of the independence of translation and trafficking efficiencies is our finding that differential segments of mRNA appeared to control each process in chimera experiments.
Whether CM-HERG translation and trafficking efficiency differences are due to changes in codon usage or mRNA secondary structure remain to be determined. Furthermore, specific processes governing translation initiation, elongation, pause cycles, and termination have not been assessed. There is evidence that both mRNA secondary structure and codon usage can affect the rate of translation and cotranslational folding of nascent peptide chains (45–47). Structures within the mRNA molecule including large segments of complementary base-pairing and hairpin loops will be unique to a given mRNA sequence and have been shown to alter the rate of translation, with slowing or pausing of translation (48–50).
Codon usage, or bias, within a genome differs between species and correlates fairly well with the relative abundance of tRNAs for redundantly coded amino acids (51–53). Experimental evidence suggests that translation slows or pauses when ribosomes encounter rare codons for that species (54, 55).
Regulation of protein expression based on mRNA elements is believed to largely reside in the 5′ and 3′ UTRs of the message (45, 56, 57). These areas contain important regulatory elements and are crucial for some types of mRNA processing, localizing the mRNA, binding and recruitment of initiation factors, controlling termination, and polyadenylation (58). More recent evidence for regulatory areas in coding regions of mRNA has been reported (59–61). In the present report, we expressed the HERG-NT and HERG-CM coding sequences from the same mammalian expression vectors. These constructs did not contain any endogenous, HERG-specific 5′ or 3′ UTRs, and the upstream and downstream sequences surrounding the coding regions are of vector origin were identical. Thus, the different behaviors of HERG-NT and HERG-CM proteins were solely due to coding portions of the mRNA. In one study, a group synonymously mutated the GFP coding region to generate 154 clones and observed a 250-fold variation in the protein expression levels (62). They noted a correlation between predicted stability of the mRNA structure near the start codon and the subsequent expression level. They postulated that mRNAs having more stable structure at the beginning hinder translation initiation, resulting in reduced protein expression. It may be that the 5′ structure of HERG-CM mRNA is more stable and thus hinders protein translation leading to reduced expression. This is supported by the in vitro translation and polysome profiling data, which show that HERG-CM mRNA produces less protein product, and it associates with the monosome fraction as opposed to the polysome fraction. Our chimera experiments showed an interesting pattern, such that chimeras NCC, NNC, and NCN all had a higher total expression level than HERG-NT (NNN). This indicates that control of the translation rate is influenced by sequences or structures distinct from the proximal N-terminal region. The in vitro translation revealed that HERG-NT and HERG-CM synthesis follow the same course until midway through the protein, where HERG-CM translation seems to decrease and result in less full-length product, suggesting another important region of sequence-specific translational control. Further chimera work will be necessary to narrow critical regions and identify the sequences responsible for HERG mRNA-dependent regulation of translation efficiency.
We have shown through multiple techniques that HERG-CM has increased surface expression than HERG-NT. One interpretation of these results is that the HERG-CM protein has a different folding pattern and timing such that the trafficking is improved. HERG is known to associate with a number of chaperones, as it is folded cotranslationally (63–65). The improved trafficking could be due to alternate routes and intermediates in the folding process, such that chaperone interactions may have qualitatively and quantitative different interactions with HERG-CM that enables more efficient ER exit. Precedence for such a scenario comes from other studies where a synonymous SNP in P-glycoprotein was shown to produce the same amounts of mRNA and protein, but altered the substrate specificity due to differences in protein folding (15, 66).
In cardiomyocytes, the channel's native setting, HERG is presumably a relatively low-abundance protein compared to structural proteins, such as actin or myosin. In terms of translation dynamics and codon usage, there is a balance between translation rate and translation accuracy. In addition, the tRNA abundance is known to vary widely among human tissues (67). For highly expressed proteins with high turnover, translation rate would seem to be the more important determinant of high-abundance codon usage. Perhaps the sequence of native HERG has evolved with rare codons to allow for pausing cycles and favor greater accuracy instead of using abundant codons with faster translation. This idea would be supported by the many studies showing that HERG is fairly intolerant to mutations and that the majority of these mutations result in a misprocessing phenotype leading to LQTS (5–7).
In the present study, it is clear that multiple mechanisms contribute to the differences in protein expression and surface trafficking displayed by HERG-CM. This underscores the need for further work to determine the effects of synonymous SNPs on HERG expression and in LQT2 mutations. We predict that some synonymous SNPs may have a negative effect on HERG expression and trafficking, while others could perhaps have a positive effect and might improve HERG trafficking. Such mechanisms may explain the clinical phenotypic variation among LQTS mutations carriers. In terms of LQTS pathogenesis, this work highlights the utility of experimentally examining synonymous SNPs (sSNPs) and expanding existing mutation databases to include sSNPs.
Acknowledgments
The authors thank Drs. Charles Rubin, John Warner, and Umadas Maitra for thoughtful discussion and advice.
This work was supported in part by grants from the U.S. National Institutes of Health/National Heart, Lung, and Blood Institute (F30HL096279 to Y.K. and R01HL077929 to T.V.M.) and the American Heart Association (11GRNT5480008 to T.V.M.).
Footnotes
- CDSN
- corneodesmosin
- CFTR
- cystic fibrosis transmembrane conductance regulator
- DRD2
- dopamine receptor D2
- ER
- endoplasmic reticulum
- HERG
- human ether-à-go-go-related gene
- HERG-CM
- codon-modified human ether-à-go-go-related gene
- HERG-NT
- native human ether-à-go-go-related gene
- IKr
- rapidly activating delayed rectifier potassium current
- IVT
- in vitro translation
- KCNE1
- accessory subunit for slowly delayed rectifier potassium channel
- KCNQ1
- slowly delayed rectifier potassium channel
- LQTS
- long QT syndrome
- MDR1
- multidrug resistance gene 1
- ORF
- open reading frame
- PM
- plasma membrane
- ROI
- region of interest
- SCN5A
- cardiac voltage-gated sodium channel
- SNP
- single-nucleotide polymorphism
- UTR
- untranslated region
REFERENCES
- 1. Moss A. J., Kass R. S. (2005) Long QT syndrome: from channels to cardiac arrhythmias. J. Clin. Invest. 115, 2018–2024 [DOI] [PMC free article] [PubMed] [Google Scholar]
- 2. Goldenberg I., Moss A. J. (2008) Long QT syndrome. J. Am. Coll. Cardiol. 51, 2291–2300 [DOI] [PubMed] [Google Scholar]
- 3. Warmke J. W., Ganetzky B. (1994) A family of potassium channel genes related to eag in Drosophila and mammals. Proc. Natl. Acad. Sci. U. S. A. 91, 3438–3442 [DOI] [PMC free article] [PubMed] [Google Scholar]
- 4. Sanguinetti M. C., Jiang C., Curran M. E., Keating M. T. (1995) A mechanistic link between an inherited and an acquired cardiac arrhythmia: HERG encodes the IKr potassium channel. Cell 81, 299–307 [DOI] [PubMed] [Google Scholar]
- 5. Anderson C. L., Delisle B. P., Anson B. D., Kilby J. A., Will M. L., Tester D. J., Gong Q., Zhou Z., Ackerman M. J., January C. T. (2006) Most LQT2 mutations reduce Kv11.1 (hERG) current by a class 2 (trafficking-deficient) mechanism. Circulation 113, 365–373 [DOI] [PubMed] [Google Scholar]
- 6. Delisle B. P., Slind J. K., Kilby J. A., Anderson C. L., Anson B. D., Balijepalli R. C., Tester D. J., Ackerman M. J., Kamp T. J., January C. T. (2005) Intragenic suppression of trafficking-defective KCNH2 channels associated with long QT syndrome. Mol. Pharmacol. 68, 233–240 [DOI] [PubMed] [Google Scholar]
- 7. Thomas D., Kiehn J., Katus H. A., Karle C. A. (2003) Defective protein trafficking in hERG-associated hereditary long QT syndrome (LQT2): molecular mechanisms and restoration of intracellular protein processing. Cardiovasc. Res. 60, 235–241 [DOI] [PubMed] [Google Scholar]
- 8. Saenen J. B., Vrints C. J. (2008) Molecular aspects of the congenital and acquired Long QT syndrome: clinical implications. J. Mol. Cell. Cardiol. 44, 633–646 [DOI] [PubMed] [Google Scholar]
- 9. Schulze-Bahr E. (2008) Susceptibility genes and modifiers for cardiac arrhythmias. Progr. Biophys. Mol. Biol. 98, 289–300 [DOI] [PubMed] [Google Scholar]
- 10. Schwartz P. J. (2006) The congenital long QT syndromes from genotype to phenotype: clinical implications. J. Int. Med. 259, 39–47 [DOI] [PubMed] [Google Scholar]
- 11. Barc J., Briec F., Schmitt S., Kyndt F., Le Cunff M., Baron E., Vieyres C., Sacher F., Redon R., Le Caignec C., Le Marec H., Probst V., Schott J. J. (2011) Screening for copy number variation in genes associated with the long QT syndrome: clinical relevance. J. Am. Coll. Cardiol. 57, 40–47 [DOI] [PubMed] [Google Scholar]
- 12. Crotti L., Lundquist A. L., Insolia R., Pedrazzini M., Ferrandi C., De Ferrari G. M., Vicentini A., Yang P., Roden D. M., George A. L., Jr., Schwartz P. J. (2005) KCNH2-K897T is a genetic modifier of latent congenital long-QT syndrome. Circulation 112, 1251–1258 [DOI] [PubMed] [Google Scholar]
- 13. Sesti F., Abbott G. W., Wei J., Murray K. T., Saksena S., Schwartz P. J., Priori S. G., Roden D. M., George A. L., Jr., Goldstein S. A. (2000) A common polymorphism associated with antibiotic-induced cardiac arrhythmia. Proc. Natl. Acad. Sci. U. S. A. 97, 10613–10618 [DOI] [PMC free article] [PubMed] [Google Scholar]
- 14. Duan J., Wainwright M. S., Comeron J. M., Saitou N., Sanders A. R., Gelernter J., Gejman P. V. (2003) Synonymous mutations in the human dopamine receptor D2 (DRD2) affect mRNA stability and synthesis of the receptor. Hum. Mol. Genet. 12, 205–216 [DOI] [PubMed] [Google Scholar]
- 15. Kimchi-Sarfaty C., Oh J. M., Kim I. W., Sauna Z. E., Calcagno A. M., Ambudkar S. V., Gottesman M. M. (2007) A “silent” polymorphism in the MDR1 gene changes substrate specificity. Science 315, 525–528 [DOI] [PubMed] [Google Scholar]
- 16. Bartoszewski R. A., Jablonsky M., Bartoszewska S., Stevenson L., Dai Q., Kappes J., Collawn J. F., Bebok Z. (2010) A synonymous single nucleotide polymorphism in DeltaF508 CFTR alters the secondary structure of the mRNA and the expression of the mutant protein. J. Biol. Chem. 285, 28741–28748 [DOI] [PMC free article] [PubMed] [Google Scholar]
- 17. Capon F., Allen M. H., Ameen M., Burden A. D., Tillman D., Barker J. N., Trembath R. C. (2004) A synonymous SNP of the corneodesmosin gene leads to increased mRNA stability and demonstrates association with psoriasis across diverse ethnic groups. Hum. Mol. Genet. 13, 2361–2368 [DOI] [PubMed] [Google Scholar]
- 18. Delisle B. P., Anderson C. L., Balijepalli R. C., Anson B. D., Kamp T. J., January C. T. (2003) Thapsigargin selectively rescues the trafficking defective LQT2 channels G601S and F805C. J. Biol. Chem. 278, 35749–35754 [DOI] [PubMed] [Google Scholar]
- 19. Wang X., Venable J., LaPointe P., Hutt D. M., Koulov A. V., Coppinger J., Gurkan C., Kellner W., Matteson J., Plutner H., Riordan J. R., Kelly J. W., Yates J. R., 3rd, Balch W. E. (2006) Hsp90 cochaperone Aha1 downregulation rescues misfolding of CFTR in cystic fibrosis. Cell 127, 803–815 [DOI] [PubMed] [Google Scholar]
- 20. Banasavadi-Siddegowda Y. K., Mai J., Fan Y., Bhattacharya S., Giovannucci D. R., Sanchez E. R., Fischer G., Wang X. (2011) FKBP38 peptidylprolyl isomerase promotes the folding of cystic fibrosis transmembrane conductance regulator in the endoplasmic reticulum. J. Biol. Chem. 286, 43071–43080 [DOI] [PMC free article] [PubMed] [Google Scholar]
- 21. Nakamura Y., Gojobori T., Ikemura T. (2000) Codon usage tabulated from international DNA sequence databases: status for the year 2000. Nucleic Acids Res. 28, 292. [DOI] [PMC free article] [PubMed] [Google Scholar]
- 22. Gasteiger E., Gattiker A., Hoogland C., Ivanyi I., Appel R. D., Bairoch A. (2003) ExPASy: The proteomics server for in-depth protein knowledge and analysis. Nucleic Acids Res. 31, 3784–3788 [DOI] [PMC free article] [PubMed] [Google Scholar]
- 23. Rice P., Longden I., Bleasby A. (2000) EMBOSS: the European Molecular Biology Open Software Suite. Trends Genet. 16, 276–277 [DOI] [PubMed] [Google Scholar]
- 24. Li L. C., Dahiya R. (2002) MethPrimer: designing primers for methylation PCRs. Bioinformatics 18, 1427–1431 [DOI] [PubMed] [Google Scholar]
- 25. Li Y., Sroubek J., Krishnan Y., McDonald T. V. (2008) A-kinase anchoring protein targeting of protein kinase A and regulation of HERG channels. J. Membr. Biol. 223, 107–116 [DOI] [PMC free article] [PubMed] [Google Scholar]
- 26. McDonald T. V., Yu Z., Ming Z., Palma E., Meyers M. B., Wang K. W., Goldstein S. A., Fishman G. I. (1997) A minK-HERG complex regulates the cardiac potassium current I(Kr). Nature 388, 289–292 [DOI] [PubMed] [Google Scholar]
- 27. Li Q., Lau A., Morris T. J., Guo L., Fordyce C. B., Stanley E. F. (2004) A syntaxin 1, Galpha(o), and N-type calcium channel complex at a presynaptic nerve terminal: analysis by quantitative immunocolocalization. J. Neurosci. 24, 4070–4081 [DOI] [PMC free article] [PubMed] [Google Scholar]
- 28. Abramoff M. D., Magelhaes P. J., Ram S. J. (2004) Image Processing with ImageJ. Biophot. Int. 11, 36–42 [Google Scholar]
- 29. Rasband W. S. (1997–2011) ImageJ, U.S. National Institutes of Health, Bethesda, MD, USA; http://imagej.nih.gov/ij [Google Scholar]
- 30. Hurt C. M., Feng F. Y., Kobilka B. (2000) Cell-type specific targeting of the alpha 2c-adrenoceptor. Evidence for the organization of receptor microdomains during neuronal differentiation of PC12 cells. J. Biol. Chem. 275, 35424–35431 [DOI] [PubMed] [Google Scholar]
- 31. Chen J., Sroubek J., Krishnan Y., Li Y., Bian J., McDonald T. V. (2009) PKA phosphorylation of HERG protein regulates the rate of channel synthesis. Am. J. Physiol. Heart Circ. Physiol. 296, H1244–H1254 [DOI] [PMC free article] [PubMed] [Google Scholar]
- 32. Lu J., Deutsch C. (2008) Electrostatics in the ribosomal tunnel modulate chain elongation rates. J. Mol. Biol. 384, 73–86 [DOI] [PMC free article] [PubMed] [Google Scholar]
- 33. Krishnan Y., Li Y., Zheng R., Kanda V., McDonald T. V. (2012) Mechanisms underlying the protein-kinase mediated regulation of the HERG potassium channel synthesis. Biochim Biophys Acta 1823, 1273–1284 [DOI] [PMC free article] [PubMed] [Google Scholar]
- 34. Zumwalt M., Ludwig A., Hagerman P. J., Dieckmann T. (2007) Secondary structure and dynamics of the r(CGG) repeat in the mRNA of the fragile X mental retardation 1 (FMR1) gene. RNA Biol 4, 93–100 [DOI] [PubMed] [Google Scholar]
- 35. Sobczak K., de Mezer M., Michlewski G., Krol J., Krzyzosiak W. J. (2003) RNA structure of trinucleotide repeats associated with human neurological diseases. Nucleic Acids Res. 31, 5469–5482 [DOI] [PMC free article] [PubMed] [Google Scholar]
- 36. Handa V., Saha T., Usdin K. (2003) The fragile X syndrome repeats form RNA hairpins that do not activate the interferon-inducible protein kinase, PKR, but are cut by Dicer. Nucleic Acids Res. 31, 6243–6248 [DOI] [PMC free article] [PubMed] [Google Scholar]
- 37. Gruber A. R., Lorenz R., Bernhart S. H., Neubock R., Hofacker I. L. (2008) The Vienna RNA websuite. Nucleic Acids Res. 36, W70–W74 [DOI] [PMC free article] [PubMed] [Google Scholar]
- 38. Zhang G., Hubalewska M., Ignatova Z. (2009) Transient ribosomal attenuation coordinates protein synthesis and co-translational folding. Nat. Struct. Mol. Biol. 16, 274–280 [DOI] [PubMed] [Google Scholar]
- 39. Lander E. S., Linton L. M., Birren B., Nusbaum C., Zody M. C., Baldwin J., Devon K., Dewar K., Doyle M., FitzHugh W., Funke R., Gage D., Harris K., Heaford A., Howland J., Kann L., Lehoczky J., LeVine R., McEwan P., McKernan K., Meldrim J., Mesirov J. P., Miranda C., Morris W., Naylor J., Raymond C., Rosetti M., Santos R., Sheridan A., Sougnez C., Stange-Thomann N., Stojanovic N., Subramanian A., Wyman D., Rogers J., Sulston J., Ainscough R., Beck S., Bentley D., Burton J., Clee C., Carter N., Coulson A., Deadman R., Deloukas P., Dunham A., Dunham I., Durbin R., French L., Grafham D., Gregory S., Hubbard T., Humphray S., Hunt A., Jones M., Lloyd C., McMurray A., Matthews L., Mercer S., Milne S., Mullikin J. C., Mungall A., Plumb R., Ross M., Shownkeen R., Sims S., Waterston R. H., Wilson R. K., Hillier L. W., McPherson J. D., Marra M. A., Mardis E. R., Fulton L. A., Chinwalla A. T., Pepin K. H., Gish W. R., Chissoe S. L., Wendl M. C., Delehaunty K. D., Miner T. L., Delehaunty A., Kramer J. B., Cook L. L., Fulton R. S., Johnson D. L., Minx P. J., Clifton S. W., Hawkins T., Branscomb E., Predki P., Richardson P., Wenning S., Slezak T., Doggett N., Cheng J. F., Olsen A., Lucas S., Elkin C., Uberbacher E., Frazier M., Gibbs R. A., Muzny D. M., Scherer S. E., Bouck J. B., Sodergren E. J., Worley K. C., Rives C. M., Gorrell J. H., Metzker M. L., Naylor S. L., Kucherlapati R. S., Nelson D. L., Weinstock G. M., Sakaki Y., Fujiyama A., Hattori M., Yada T., Toyoda A., Itoh T., Kawagoe C., Watanabe H., Totoki Y., Taylor T., Weissenbach J., Heilig R., Saurin W., Artiguenave F., Brottier P., Bruls T., Pelletier E., Robert C., Wincker P., Smith D. R., Doucette-Stamm L., Rubenfield M., Weinstock K., Lee H. M., Dubois J., Rosenthal A., Platzer M., Nyakatura G., Taudien S., Rump A., Yang H., Yu J., Wang J., Huang G., Gu J., Hood L., Rowen L., Madan A., Qin S., Davis R. W., Federspiel N. A., Abola A. P., Proctor M. J., Myers R. M., Schmutz J., Dickson M., Grimwood J., Cox D. R., Olson M. V., Kaul R., Shimizu N., Kawasaki K., Minoshima S., Evans G. A., Athanasiou M., Schultz R., Roe B. A., Chen F., Pan H., Ramser J., Lehrach H., Reinhardt R., McCombie W. R., de la Bastide M., Dedhia N., Blocker H., Hornischer K., Nordsiek G., Agarwala R., Aravind L., Bailey J. A., Bateman A., Batzoglou S., Birney E., Bork P., Brown D. G., Burge C. B., Cerutti L., Chen H. C., Church D., Clamp M., Copley R. R., Doerks T., Eddy S. R., Eichler E. E., Furey T. S., Galagan J., Gilbert J. G., Harmon C., Hayashizaki Y., Haussler D., Hermjakob H., Hokamp K., Jang W., Johnson L. S., Jones T. A., Kasif S., Kaspryzk A., Kennedy S., Kent W. J., Kitts P., Koonin E. V., Korf I., Kulp D., Lancet D., Lowe T. M., McLysaght A., Mikkelsen T., Moran J. V., Mulder N., Pollara V. J., Ponting C. P., Schuler G., Schultz J., Slater G., Smit A. F., Stupka E., Szustakowski J., Thierry-Mieg D., Thierry-Mieg J., Wagner L., Wallis J., Wheeler R., Williams A., Wolf Y. I., Wolfe K. H., Yang S. P., Yeh R. F., Collins F., Guyer M. S., Peterson J., Felsenfeld A., Wetterstrand K. A., Patrinos A., Morgan M. J., de Jong P., Catanese J. J., Osoegawa K., Shizuya H., Choi S., Chen Y. J. (2001) Initial sequencing and analysis of the human genome. Nature 409, 860–921 [DOI] [PubMed] [Google Scholar]
- 40. Merchant S. S., Prochnik S. E., Vallon O., Harris E. H., Karpowicz S. J., Witman G. B., Terry A., Salamov A., Fritz-Laylin L. K., Marechal-Drouard L., Marshall W. F., Qu L. H., Nelson D. R., Sanderfoot A. A., Spalding M. H., Kapitonov V. V., Ren Q., Ferris P., Lindquist E., Shapiro H., Lucas S. M., Grimwood J., Schmutz J., Cardol P., Cerutti H., Chanfreau G., Chen C. L., Cognat V., Croft M. T., Dent R., Dutcher S., Fernandez E., Fukuzawa H., Gonzalez-Ballester D., Gonzalez-Halphen D., Hallmann A., Hanikenne M., Hippler M., Inwood W., Jabbari K., Kalanon M., Kuras R., Lefebvre P. A., Lemaire S. D., Lobanov A. V., Lohr M., Manuell A., Meier I., Mets L., Mittag M., Mittelmeier T., Moroney J. V., Moseley J., Napoli C., Nedelcu A. M., Niyogi K., Novoselov S. V., Paulsen I. T., Pazour G., Purton S., Ral J. P., Riano-Pachon D. M., Riekhof W., Rymarquis L., Schroda M., Stern D., Umen J., Willows R., Wilson N., Zimmer S. L., Allmer J., Balk J., Bisova K., Chen C. J., Elias M., Gendler K., Hauser C., Lamb M. R., Ledford H., Long J. C., Minagawa J., Page M. D., Pan J., Pootakham W., Roje S., Rose A., Stahlberg E., Terauchi A. M., Yang P., Ball S., Bowler C., Dieckmann C. L., Gladyshev V. N., Green P., Jorgensen R., Mayfield S., Mueller-Roeber B., Rajamani S., Sayre R. T., Brokstein P., Dubchak I., Goodstein D., Hornick L., Huang Y. W., Jhaveri J., Luo Y., Martinez D., Ngau W. C., Otillar B., Poliakov A., Porter A., Szajkowski L., Werner G., Zhou K., Grigoriev I. V., Rokhsar D. S., Grossman A. R. (2007) The Chlamydomonas genome reveals the evolution of key animal and plant functions. Science 318, 245–250 [DOI] [PMC free article] [PubMed] [Google Scholar]
- 41. Bernardi G. (2000) Isochores and the evolutionary genomics of vertebrates. Gene 241, 3–17 [DOI] [PubMed] [Google Scholar]
- 42. Romiguier J., Ranwez V., Douzery E. J., Galtier N. (2010) Contrasting GC-content dynamics across 33 mammalian genomes: relationship with life-history traits and chromosome sizes. Genome Res. 20, 1001–1009 [DOI] [PMC free article] [PubMed] [Google Scholar]
- 43. Fullerton S. M., Bernardo Carvalho A., Clark A. G. (2001) Local rates of recombination are positively correlated with GC content in the human genome. Mol. Biol. Evol. 18, 1139–1142 [DOI] [PubMed] [Google Scholar]
- 44. Zhou Z., Gong Q., Epstein M. L., January C. T. (1998) HERG channel dysfunction in human long QT syndrome. Intracellular transport and functional defects. J. Biol. Chem. 273, 21061–21066 [DOI] [PubMed] [Google Scholar]
- 45. Kozak M. (2005) Regulation of translation via mRNA structure in prokaryotes and eukaryotes. Gene 361, 13–37 [DOI] [PubMed] [Google Scholar]
- 46. Buchan J. R., Stansfield I. (2007) Halting a cellular production line: responses to ribosomal pausing during translation. Biol. Cell 99, 475–487 [DOI] [PubMed] [Google Scholar]
- 47. Komar A. A. (2009) A pause for thought along the co-translational folding pathway. Trends Biochem. Sci. 34, 16–24 [DOI] [PubMed] [Google Scholar]
- 48. De Smit M. H., van Duin J. (1990) Secondary structure of the ribosome binding site determines translational efficiency: a quantitative analysis. Proc. Natl. Acad. Sci. U. S. A. 87, 7668–7672 [DOI] [PMC free article] [PubMed] [Google Scholar]
- 49. Takyar S., Hickerson R. P., Noller H. F. (2005) mRNA helicase activity of the ribosome. Cell 120, 49–58 [DOI] [PubMed] [Google Scholar]
- 50. Wen J. D., Lancaster L., Hodges C., Zeri A. C., Yoshimura S. H., Noller H. F., Bustamante C., Tinoco I. (2008) Following translation by single ribosomes one codon at a time. Nature 452, 598–603 [DOI] [PMC free article] [PubMed] [Google Scholar]
- 51. Ikemura T. (1982) Correlation between the abundance of yeast transfer RNAs and the occurrence of the respective codons in protein genes. Differences in synonymous codon choice patterns of yeast and Escherichia coli with reference to the abundance of isoaccepting transfer RNAs. J. Mol. Biol. 158, 573–597 [DOI] [PubMed] [Google Scholar]
- 52. Sharp P. M., Cowe E., Higgins D. G., Shields D. C., Wolfe K. H., Wright F. (1988) Codon usage patterns in Escherichia coli, Bacillus subtilis, Saccharomyces cerevisiae, Schizosaccharomyces pombe, Drosophila melanogaster and Homo sapiens; a review of the considerable within-species diversity. Nucleic Acids Res. 16, 8207–8211 [DOI] [PMC free article] [PubMed] [Google Scholar]
- 53. Saunders R., Deane C. M. (2010) Synonymous codon usage influences the local protein structure observed. Nucleic Acids Res. 38, 6719–6728 [DOI] [PMC free article] [PubMed] [Google Scholar]
- 54. Varenne S., Buc J., Lloubes R., Lazdunski C. (1984) Translation is a non-uniform process. Effect of tRNA availability on the rate of elongation of nascent polypeptide chains. J. Mol. Biol. 180, 549–576 [DOI] [PubMed] [Google Scholar]
- 55. Komar A. A., Lesnik T., Reiss C. (1999) Synonymous codon substitutions affect ribosome traffic and protein folding during in vitro translation. FEBS Lett. 462, 387–391 [DOI] [PubMed] [Google Scholar]
- 56. Fraser C. S. (2009) The molecular basis of translational control. Progr. Mol. Biol. Trans. Sci. 90, 1–51 [DOI] [PubMed] [Google Scholar]
- 57. Mahoney S. J., Dempsey J. M., Blenis J. (2009) Cell signaling in protein synthesis ribosome biogenesis and translation initiation and elongation. Progr. Mol. Biol. Trans. Sci. 90, 53–107 [DOI] [PubMed] [Google Scholar]
- 58. Wan Y., Kertesz M., Spitale R. C., Segal E., Chang H. Y. (2011) Understanding the transcriptome through RNA structure. Nat. Rev. Genet. 12, 641–655 [DOI] [PMC free article] [PubMed] [Google Scholar]
- 59. Bartel D. P. (2009) MicroRNAs: target recognition and regulatory functions. Cell 136, 215–233 [DOI] [PMC free article] [PubMed] [Google Scholar]
- 60. Filipowicz W., Bhattacharyya S. N., Sonenberg N. (2008) Mechanisms of post-transcriptional regulation by microRNAs: are the answers in sight? Nat. Rev. Genet. 9, 102–114 [DOI] [PubMed] [Google Scholar]
- 61. Pager C. T., Wehner K. A., Fuchs G., Sarnow P. (2009) MicroRNA-mediated gene silencing. Progr. Mol. Biol. Trans. Sci. 90, 187–210 [DOI] [PubMed] [Google Scholar]
- 62. Kudla G., Lipinski L., Caffin F., Helwak A., Zylicz M. (2006) High guanine and cytosine content increases mRNA levels in mammalian cells. PLoS Biol. 4, e180. [DOI] [PMC free article] [PubMed] [Google Scholar]
- 63. Ficker E., Dennis A. T., Wang L., Brown A. M. (2003) Role of the cytosolic chaperones Hsp70 and Hsp90 in maturation of the cardiac potassium channel HERG. Circ. Res. 92, e87–e100 [DOI] [PubMed] [Google Scholar]
- 64. Walker V. E., Wong M. J., Atanasiu R., Hantouche C., Young J. C., Shrier A. (2010) Hsp40 chaperones promote degradation of the HERG potassium channel. J. Biol. Chem. 285, 3319–3329 [DOI] [PMC free article] [PubMed] [Google Scholar]
- 65. Walker V. E., Atanasiu R., Lam H., Shrier A. (2007) Co-chaperone FKBP38 promotes HERG trafficking. J. Biol. Chem. 282, 23509–23516 [DOI] [PubMed] [Google Scholar]
- 66. Sauna Z. E., Kimchi-Sarfaty C. (2011) Understanding the contribution of synonymous mutations to human disease. Nat. Rev. Genet. 12, 683–691 [DOI] [PubMed] [Google Scholar]
- 67. Dittmar K. A., Goodenbour J. M., Pan T. (2006) Tissue-specific differences in human transfer RNA expression. PLoS Genet. 2, e221. [DOI] [PMC free article] [PubMed] [Google Scholar]