

Abstract
It is a challenging task to characterize the biodistribution of nanoparticles in cells and tissue on a subcellular level. Conventional methods to study the interaction of nanoparticles with living cells rely on labeling techniques that either selectively stain the particles or selectively tag them with tracer molecules. In this work, Raman imaging, a label-free technique that requires no extensive sample preparation, was combined with multivariate classification to quantify the spatial distribution of oxide nanoparticles inside living lung epithelial cells (A549). Cells were exposed to TiO2 (titania) and/or α-FeO(OH) (goethite) nanoparticles at various incubation times (4 or 48 h). Using multivariate classification of hyperspectral Raman data with partial least-squares discriminant analysis, we show that a surprisingly large fraction of spectra, classified as belonging to the cell nucleus, show Raman bands associated with nanoparticles. Up to 40% of spectra from the cell nucleus show Raman bands associated with nanoparticles. Complementary transmission electron microscopy data for thin cell sections qualitatively support the conclusions.
Introduction
The innovative and economic potential of engineered nanomaterials is threatened by a limited understanding of their impact on the environment and health (1,2). Due to their small size, small nanoparticles from pulmonary exposure may deposit deep within the lung and penetrate lung epithelial cells. Iron oxide nanoparticles have been reported to transfer from the epithelium to blood and tissues, including liver, kidneys, and spleen (3). In general, the migration from the lung can take several routes, such as direct transfer into blood over tissue barriers (alveolar/blood vessel interface), or via immune cell uptake (e.g., macrophage phagocytosis) and the lymphatic circulation (4). Exposure to nanoparticles can affect both the acquired (adaptive) and innate immune systems (5). It has been shown that one intratracheal instillation of TiO2 nanoparticles exacerbates airway inflammation in a rat strain that represents susceptible individuals with immune-mediated inflammatory diseases, which indicates that inhalation of TiO2 nanoparticles may cause a long-lasting immune response in sensitive individuals (6). Inhaled nanoparticles can also cause cardiovascular effects, such as increased coagulation, either directly in the blood after transfer or indirectly via pulmonary inflammation, leading to increased systemic levels of cytokines and prothrombotic factors (7). Nanotoxicology has appeared as a new research discipline in the wake of these developments to deal with health issues associated with nanomaterials (4). However, studies have shown that the special characteristics associated with nanoparticles, such as their size, shape, and surface properties, can lead to new risks, which need to be addressed (8–11).
To understand the toxicity of nanoparticles, we need to accurately measure how they are distributed in the body after exposure, and how they interact with pertinent organs and cells (12). Ideally, biodistribution studies should be performed in vivo, but in vitro models are often needed for ethical and practical reasons (12). An important issue is to determine whether nanoparticles cross biological barriers (12,13), which may entail genotoxic effects through mechanical interference with cellular components such as nucleosomes (14). Biodistribution studies are also important in drug-delivery and diagnostic research, where great efforts are being made to guide drugs to the right location in the body.
The most common method for studying biodistribution in cells exposed to particles at high magnification is transmission electron microscopy (TEM). TEM analysis is intrusive and requires extensive sample preparation, and manual inspection to distinguish nanoparticles from naturally occurring cell structures. Fluorescence microscopy and confocal light microscopy are powerful techniques for studying biodistribution, but they require intrinsically fluorescent nanoparticles or fluorescence-labeled nanoparticles, and the cells are usually stained (12). These methods often require extensive sample preparation, and labeling is intrusive in the sense that it intrinsically modifies the surface properties of the nanoparticles, which may lead to biased results. There is a growing awareness that particles can interact with the dyes used in conventional cell assays (12,15–17). Similarly, attaching labeling molecules to the surfaces of nanoparticles may alter their surface chemical properties, agglomeration state, etc., and hence alter their intrinsic bio-response (12). It is therefore necessary to develop new, label-free techniques that complement these well-established methods. Raman spectroscopy is a label-free technique that has the potential to be used for nanoparticle-uptake studies (18,19).
Various types of Raman spectroscopy techniques have been used to analyze the spatial distribution of chemicals in fields such as cancer diagnostics (20), plant science (21), and archeology (22). Much of the interest in these techniques lies in the possibility to develop methods for automated and label-free analysis of complex samples, such as cells (23–25) or tissues (26). In Raman microspectroscopy, commonly called Raman imaging, a lateral resolution down to 1 μm can be obtained, and although the depth resolution is generally lower (typically at least a factor of 2 worse than in the focal plane), it can be reduced by the use of appropriate lenses and laser beam focusing assembly (27). The Raman spectra give a chemical fingerprint of the chemical composition in the measurement point, and provide information about both biomolecules (the fundamental molecular vibrations due to proteins, lipids and nucleic acid in the finger print region) (28) and solid particles (the lattice vibrations in the far- to mid-infrared region) simultaneously (19). In contrast to conventional staining techniques, one can analyze the Raman fingerprint spectra using multivariate classification methods to obtain information about the spatial location of organelles within the cell (25). The simultaneous information about the presence of nanoparticles makes Raman imaging a label-free method, which potentially can be used for automated and unbiased studies of the biodistribution of nanoparticles in cells and tissues.
Here, we used hyperspectral Raman imaging in combination with multivariate classification to quantify the distribution of nanoparticles in living cells by collecting hyperspectral images of cells (19). Cells were exposed to a 80:20 mixture of anatase-phase and rutile-phase TiO2 (titania) nanoparticles and α-FeO(OH) (goethite) nanorods. In contrast to the rutile-phase TiO2, the anatase phase was associated with oxidative stress and inflammatory response in several recent studies (6,19,29). Similarly, α-FeO(OH), which is a common mineral found in the earth’s crust, was shown to induce cytotoxic effects in human glioma cells (30). We found that both types of nanoparticles were present in the nuclei of living cells after exposure to modest nanoparticle concentrations in cell media (10 μg ml−1), which is pertinent to many exposure situations (4,31). In contrast to many previous studies (32–34), we employed a wide range of exposure times (4–48 h).
Materials and Methods
Nanoparticles
Powder of titanium dioxide (TiO2) nanoparticles was obtained from Degussa AG (Germany). Goethite (α-FeO(OH)) nanoparticles were prepared and characterized as previously described by Boily et al. (35). The anatase titania nanoparticles have a truncated tetragonal bipyramidal morphology, whereas the goethite nanoparticles exhibit a rod-shaped morphology. The physical properties of the TiO2 and α-FeO(OH) nanoparticles have been reported in detail in previous publications (19,36,37). In addition, the agglomerate size in suspensions with 10 μg ml−1 nanoparticles in cell medium supplemented with serum was determined by photon cross-correlation spectroscopy (PCCS) using a Nanophox PCCS instrument (Sympatec, Germany), and analyzed with the built-in auto-nonnegative least-squares algorithm. Measurements were performed immediately after preparation, as well as after 3 min of sonication. The presented values are the mean values of at least three measurements. A compilation of these results is shown in Table 1. We found that in cell media, the TiO2 nanoparticles form agglomerates with a bimodal size distribution with peaks centered at ∼110 nm and 2.2 μm, where the dominant contribution is from the larger size fraction. A similar bimodal distribution was found for α-FeO(OH). Sonication breaks the agglomerates apart, and the size-distribution plots exhibit peaks centered at 18 nm and 190 nm for α-FeO(OH), whereas the peaks for TiO2 are centered at 28 nm and 290 nm. The small size distributions correspond well with the primary particle sizes of TiO2 and α-FeO(OH) (19,36). However, the dominant contributions are again from the larger-sized fractions.
Table 1.
Physicochemical properties of the nanoparticles used in this study
| Nanoparticle | Specific surface area (m2g−1) | dXRD (nm) | dTEM (nm) | DPCCS (nm)f | pHIEP |
|---|---|---|---|---|---|
| TiO2 | 50 | 21a | 20–80 | 110, 2200 (28, 290) | 6.3 |
| α-FeO(OH) | 100 | 8.1b, 31.8c | 11d, 62e | 110, 1800 (18, 190) | 9.4 |
Primary grain size determined from Scherrer analysis of the <101> diffraction peak in XRD.
Average primary size determined from the <110> reflection in XRD.
Average primary size determined from the <002> reflection in XRD.
Average height and width and width of the rod-shaped primary particles determined from TEM.
Average length of the long axis determined from TEM.
DPCCS denotes agglomerate particle size measured with photon cross-correlation spectroscopy. Multiple numbers indicate multimodal distributions. Boldface numbers indicate the most abundant mode. Agglomerate size after sonication is indicated in parentheses.
Cell preparations
A549 lung epithelial cells (ATCC CCL-185; American Type Culture Collection) were cultured in RPMI-1640 supplemented with 10% fetal calf serum and 50 μg ml−1 gentamicin at 37°C in a humidified atmosphere with 5% CO2. The cells were seeded at a density of 5 × 10⁴ cells/ml−1 onto CaF2 substrates in 12-well culture plates, and allowed to attach overnight before they were exposed to nanoparticles. Stock solutions of 1 mg ml−1 nanoparticles in phosphate-buffered saline (PBS) pH 7.2 were prepared and sonicated using an ultrasonic processor operating at 4 W for 3 min, and then further diluted to 10 μg ml−1 in cell medium. After 4 h or 48 h incubation with nanoparticle solutions, cell cultures were washed five times with 1 ml PBS to remove detachable nanoparticles. Thereafter, the CaF2 substrates with cell layers were transferred to glass Petri dishes containing PBS before Raman spectroscopy was performed. For TEM, cells were fixed with 2.5% glutaraldehyde in sodium cacodylate buffer (0.1 M), washed with buffer, postfixed in 1% osmium tetroxide, and embedded in Spurr resin before sectioning, according to standard procedures.
Raman spectroscopy and TEM
Raman spectra of particle-exposed cells were collected in the 100–1800 cm−1 spectral region with a Horiba JobinYvon HR 800 UV confocal Raman microspectroscope using a continuous Ar ion excitation laser (λ = 514 nm). A 600 grooves mm−1 grating and a thermoelectric air-cooled CCD detector were used in all measurements. A 60× (NA = 0.9) water immersion objective, immersed in the PBS solutions, was used to focus the laser light onto the sample and collect the 180° backscattered light. The laser irradiation power was kept as high as possible without causing damage to cells (≈12 mW). Normal cells, adherent to the substrate, were selected randomly for analysis. Each cell, exposed for particles for 48 h, was mapped at 16 spots in 4 × 4 measurement grids evenly spread in fixed mapping planes (Fig. 1). Raman spectra were acquired for 3 × 90 s in each of the 16 grid points. The confocal hole was set to 150 μm, which theoretically yields a 4.5 μm lateral resolution. By using a relatively large measurement volume (higher than what is possible with our experimental setup), one can detect Raman signal from a larger number of nanoparticles distributed with the voxel with a good signal/noise ratio. The separation of the 4 × 4 measurement grid points was chosen to be 3.5 μm. Raman mapping was performed on 15 cells exposed to α-FeO(OH), 11 cells exposed to TiO2, 11 cells exposed to a mixture of α-FeO(OH) and TiO2, and 10 control cells that were not exposed to nanoparticles.
Figure 1.
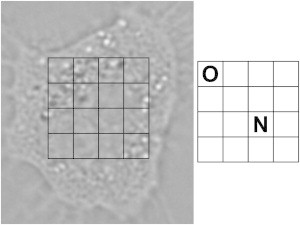
Example of an optical micrograph of an A549 cell, with the measurement grid overlaid. Spots marked by O (outside cell nucleus) or N (nucleus) are included in the PLS-DA model.
Single-point measurements were made inside the cell nuclei of cells exposed to TiO2 nanoparticles for 4 h. These measurements were done with a smaller confocal hole (100 μm, which corresponds to a lateral resolution of ∼3.4 μm) and longer scan time (10×1 min) to enhance the signal. The much longer measurement time prohibited us from using a grid approach similar to that discussed above. In total, 26 cells were measured in this way.
The positioning of the laser beam was guided by analysis of the C-H deformation mode at 1450 cm−1 due to proteins and lipids, which typically exhibits a strong signal inside cells. All spectra with Raman intensity higher than 100 cps at 1450 cm−1 were considered to originate from the cell and included in the data set for further analysis.
For TEM experiments, 80 nm sections of cells were contrasted with uranyl acetate and lead citrate, and analyzed with a Jeol 1230 transmission electron microscope as described elsewhere (19). Digital images were captured using a Gatan MSC 600CW camera and analyzed with ImageJ software (38).
Multivariate classification
Partial least-squares discriminant analysis (PLS-DA) of Raman spectra was used to determine whether the Raman spectra originated from the cell nucleus or outside the cell nucleus (39). The analysis was performed in the 760–1750 cm−1 fingerprint region, where spectral signatures from the TiO2 and α-FeO(OH) nanoparticles do not interfere. PLS-DA was performed on mean centered spectra using SIMCA-P+ (40) after a background correction algorithm (41) was employed in the R software (42). All spectra were frequency shifted so that the well-defined peak around 1005 cm−1 due to phenylalanine (Phe) ring breathing had its maximum exactly at 1005 cm−1. The PLS-DA model was trained with spectra with known spatial location, as determined from corresponding micrographs. Examples of measurement points that were considered to be measurements from the cell nucleus and outside the cell nucleus, respectively, are shown in Fig. 1. The PLS-DA model was trained with 80 spectra (42 from inside the cell nucleus and 38 from outside the cell nucleus).
PLS-DA is a multivariate method whereby the dimensions in data are reduced by projecting data onto a new variable space (43). The data are arranged in a X matrix, which contains the independent variables (in this case, spectra) and a Y matrix, which contains the dependent variables (in this case, binary information of class membership) and decomposed to X = TPT + E and Y = UCT + G (where E and G are residuals, T and U are new variables (i.e., scores), P is a loading matrix, and C is weights) (43). The decomposition is made so that TPT will be a good predictor for X, and TCT will be a good predictor of Y (43). In this way, a linear regression model is constructed that can be used for prediction of class membership (39). In this case, all measurements with a predicted value of 0.65–1.35 for either group were classified as measurements from cell nucleus or outside cell nucleus, respectively. Applying PLS-DA, the information from the original variables (574 spectral data points) is summarized by new, much fewer variables. The model dimensions (i.e., the number of components) must be selected carefully. We calculated four PLS components, since the other components mainly contained noise, as determined from weight plots. The PLS-DA model was evaluated by cross-validation and thereafter used to classify all measurements by prediction of class membership.
Results and Discussion
Multivariate classification
The hyperspectral Raman images consist of voxels defined by the pixel resolution in xy-space (imaging plane) and the z-resolution (depth) of the confocal imaging plane, and the Raman spectra in each of these voxels (19,23). Here, we used a supervised PLS-DA (19) based on the fingerprint region of spectra from the hyperspectral images to automatically and unbiasedly determine which voxels originated from the cell nucleus and outside the cell nucleus (cytoplasmic region), respectively. The cell nucleus is the largest organelle within the cell, and because the spatial resolution is set relatively low in the experiments (to improve the signal/noise ratio in Raman spectra within a sufficiently short acquisition time), we cannot expect to find spectral signatures that can help discern smaller organelles.
In addition to hyperspectral images, spatial information is also available from optical micrographs. However, it is problematic to compare optical micrographs directly with the corresponding hyperspectral images because micrographs only provide a two-dimensional image, whereas each voxel in the hyperspectral images represents a sample volume. This also means that it is not straightforward to pick out the training set for a multivariate analysis, because we cannot directly translate micrographs to sample volumes in the hyperspectral images. In addition, some voxels can be expected to originate from volumes with overlapping information from the nucleus, the nuclear membrane region, and the cytoplasmic region. However, by examining the micrographs and comparing them with the superimposed measurement grids, we can unambiguously identify measurements that originate only from the nucleus or the area outside the nucleus, respectively (see example in Fig. 1). These measurements constitute our training set.
The score plot in Fig. 2 a shows the training set plotted on the first two score vectors. As visualized in Fig. 2 a, there is a trend that most of the spectra from the cell nucleus group have negative values on the first score vector. By interpreting the weights in Fig. 2 b, we can identify spectral patterns that are associated with the groups in the score plot. Comprehensive data and mode assignments of the molecular vibrations in the spectral region are well documented in the literature, and it is possible to make accurate assignments of the major bands (28). As visualized in Fig. 2 b, Raman bands at 782–788 cm−1 (the ν(O-P-O) mode in DNA/RNA), 1005 cm−1 (the symmetric ring breathing mode due to Phe), 1095 cm−1 (DNA/RNA, C-C stretches in lipids and carbohydrates), and 1680 cm−1 contribute to negative values in the first score vector, whereas bands at 1297 cm−1, 1312 cm−1, 1361 cm−1, 1438 cm−1, and 1589 cm−1 contribute to positive values. Spectral differences can also be visualized in difference plots. The mean spectra and standard deviations (SDs) for the predicted groups are shown in Fig. 3, along with a plot that illustrates the 95% confidence interval (CI) for the difference in means. Both the cell nucleus and the area outside the cell nucleus exhibit Raman signatures from a broad class of proteins. Therefore, most of the spectral information contained in the fingerprint region associated with proteins is not specific to the cell nucleus. In contrast, DNA is present only in the nucleus. The difference plot shows that spectra assigned to the cell nucleus group have pronounced Raman bands located at 788 cm−1 (the ν(O-P-O) mode in DNA/RNA), 1005 cm−1 (the symmetric ring breathing mode due to Phe), 1099 cm−1, 1345 cm−1, 1492 cm−1, and 1682 cm−1 (carboxylic-acid-derived bands) as compared with spectra assigned to the cytoplasmic (and/or lipid membrane) region. On the other hand, the group belonging to the region outside the cell nucleus has stronger Raman signal in the region between 1290–1314 cm−1 (CH2 twisting in lipids), 1438 cm−1 (CH deformations in lipds) and 1594 cm−1. The PLS weights (Fig. 2 b) and the difference plot (Fig. 3 c) show that the cell nucleus and cytoplasm have spectral patterns that can be used for classification. Some Raman bands have a significant difference between the two groups. However, it is difficult to set a reliable threshold level for only one Raman band. In contrast, PLS-DA uses the whole spectral range in the fingerprint area to unbiasedly and automatically predict the class membership of unknown spectra.
Figure 2.
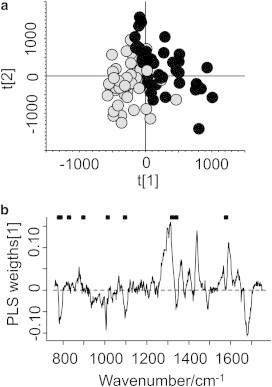
(a) Score plot for the first two PLS components in the PLS-DA model. Grey dots: observations from the cell nucleus. Black dots: observations from outside the cell nucleus. (b) PLS weights for the first PLS component. The positions of Raman bands assigned to DNA are marked by dots.
Figure 3.

(a) Mean spectrum and SD (upper and lower curves) for all measurements predicted to belong to the cell nucleus. (b) Mean spectrum and SD (upper and lower curves) for all measurements predicted to belong to the membrane and cytoplasmic regions. (c) 95% CI, as calculated from Student’s t-test, for the mean difference of the plots in a and b. The positions of Raman bands assigned to DNA are indicated by dots.
To evaluate our model, we had (by the same reasoning discussed for the training set) no test set that could provide an exact calibration of the spatial location of the voxels. Therefore, we evaluated the PLS-DA model using cross-validation. The cross-validation resulted in a Q2-value of 0.64. We also classified all collected voxels in our data set (624 spectra) and compared them against their apparent spatial location in the corresponding optical micrographs. Examples of micrographs and false-color maps, showing the predicted spatial location, are shown in Fig. 4. Despite the limitation of not being able to quantify the number of correctly classified and misclassified spectra with calibrated training sets, we can see that the classification appears to be consistent with the micrographs. Spectra near the border between the nucleus and cytoplasm are often unclassified, which is not unexpected since they contain spectral signatures for the lipid membrane. A total of 218 spectra were classified as spectra from the nucleus, 289 spectra were classified as spectra from the area outside the nucleus, and 117 spectra were not classified (denoted unknown). It should be noted that even though the Q2-value is relatively low, it does not reflect how many of the observations were correctly classified. Of the 80 observations in the training set, four were classified as having unknown class membership and 76 were correctly classified. When this information is combined with spectral data from the region containing the nanoparticle lattice vibrations (100–800 cm−1) to prove whether the voxels contain nanoparticles or not, reliable classification of the spatial location of the nanoparticles is obtained. Fig. 4 shows examples of intensity maps that indicate where nanoparticles are located inside cells.
Figure 4.

(a) Optical micrograph of A459 cell exposed to α-FeO(OH). (b) Pseudo-color map of the classification of each pixel in panel a. (c) Intensity map showing the Raman intensity of the band at 388 cm−1 corresponding to the Eg mode in α-FeO(OH) for each voxel indicated in a. (d) Optical micrograph of A459 cell exposed to TiO2. (e) Pseudo-color map of the classification of each pixel in d. (f) Intensity map showing the Raman intensity of the band at 638 cm−1 corresponding to the Eg mode in anatase TiO2 for each pixel indicated in d. The crosses depicted in a and d show the measurement spots where the laser beam was focused.
PLS-DA is a supervised classification method, i.e., it requires prior knowledge of class membership. A limitation of applying PLS-DA to our data is that it is difficult to determine the true class membership from optical micrographs. One option is to use unsupervised classification methods, such as clustering methods (e.g., k-means cluster analysis) (44). In such methods, however, the main variance in the data must be related to differences between the groups. In this case, the differences between spectra from the cell nucleus and the area outside the nucleus are small, and therefore it is not obvious that an unsupervised method would be advantageous. Here, we have shown that PLS-DA is useful for classifying spectra from the cell nucleus and the area outside the cell nucleus.
Biodistribution of nanoparticles
Raman spectroscopy is a new, promising technique for studying biodistribution. Meister et al. (45) used Raman imaging to study the distribution of manganese-based particles with photo-induced cytotoxic effect. By integrating the Raman band at 2800–3050 cm−1 (CH stretching), they could visualize the cell membrane and nucleus membrane (45). Using the spectral information from nanoparticles, they concluded, without quantifying the results, that nanoparticles enter the nucleus (45). Shah et al. (46) used confocal Raman spectroscopy to visualize polyethylene-coated gold nanoparticles in cells. They studied two to three cells exposed to nanoparticles for 2 h, 12 h, and 24 h (46). The cell nucleus as well as the nucleoli could be resolved in the images, which were constructed by integrating the CH stretching band at 2800–3050 cm−1 (46). They found that nanoparticles reached the perinuclear region after 24 h of exposure (46). TEM showed nanoparticles in vesicles near the nucleus after 24 h of exposure time (46). Lamprecht et al. (47) used the CH stretching mode to identify organelles in cells. Using Raman spectroscopy, they were able to localize functionalized carbon nanotubes inside cells, primarily accumulated around the nucleus but not inside the nucleus (47).
Raman spectroscopy is a method that can be applied in studies of photosensitive samples, such as living cells (25–27). However, it is important to be aware of possible photo-damaging effects of the laser. Puppels et al. (48) reported reduced cell viabilities in a limited number of cells after 5 min exposure to a 514 nm laser wavelength with 0.5 mW power and a laser spot size of ∼1 μm. In contrast, Kang et al. (49) used a 514 nm laser with 1 mW output power and short measurement time (1 s), and could not notice any damage to cells. Knief et al. (23) used the same laser wavelength with 23 mW laser power for studies of live cells, but employed much longer exposure times (each spectrum was collected for 90 s and each cell was mapped with 75 spots) (23). Unfortunately, possible photodamage effects were not discussed in that study. We chose to measure only normal cells adherent to the substrate, and after obtaining the measurements, we used microscopy to study possible photodamage by counting blebs. We did not observe any photodamage, which we attribute to the larger laser spot size employed here (>3 μm) compared with that used in, e.g., the study by Puppels et al. (48).
In most biodistribution studies, TEM or confocal microscopy is used. In general, because the types of nanoparticles, cell lines, doses, exposure times, and analytical methods vary among the reported studies, it is difficult to compare the results. Moreover, there is also a large spread in the number of cells investigated in each study. Panté and Kann (50) studied the biodistribution of gold nanoparticles, which they intentionally prepared to be taken up in the cell nucleus by coating them with α-importin and β-importin, to investigate the maximum size of particles that can be transported via nuclear pores. The nanoparticles were 22, 26, or 36 nm in diameter, and for each size they studied both coated and uncoated particles (50). Four cells were analyzed in each group and the number of analyzed particles was 100–300 (50). They found that none of the largest particles entered the nucleus, whereas 35–36% of the smallest nanoparticles entered the nucleus and ∼28% of the 26 nm particles entered the nucleus (50). Other biodistribution studies focused on the distribution of particles that were not intentionally prepared to be taken up by cells. Singh et al. (51) exposed cells to fine (40–300 nm) TiO2 and ultrafine (20–80 nm) TiO2 for 4 h. Using TEM, they found nanoparticles mainly in the vacuoles inside the cells. In one case, nanoparticles were also observed in the cell nucleus (51). Hackenberg et al. (33) studied cells exposed to TiO2 for 24 h, and an analysis of >100 cells revealed that only five cells had nanoparticles in the cytoplasmic region and only one had nanoparticles in the nucleus. Dam et al. (52) studied the interaction of cells and gold nanoparticles coated with an anticancer drug, using TEM and confocal fluorescence microscopy. Confocal fluorescence microscopy indicated that nanoparticles were localized near the nucleus, and an analysis of >100 TEM sections revealed deformation of the nuclear envelope in 60% of the cells (52). Nanoparticles were found near the nuclei, but nanoparticles inside the nuclei were not reported (52). Yehia et al. (53) used confocal Raman microspectroscopy and TEM to study the uptake of single-walled carbon nanotubes in HeLa cells. Using TEM, they compared eight control cells with 10 cells exposed to carbon nanotubes and found that the cells exposed to nanoparticles contained nanotubes in the vacuoles in the cytoplasmic region, but did not find any evidence of particles in the cell nucleus (53). They used Raman spectroscopy to confirm that carbon nanotubes were internalized in the cells, and presented the Raman spectra of carbon nanotubes in both the cytoplasmic and nuclear region (53). However, the authors stressed that the nanoparticles may have been located in the perinuclear region, and not inside the cell nucleus, because the measurement volumes (voxels) were relatively large (53).
Here, we quantified the distribution of nanoparticles inside cells by the measured intensity distribution of the Eg mode at 638 cm−1 in anatase TiO2, and the Eg mode at 388 cm−1 in α-FeO(OH), as shown in Fig. 5. The threshold level to determine whether a nanoparticle could be identified in a voxel was set to 50 cps, which is a modest threshold, and gives an estimate of the lower bound of the particle concentrations. We chose not to use the more intense TiO2 Eg mode at 145 cm−1 because we found that it showed large variations between different measurements due to the holographic notch filter used to prevent the laser light from reaching the detector, which partly attenuated the signal in this region. In contrast to other studies in which Raman spectroscopy was used for biodistribution studies, we used multivariate classification to determine which voxels originated from the cell nucleus or the area outside cell nucleus. With the PLS-DA model at hand, the occurrence of specific Raman bands due to nanoparticles can now be associated with their spatial location in the cell determined by their class membership. In Fig. 4, results from this analysis are shown in the form of pseudo-colored images, which depict the results from the spatial classification along with intensity maps of the TiO2 band at 638 cm−1 and the α-FeO(OH) band at 388 cm−1, respectively. Fig. 6 shows the percentage of measurements from different spatial locations that exhibit Raman signatures due to either TiO2 or α-FeO(OH), or mixtures of TiO2 and α-FeO(OH). A remarkably high fraction of the voxels that are classified as belonging to the cell nucleus also contain nanoparticles (37%, or 21 out of 57 observations, for TiO2; 32%, or 23 out of 73 observations, for α-FeO(OH); and 23%, or 11 out of 47 observations for the TiO2/α-FeO(OH) mixture). Despite their different shape, isoelectric point (pHIEP), and primary particle size, the difference in nanoparticle uptake is small. Interestingly, Fig. 6 also illustrates that approximately the same number of nanoparticles are located inside the cell nucleus after 4 h of exposure (42%, or 11 out of 26) as compared with 48 h of exposure.
Figure 5.
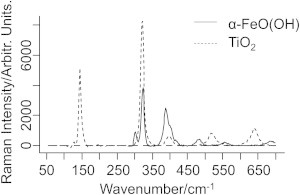
Raman spectra of TiO2 and α-FeO(OH) nanoparticles. The intense band at 322 cm−1 is from the CaF2 substrate.
Figure 6.
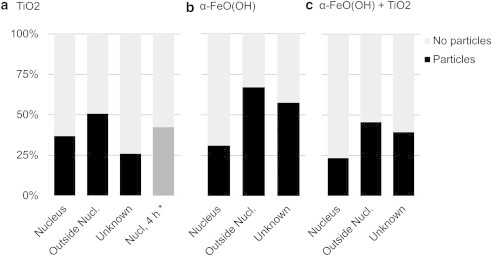
Bar charts showing the percentage of measurements from outside the nucleus, inside the nucleus, and unknown locations, as deduced from the PLS-DA model, which shows characteristic Raman bands due to (a) anatase TiO2, (b) α-FeO(OH), or (c) mixtures of α-FeO(OH) and TiO2. The asterisk (∗) in panel a shows the result from single-point measurements after 4 h of exposure.
TEM images were also obtained from sections of nanoparticle-exposed cells. Although there is a question as to whether the TEM images represent the pristine three-dimensional location of the particles, without the influence of sample preparation, it is clear that agglomerates of nanoparticles in the size range of 30 nm to 3.2 μm can be seen inside cells. The TEM images shown in Fig. 7 are examples of images in which well-resolved nanoparticles are seen in the cells. More TEM images of cells exposed to nanoparticles can be found in the Supporting Material. Large particle agglomerates are visible inside vacuoles (Fig. 7, a–c) and close to lamellar bodies (Fig. 7, a and c). However, nanoparticle agglomerates can also discerned inside the cell nuclei (Fig. 7, a–c), in qualitative agreement with the hyperspectral Raman image analysis. Fig. 7 a shows a cell exposed to α-FeO(OH) for 48 h. A smaller dark dot in the cell nucleus indicates that nanoparticles also may have entered the cell nucleus. The cell in Fig. 7 b is one of a few examples of cells exposed to TiO2 for 48 h that also exhibit dots, which can be unambiguously identified as small nanoparticle agglomerates located in the cell nucleus. In a few images, nanoparticles are also observed on either side of the nucleus membrane (Fig. 7 c), which gives indirect support for a mechanism that involves transport of nanoparticles across the membrane. We note that the discrepancy is apparently large between TEM and Raman mapping regarding the number of cells with nanoparticles in the cell nucleus. In all cells studied in TEM (30 images in total), nanoparticles were visible in the cytoplasmic region, but only in two images of cells exposed to TiO2, nanoparticles seemed to have entered the cell nucleus. This is consistent with the results of Hackenberg et al. (33) and Sing et al. (51), which showed that only a limited number of cells had nanoparticles internalized in the cell nucleus. Four of the cells in our TEM images of cells exposed to α-FeO(OH) and four of the cells in our TEM images of cells exposed to the nanoparticle mixture had suspected nanoparticles in the cell nucleus. The apparent difference between the TEM and Raman mapping results concerning the absolute number of nanoparticles detected inside the nucleus may be due to several reasons. First, the granular nature of the cell structure makes it difficult to discern small nanoparticles (down to primary particle size) in bright-field TEM (only particles with a Feret diameter > 28 nm can be resolved in our data set). Second, during preparation, the knife may damage sections containing larger particles during microtome sectioning (typically the sections are 80 nm, although many aggregates are larger), thus further biasing the selection of cell sections used in the TEM analysis (we discarded several sections due to damaged cell structure; a few with not as severe damage can be found in the Supporting Material). On the other hand, the Raman mapping collects spectral contributions from all nanoparticles, even the smallest, located inside the measurement volume in a randomized set of cells (see Materials and Methods). As discussed above, we can exclude significant off-focal plane contributions, and therefore assume that the Raman signal originates mainly from inside the nucleus in the examples shown in Fig. 4. However, one can overcome the difficulty of distinguishing nanoparticles from cell structures in bright-field TEM by using energy-dispersive x-ray (EDX). This approach was recently used by Mu et al. (54) to study the uptake of 14 nm silica particles in A549 cells, and Wang et al. (55) to study the uptake of 40 nm CuO nanoparticles in A549 cells. Further TEM studies combined with chemical identification (such as EDX) should be performed to firmly resolve the apparent discrepancy between quantitative TEM and Raman mapping of the biodistribution of nanoparticles in cells.
Figure 7.
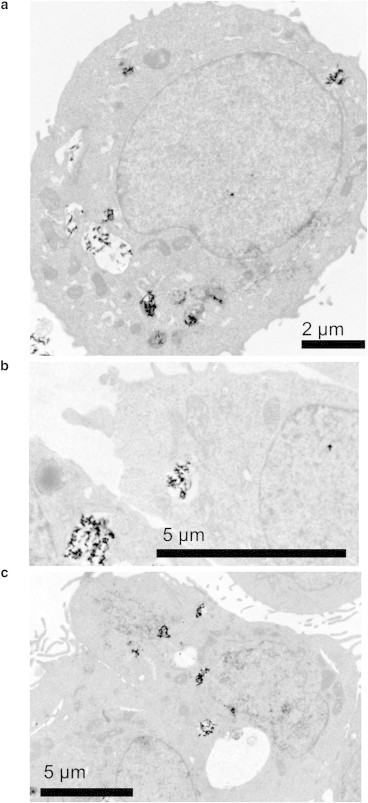
TEM images of sections of A549 cells exposed to (a) 10 μg ml−1α-FeO(OH) nanoparticles, (b) 10 μg ml−1 TiO2 nanoparticles, or (c) 10 μg ml−1 of α-FeO(OH) and 10 μg ml−1 TiO2 nanoparticles.
The mechanisms underlying nuclear internalization of nanoparticles are to a large extent unknown. Smaller molecules are transported to the cell nucleus through nuclear pores by means of passive diffusion, whereas larger molecules (and proteins) must interact with transport receptors to enter the cell nucleus (50,56). The nuclear pore transport mechanism may seem to exclude nanoparticles in the size ranges employed here, simply because they are too large. In addition, it is expected that proteins are adsorbed on these nanoparticles (57), which makes them even larger. Nevertheless, nanoparticles have been reported to be localized inside cell nuclei in several studies (33,50,51,58,59), and these findings remain to be explained. Panté and Kann (50) studied the transport of gold nanoparticles of different sizes and suggested that nanoparticles up to 39 nm can enter the cell nucleus through a receptor-regulated nuclear pore transport mechanism. Kim et al. (60) discussed the role of the cell cycle in cellular uptake and concluded that internalized nanoparticles are split between daughter cells after cell division. The epithelial cells in our cultures divide once per 19 h and are in different cell-cycle phases during the particle exposure. Nanoparticles may thus enter the cell nucleus during cell division, particularly after 48 h of incubation time. However, the data from cells exposed to TiO2 nanoparticles for 4 h (Fig. 6 a) show that approximately the same fraction of nanoparticles are also found inside the cell nucleus after very short incubation times, much shorter than the cell-cycle time. This strongly indicates that cell division is not the main route for nanoparticle entry into the cell nucleus. Thus, it appears that despite their size, nanoparticles can cross the nuclear membrane as small, possibly protein-covered primary particles. To reconcile this notion with the fairly large agglomerates observed in TEM, we propose that nanoparticles reagglomerate as a function of time inside the nucleus after an extended incubation time (up to 48 h in our case). In support of this mechanism is the more-acidic environment in the vicinity of lipid membranes, which in principle would promote particle deagglomeration (and even dissolution of ions, although this is unlikely for the nanoparticles studied here). The TEM data, which unambiguously show that there is a higher propensity for nanoparticles to be close to the lipid membranes in cells, clearly demonstrate the possibility of such a mechanism. We thus propose a mechanism whereby agglomeration-deagglomeration of nanoparticles below a critical primary particle size determines the nuclear uptake.
Conclusions
This study shows that multivariate data analysis of hyperspectral Raman images can be used to determine the biodistribution of nanoparticles inside living cells quantitatively without the need for staining protocols. In particular, we have quantitatively shown that a surprisingly large fraction (up to ∼40%) of the investigated voxels associated with the cell nucleus contain nanoparticles, irrespective of short (4 h) or long (48 h) exposure times. A deagglomeration mechanism, enhanced by the acidic environment close to the lipid nuclear membrane, is proposed to explain the findings. Upon internalization in the nucleus, the nanoparticles reagglomerate and are observed as larger agglomerates in microscopy. These findings are important for understanding the toxicity of nanoparticles, and provide evidence of direct (or short-distance) interactions between nanoparticles and DNA as a cause of genotoxicity.
More generally, we conclude that generic methods of classifying hyperspectral images can be used in numerous biomedical applications to make spatiochemical maps of complicated matrices. By the same token, it may even be possible to differentiate possible biochemical modifications inside cells induced by nanomaterials or chemicals (23). Combined with the recent technological developments in Raman imaging (e.g., improved signal/noise ratio, higher spatial resolution, tenable laser excitation wavelengths, and reduced acquisition time) (61,62), this promises further progress in this area.
Acknowledgments
This work was partially supported by the Swedish Defense Research Agency (FOI grant number I44163) and the Swedish Research Council (Formas grant number 2008-1375).
Supporting Material
References
- 1.Committee for Review of the Federal Strategy to Address Environmental, Health, and Safety Research Needs for Engineered Nanoscale Materials, Committee on Toxicology, National Research Council . National Academies Press; Washington, DC: 2009. Review of Federal Strategy for Nanotechnology-Related Environmental, Health, and Safety Research. [PubMed] [Google Scholar]
- 2.2009. Risk Assessment of Products of Nanotechnologies. Scientific Committee on Emerging and Newly Identified Health Risks. http://ec.europa.eu/health/ph_risk/committees/04_scenihr/docs/scenihr_o_023.pdf.
- 3.Zhu M.-T., Feng W.-Y., Chai Z.F. Particokinetics and extrapulmonary translocation of intratracheally instilled ferric oxide nanoparticles in rats and the potential health risk assessment. Toxicol. Sci. 2009;107:342–351. doi: 10.1093/toxsci/kfn245. [DOI] [PubMed] [Google Scholar]
- 4.Oberdörster G., Oberdörster E., Oberdörster J. Nanotoxicology: an emerging discipline evolving from studies of ultrafine particles. Environ. Health Perspect. 2005;113:823–839. doi: 10.1289/ehp.7339. [DOI] [PMC free article] [PubMed] [Google Scholar]
- 5.Hussain S., Vanoirbeek J.A.J., Hoet P.H.M. Interactions of nanomaterials with the immune system. Wiley Interdiscip. Rev. Nanomed. Nanobiotechnol. 2012;4:169–183. doi: 10.1002/wnan.166. [DOI] [PubMed] [Google Scholar]
- 6.Gustafsson Å., Lindstedt E., Bucht A. Lung exposure of titanium dioxide nanoparticles induces innate immune activation and long-lasting lymphocyte response in the Dark Agouti rat. J. Immunotoxicol. 2011;8:111–121. doi: 10.3109/1547691X.2010.546382. [DOI] [PMC free article] [PubMed] [Google Scholar]
- 7.Shannahan J.H., Kodavanti U.P., Brown J.M. Manufactured and airborne nanoparticle cardiopulmonary interactions: a review of mechanisms and the possible contribution of mast cells. Inhal. Toxicol. 2012;24:320–339. doi: 10.3109/08958378.2012.668229. [DOI] [PMC free article] [PubMed] [Google Scholar]
- 8.Jiang W., Kim B.Y.S., Chan W.C.W. Nanoparticle-mediated cellular response is size-dependent. Nat. Nanotechnol. 2008;3:145–150. doi: 10.1038/nnano.2008.30. [DOI] [PubMed] [Google Scholar]
- 9.Borm P., Klaessig F.C., Wood S. Research strategies for safety evaluation of nanomaterials, part V: role of dissolution in biological fate and effects of nanoscale particles. Toxicol. Sci. 2006;90:23–32. doi: 10.1093/toxsci/kfj084. [DOI] [PubMed] [Google Scholar]
- 10.Powers K.W., Brown S.C., Roberts S.M. Research strategies for safety evaluation of nanomaterials. Part VI. Characterization of nanoscale particles for toxicological evaluation. Toxicol. Sci. 2006;90:296–303. doi: 10.1093/toxsci/kfj099. [DOI] [PubMed] [Google Scholar]
- 11.Jiang J., Oberdörster G., Biswas P. Characterization of size, surface charge, and agglomeration state of nanoparticle dispersions for toxicological studies. J. Nanopart. Res. 2008;11:77–89. [Google Scholar]
- 12.Marquis B.J., Love S.A., Haynes C.L. Analytical methods to assess nanoparticle toxicity. Analyst (Lond.) 2009;134:425–439. doi: 10.1039/b818082b. [DOI] [PubMed] [Google Scholar]
- 13.Johnston H.J., Hutchison G.R., Stone V. Identification of the mechanisms that drive the toxicity of TiO(2 )particulates: the contribution of physicochemical characteristics. Part. Fibre Toxicol. 2009;6:33. doi: 10.1186/1743-8977-6-33. [DOI] [PMC free article] [PubMed] [Google Scholar]
- 14.Gonzalez L., Lison D., Kirsch-Volders M. Genotoxicity of engineered nanomaterials: a critical review. Nanotoxicology. 2008;2:252–273. [Google Scholar]
- 15.Wörle-Knirsch J.M., Pulskamp K., Krug H.F. Oops they did it again! Carbon nanotubes hoax scientists in viability assays. Nano Lett. 2006;6:1261–1268. doi: 10.1021/nl060177c. [DOI] [PubMed] [Google Scholar]
- 16.Monteiro-Riviere N.A., Inman A.O., Zhang L.W. Limitations and relative utility of screening assays to assess engineered nanoparticle toxicity in a human cell line. Toxicol. Appl. Pharmacol. 2009;234:222–235. doi: 10.1016/j.taap.2008.09.030. [DOI] [PubMed] [Google Scholar]
- 17.Lewinski N., Colvin V., Drezek R. Cytotoxicity of nanoparticles. Small. 2008;4:26–49. doi: 10.1002/smll.200700595. [DOI] [PubMed] [Google Scholar]
- 18.Dorney J., Bonnier F., Byrne H.J. Identifying and localizing intracellular nanoparticles using Raman spectroscopy. Analyst (Lond.) 2012;137:1111–1119. doi: 10.1039/c2an15977e. [DOI] [PubMed] [Google Scholar]
- 19.Andersson P.O., Lejon C., Osterlund L. Polymorph- and size-dependent uptake and toxicity of TiO2 nanoparticles in living lung epithelial cells. Small. 2011;7:514–523. doi: 10.1002/smll.201001832. [DOI] [PubMed] [Google Scholar]
- 20.Kendall C., Isabelle M., Stone N. Vibrational spectroscopy: a clinical tool for cancer diagnostics. Analyst (Lond.) 2009;134:1029–1045. doi: 10.1039/b822130h. [DOI] [PubMed] [Google Scholar]
- 21.Gierlinger N., Keplinger T., Harrington M. Imaging of plant cell walls by confocal Raman microscopy. Nat. Protoc. 2012;7:1694–1708. doi: 10.1038/nprot.2012.092. [DOI] [PubMed] [Google Scholar]
- 22.Lindgren J., Uvdal P., Thiel V. Molecular preservation of the pigment melanin in fossil melanosomes. Nat Commun. 2012;3:824. doi: 10.1038/ncomms1819. [DOI] [PubMed] [Google Scholar]
- 23.Knief P., Clarke C., Byrne H.J. Raman spectroscopy—a potential platform for the rapid measurement of carbon nanotube-induced cytotoxicity. Analyst (Lond.) 2009;134:1182–1191. doi: 10.1039/b821393c. [DOI] [PubMed] [Google Scholar]
- 24.Krafft C., Knetschke T., Salzer R. Identification of organelles and vesicles in single cells by Raman microspectroscopic mapping. Vib. Spectrosc. 2005;38:85–93. [Google Scholar]
- 25.Matthäus C., Chernenko T., Diem M. Label-free detection of mitochondrial distribution in cells by nonresonant Raman microspectroscopy. Biophys. J. 2007;93:668–673. doi: 10.1529/biophysj.106.102061. [DOI] [PMC free article] [PubMed] [Google Scholar]
- 26.Krafft C., Dietzek B., Popp J. Raman and CARS microspectroscopy of cells and tissues. Analyst (Lond.) 2009;134:1046–1057. doi: 10.1039/b822354h. [DOI] [PubMed] [Google Scholar]
- 27.Everall N.J. Confocal Raman microscopy: common errors and artefacts. Analyst (Lond.) 2010;135:2512–2522. doi: 10.1039/c0an00371a. [DOI] [PubMed] [Google Scholar]
- 28.Notingher I., Verrier S., Hench L.L. Spectroscopic study of human lung epithelial cells (A549) in culture: living cells versus dead cells. Biopolymers. 2003;72:230–240. doi: 10.1002/bip.10378. [DOI] [PubMed] [Google Scholar]
- 29.Ekstrand-Hammarström B., Akfur C.M., Bucht A. Human primary bronchial epithelial cells respond differently to titanium dioxide nanoparticles than the lung epithelial cell lines A549 and BEAS-2B. Nanotoxicology. 2012;6:623–634. doi: 10.3109/17435390.2011.598245. [DOI] [PubMed] [Google Scholar]
- 30.Wang Y., Zhu M.-T., Feng W.Y. In vitro cytotoxicity of transparent yellow iron oxide nanoparticles on human glioma cells. J. Nanosci. Nanotechnol. 2010;10:8550–8555. doi: 10.1166/jnn.2010.2487. [DOI] [PubMed] [Google Scholar]
- 31.Shelley M.L., Wagner A.J., Bleckmann C. Modeling the in vivo case with in vitro nanotoxicity data. Int. J. Toxicol. 2008;27:359–367. doi: 10.1080/10915810802503487. [DOI] [PubMed] [Google Scholar]
- 32.Li Z., Mi L., Chen J.-Y. Study on the visible-light-induced photokilling effect of nitrogen-doped TiO2 nanoparticles on cancer cells. Nanoscale Res. Lett. 2011;6:356. doi: 10.1186/1556-276X-6-356. [DOI] [PMC free article] [PubMed] [Google Scholar]
- 33.Hackenberg S., Friehs G., Kleinsasser N. Nanosized titanium dioxide particles do not induce DNA damage in human peripheral blood lymphocytes. Environ. Mol. Mutagen. 2011;52:264–268. doi: 10.1002/em.20615. [DOI] [PubMed] [Google Scholar]
- 34.Chen M., von Mikecz A. Formation of nucleoplasmic protein aggregates impairs nuclear function in response to SiO2 nanoparticles. Exp. Cell Res. 2005;305:51–62. doi: 10.1016/j.yexcr.2004.12.021. [DOI] [PubMed] [Google Scholar]
- 35.Boily J.-F., Lützenkirchen J., Sjöberg S. Modeling proton binding at the goethite (α-FeOOH)–water interface. Colloids Surf. A Physicochem. Eng. Asp. 2001;179:11–27. [Google Scholar]
- 36.Mäkie P., Westin G., Österlund L. Adsorption of trimethyl phosphate on maghemite, hematite, and goethite nanoparticles. J. Phys. Chem. A. 2011;115:8948–8959. doi: 10.1021/jp201065w. [DOI] [PubMed] [Google Scholar]
- 37.Kosmulski M., Maczka E., Rosenholm J.B. Synthesis and characterization of goethite and goethite-hematite composite: experimental study and literature survey. Adv. Colloid Interface Sci. 2003;103:57–76. doi: 10.1016/S0001-8686(02)00083-0. [DOI] [PubMed] [Google Scholar]
- 38.Rasband W. National Institutes of Health; Bethesda, Maryland: 1997. ImageJ 1.44 p. [Google Scholar]
- 39.Barker M., Rayens W. Partial least squares for discrimination. J. Chemometrics. 2003;17:166–173. [Google Scholar]
- 40.2011. SIMCA-P+ 12.0.1. Umetrics, Umea, Sweden.
- 41.Zhang Z.-M., Chen S., Zhou H. An intelligent background-correction algorithm for highly fluorescent samples in Raman spectroscopy. J. Raman. Spectrosc. 2009;41:659–669. [Google Scholar]
- 42.2011. R Development Core Team. R: A Language and Environment for Statistical Computing 2.13.0. R Foundation for Statistical Computing, Vienna, Austria.
- 43.Wold S., Sjöström M., Eriksson L. PLS-regression: a basic tool of chemometrics. Chemometr. Intell. Lab. 2001;58:109–130. [Google Scholar]
- 44.Krafft C., Diderhoshan M.A., Popp J. Crisp and soft multivariate methods visualize individual cell nuclei in Raman images of liver tissue sections. Vib. Spectrosc. 2011;55:90–100. [Google Scholar]
- 45.Meister K., Niesel J., Havenith M. Label-free imaging of metal-carbonyl complexes in live cells by Raman microspectroscopy. Angew. Chem. Int. Ed. Engl. 2010;49:3310–3312. doi: 10.1002/anie.201000097. [DOI] [PubMed] [Google Scholar]
- 46.Shah N.B., Dong J., Bischof J.C. Cellular uptake and nanoscale localization of gold nanoparticles in cancer using label-free confocal Raman microscopy. Mol. Pharm. 2011;8:176–184. doi: 10.1021/mp1002587. [DOI] [PubMed] [Google Scholar]
- 47.Lamprecht C., Gierlinger N., Ebner A. Mapping the intracellular distribution of carbon nanotubes after targeted delivery to carcinoma cells using confocal Raman imaging as a label-free technique. J. Phys. Condens. Matter. 2012;24:164206. doi: 10.1088/0953-8984/24/16/164206. [DOI] [PubMed] [Google Scholar]
- 48.Puppels G.J., Olminkhof J.H.F., Greve J. Laser irradiation and Raman spectroscopy of single living cells and chromosomes: sample degradation occurs with 514.5 nm but not with 660 nm laser light. Exp. Cell Res. 1991;195:361–367. doi: 10.1016/0014-4827(91)90385-8. [DOI] [PubMed] [Google Scholar]
- 49.Kang L.-L., Huang Y.-X., Luo M. Confocal Raman microscopy on single living young and old erythrocytes. Biopolymers. 2008;89:951–959. doi: 10.1002/bip.21042. [DOI] [PubMed] [Google Scholar]
- 50.Panté N., Kann M. Nuclear pore complex is able to transport macromolecules with diameters of about 39 nm. Mol. Biol. Cell. 2002;13:425–434. doi: 10.1091/mbc.01-06-0308. [DOI] [PMC free article] [PubMed] [Google Scholar]
- 51.Singh S., Shi T., Schins R.P. Endocytosis, oxidative stress and IL-8 expression in human lung epithelial cells upon treatment with fine and ultrafine TiO2: role of the specific surface area and of surface methylation of the particles. Toxicol. Appl. Pharmacol. 2007;222:141–151. doi: 10.1016/j.taap.2007.05.001. [DOI] [PubMed] [Google Scholar]
- 52.Dam D.H.M., Lee J.H., Odom T.W. Direct observation of nanoparticle-cancer cell nucleus interactions. ACS Nano. 2012;6:3318–3326. doi: 10.1021/nn300296p. [DOI] [PMC free article] [PubMed] [Google Scholar]
- 53.Yehia H.N., Draper R.K., Pantano P. Single-walled carbon nanotube interactions with HeLa cells. J. Nanobiotechnology. 2007;5:8. doi: 10.1186/1477-3155-5-8. [DOI] [PMC free article] [PubMed] [Google Scholar]
- 54.Mu Q., Hondow N.S., Routledge M.N. Mechanism of cellular uptake of genotoxic silica nanoparticles. Part. Fibre Toxicol. 2012;9:29. doi: 10.1186/1743-8977-9-29. [DOI] [PMC free article] [PubMed] [Google Scholar]
- 55.Wang Z., Li N., Xing B. CuO nanoparticle interaction with human epithelial cells: cellular uptake, location, export, and genotoxicity. Chem. Res. Toxicol. 2012;25:1512–1521. doi: 10.1021/tx3002093. [DOI] [PubMed] [Google Scholar]
- 56.Terry L.J., Shows E.B., Wente S.R. Crossing the nuclear envelope: hierarchical regulation of nucleocytoplasmic transport. Science. 2007;318:1412–1416. doi: 10.1126/science.1142204. [DOI] [PubMed] [Google Scholar]
- 57.Linse S., Cabaleiro-Lago C., Dawson K.A. Nucleation of protein fibrillation by nanoparticles. Proc. Natl. Acad. Sci. USA. 2007;104:8691–8696. doi: 10.1073/pnas.0701250104. [DOI] [PMC free article] [PubMed] [Google Scholar]
- 58.Godbey W.T., Wu K.K., Mikos A.G. Tracking the intracellular path of poly(ethylenimine)/DNA complexes for gene delivery. Proc. Natl. Acad. Sci. USA. 1999;96:5177–5181. doi: 10.1073/pnas.96.9.5177. [DOI] [PMC free article] [PubMed] [Google Scholar]
- 59.AshaRani P.V., Low Kah Mun G., Valiyaveettil S. Cytotoxicity and genotoxicity of silver nanoparticles in human cells. ACS Nano. 2009;3:279–290. doi: 10.1021/nn800596w. [DOI] [PubMed] [Google Scholar]
- 60.Kim J.A., Åberg C., Dawson K.A. Role of cell cycle on the cellular uptake and dilution of nanoparticles in a cell population. Nat. Nanotechnol. 2012;7:62–68. doi: 10.1038/nnano.2011.191. [DOI] [PubMed] [Google Scholar]
- 61.Moger J., Johnston B.D., Tyler C.R. Imaging metal oxide nanoparticles in biological structures with CARS microscopy. Opt. Express. 2008;16:3408–3419. doi: 10.1364/oe.16.003408. [DOI] [PubMed] [Google Scholar]
- 62.Kneipp K., Haka A.S., Feld M.S. Surface-enhanced Raman spectroscopy in single living cells using gold nanoparticles. Appl. Spectrosc. 2002;56:150–154. [Google Scholar]
Associated Data
This section collects any data citations, data availability statements, or supplementary materials included in this article.