Abstract
Purpose: Respiratory motion introduces uncertainties in tumor location and lung deformation, which often results in difficulties calculating dose distributions in thoracic radiation therapy. Deformable image registration (DIR) has ability to describe respiratory-induced lung deformation, with which the radiotherapy techniques can deliver high dose to tumors while reducing radiation in surrounding normal tissue. The authors' goal is to propose a DIR method to overcome two main challenges of the previous biomechanical model for lung deformation, i.e., the requirement of precise boundary conditions and the lack of elasticity distribution.
Methods: As opposed to typical methods in biomechanical modeling, the authors' method assumes that lung tissue is inhomogeneous. The authors thus propose a DIR method combining a varying intensity flow (VF) block-matching algorithm with the finite element method (FEM) for lung deformation from end-expiratory phase to end-inspiratory phase. Specifically, the lung deformation is formulated as a stress–strain problem, for which the boundary conditions are obtained from the VF block-matching algorithm and the element specific Young's modulus distribution is estimated by solving an optimization problem with a quasi-Newton method. The authors measure the spatial accuracy of their nonuniform model as well as a standard uniform model by applying both methods to four-dimensional computed tomography images of six patients. The spatial errors produced by the registrations are computed using large numbers (>1000) of expert-determined landmark point pairs.
Results: In right-left, anterior–posterior, and superior–inferior directions, the mean errors (standard deviation) produced by the standard uniform FEM model are 1.42(1.42), 1.06(1.05), and 1.98(2.10) mm whereas the authors' proposed nonuniform model reduces these errors to 0.59(0.61), 0.52(0.51), and 0.78(0.89) mm. The overall 3D mean errors are 3.05(2.36) and 1.30(0.97) mm for the uniform and nonuniform models, respectively.
Conclusions: The results indicate that the proposed nonuniform model can simulate patient-specific and position-specific lung deformation via spatially varying Young's modulus estimates, which improves registration accuracy compared to the uniform model and is therefore a more suitable description of lung deformation.
Keywords: deformable image registration, lung, finite element method
INTRODUCTION
Respiratory motion plays a significant role in radiation therapy for thoracic tumors.1 Motion introduces uncertainties in tumor location and volume, which often results in difficulties calculating dose distributions to high precision. As such, four-dimensional computed tomography (4DCT) has been used to visualize respiratory-induced image characteristics and therefore aid the treatment planning process.2 Moreover, it has recently been shown that change in the air content of pulmonary parenchyma can be extracted from 4DCT image sets, resulting in CT derived ventilation image.3 However, deformable image registration (DIR) is required to establish a spatial correspondence between the time-varying volumetric images comprising a 4DCT in order to compute the ventilation images. The information provided by DIR also describes complex respiratory motion and physiological information that modern radiotherapy techniques, such as image-guided radiotherapy (IGRT), can exploit to potentially deliver high dose to tumors while reducing the risk of toxicity in the surrounding healthy tissue.4
In the past decades, various DIR methods have been proposed and developed. Two main categories often used are intensity based methods and biomechanical methods. Both methods have their advantages and limitations. Intensity based methods typically generate the motion field by maximizing the similarity or minimizing the dissimilarity between image pairs. As such, mainly image related aspects are taken into account while physiological processes are not emphasized. Consequently, the registration result loses physical meaning and may not be sufficiently realistic or plausible.
Biomechanical methods compute the registration using material properties and spatial positions of anatomy. For example, Mead et al.5 utilize a stress distribution model for lungs and a numerical implementation based on the finite element method (FEM). The FEM provides a framework that allows for the relationships between stress, strain, and force loads on a target to be expressed in terms of a motion field that more realistically describes the underlying physiology.2 It has been taken as the most suitable procedure to solve the complex elasticity problem of lungs6 and is a widely used method to describe lung deformation.2 For instance, Brock et al.7 developed a software platform called MORFEUS based on the FEM and surface projection alignments. The method has been applied to liver, prostate, and lungs with encouraging results.8 Another approach taken by investigators involves modeling lung motion as a contact problem to be solved by the FEM. For instance, Werner et al.9 derived a formulation based on modeling ventilation. Specifically, the lung geometry at exhale is “inflated” by applying a negative pressure in accordance with elasticity theory until it matches a final lung shape at inhale. In order to allow large magnitude motion, Al-Mayah et al.10 incorporated material nonlinearity into the FEM model and simulated boundary conditions using a frictionless contact surface, such that the lung is separated from the body and assumed to slide relative to the chest wall.
It is acknowledged that the elastic properties of soft tissues within the lung are heterogeneous and differ from person to person.10 However, most current FEM models are presented under an assumption that the lung tissue is homogenous, due to the fact that the material properties of human lung tissue are difficult to obtain. Though elasticity properties for lung tissue of canines have been reported11 and applied to human lung deformation models,12 the material properties between human and canine lung have been shown to be different.13 Similarly, Zeng et al.13 obtained estimates for material properties from a cadaver that were subsequently incorporated into lung deformation modeling. However, it should be noted that the relationship between living and nonliving tissue, in terms of material properties, is not known, which further confounds the difficulty in measuring the true characteristics of human lungs.
Methods utilizing both biophysical information and image-based information have exhibited strong potential in the field of DIR. Li et al.14 introduced a method that first utilizes an intensity based algorithm to determine the surface deformation approximation and then incorporates this information into a system of partial differential equations (PDEs) for describing lung motion. However, intensity based registration methods are prone to misregistration in low-contrast regions where the intensity variations are too small for the similarity metric to distinguish. To cope with this issue, Zhong et al.15 employed the FEM theory to correct registration errors from the “demons” algorithm in low-contrast regions and achieved encouraging results. Inspired by their work, we intend to model the motion of human lungs by linking image-based information to biophysical characteristics.
As introduced above, elasticity parameters are difficult to measure for human lungs and there is no consensus for the correct numerical values of these constants within the literature. Consequently, homogenous models of lung tissue are key to previous methods. In this study, we derive a DIR modeling approach based on the more physically accurate assumption that lung tissue is heterogeneous. The method employs a robust, intensity-based, block matching registration approach to first estimate the heterogeneous distribution of the elasticity properties within the lungs. This information is then incorporated into the FEM to deform lungs from end-expiratory (EE) phase to end-inspiratory (EI) phase according to elasticity principles. To our knowledge, this is the first FEM lung motion model that incorporates an estimate of the 3D elasticity distribution of human lungs obtained from intensity-based registration. Using block matching and the FEM, our combined method takes advantages of similarity in intensity locally and anatomic correspondence in geometry globally, which leads to high accuracy without loss of biophysical meaning in modeling the lung deformation.
METHODS
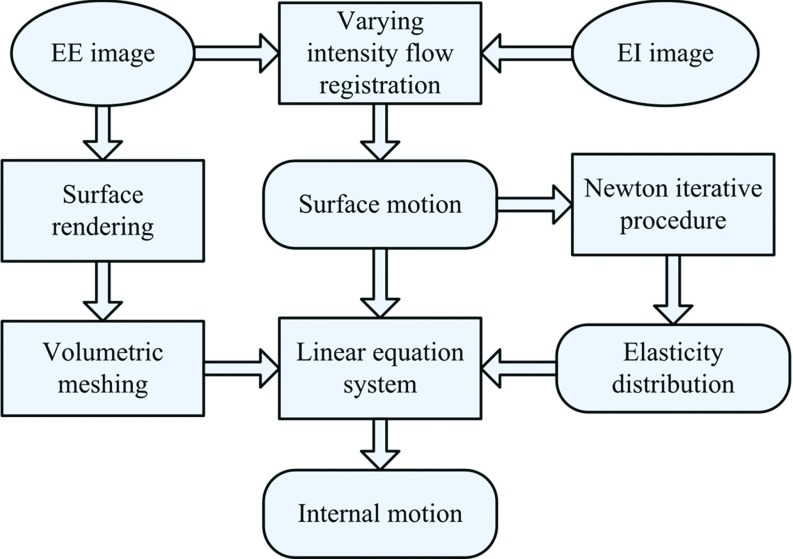
The proposed DIR framework is shown in Fig. 1 and consists of four main steps: (1) volumetric modeling, (2) surface motion estimation, (3) elasticity evaluation, and (4) internal motion calculation. Specifically, the lung is discretized into a large number of tetrahedral elements during the volumetric modeling process. The surface motion of the lungs is obtained from the intensity-based registration. In addition, the element specific elasticity is estimated from the initial registration result via a quasi-Newton optimization approach. Using the surface motion as the boundary conditions for the elasticity distribution, the internal motion of the lungs is finally evaluated by the FEM.
Figure 1.
The proposed DIR framework.
Linear elasticity theory
The elastic properties of lung tissue are often modeled with Hooke's law16, 1, 2 which describes the relationship between the strain tensor ɛij and stress tensor σij. In this paper, the strain tensor used is known as Cauchy's strain tensor which is linked to the displacement vector (u) by ɛij = (1/2)((∂ui/∂xj) + (∂uj/∂xi)). Here, the subscripts j and i indicate the stress acting direction and its normal plane, respectively. In 3D Cartesian coordinates, ɛij and σij have the following relationship:
| (1) |
where D is the elasticity matrix defined in Eq. 2 by the Young's modulus (E) and Poisson's ratio (ν), and the strain tensor is given in Eq. 3 as a function of the displacement vector (u):
| (2) |
| (3) |
Based on linear elasticity theory, the lung achieves static equilibrium when the total potential energy is minimized. According to Eq. 1, this implies
| (4) |
where F is the vector of forces acting on each node and U is the nodal displacement vector. The matrix [K] is known as the stiffness matrix which can be taken as a function with respect to Yong's modulus and Poisson's ratio as (Ω is the domain of the volumetric model and n is the number of nodes in volumetric mesh). For a tetrahedral element, [K] is a 12 × 12 matrix, while each F and U is a vector with length 12.
In the FEM, nodal displacement vectors are solved from the algebraic equations in terms of Eq. 4. The accuracy and efficiency of the FEM are subject to three key factors: the mesh quality, the boundary conditions, and the elasticity distribution. These three factors are now explained in detail.
Meshing
In the FEM, mesh quality is of great importance and has a direct effect on deformation results. The mesh is expected to be robust to complex deformations without loss of topological details within the anatomy. Tetrahedral elements, widely used in commercial meshing software, are more suitable than other elements for building a mesh of the lung because of its flexibility in representing and handling complex geometric objects. We describe the meshing process into six main steps:
-
1.
Segmentation—Only the lung tissue is taken as the ROI and extracted using 3D connectivity and global histogram thresholds of [−999 −250] Hu. The full segmentation routine is detailed in previous work.17 The ROI is finally converted to a binary mask image to define the spatial domain of lungs.
-
2.
Surface rendering—The surface is reconstructed from the binary mask image by the Marching Cubes technique.18 The resulting isosurface is then modeling by a surface mesh composed of triangular elements.
-
3.
Surface smoothing—Smoothing of the approximate surface mesh is necessary to regularize the underlying shape while preserving salient features in the geometry. For this purpose, the Laplacian smoothing approach described in the literature19 is employed.
-
4.
Volumetric mesh—The smoothed surface mesh is used to generate a volumetric model by discretizing the encapsulated ROI with tetrahedral elements using the mesh generator described by Fang and Boas.20
-
5.
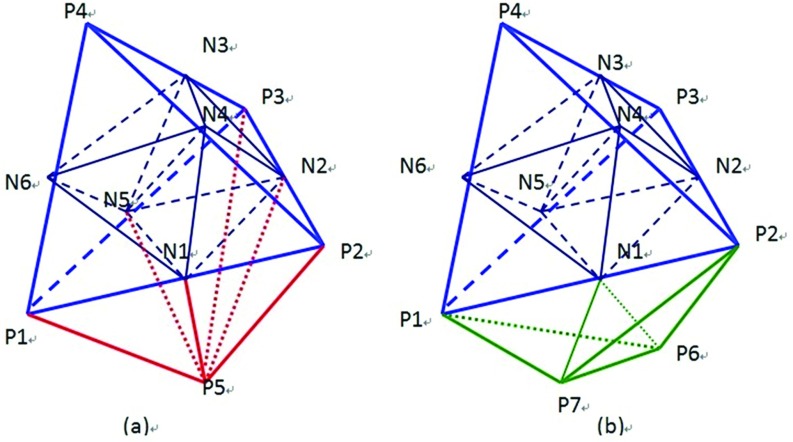
Mesh refinement—The initial tetrahedral mesh obtained in step 4 is typically coarse. A finer mesh is obtained by applying refinement approach described by Zhong et al.15 As shown in Fig. 2, by adding an additional node at each edge, a target tetrahedron is divided into eight subtetrahedrons, and the neighboring elements into four or two subtetrahedrons depending on whether the neighbor shares a face or an edge with the target.
-
6.
Mesh orientation—The elastic equations requires that all tetrahedrons be oriented consistently.15 Ensuring that the determinate of the Jacobian matrix corresponding to the expected orientation is positive enforces this property. If the determinant is negative, the tetrahedron nodes are reordered appropriately.
Figure 2.
Mesh refinement of a target element (P1–P2–P3–P4) and its neighboring elements: the target element is divided into eight subtetrahedrons by six added nodes Ni(i = 1, 2, …, 6) that result in four subtetrahedrons for the neighboring element (P1–P2–P3–P5) sharing a face in (a), and two subtetrahedrons for the neighboring element (P1–P2–P6–P7) sharing an edge in (b). Pi(i = 1, 2, …, 7) are nodes of the original elements.
Boundary conditions
In this work, we propose that the surface motion of the lungs be used as the boundary conditions for the internal motion evaluation. The surface motion is estimated by computing the spatial correspondence between the inhale and exhale lung surfaces via an intensity-based image registration. A commonly used similarity criterion for registration is the sum of squared intensity differences (SSDs).21 SSD methods assume voxel intensities remain constant throughout deformation. However, due to the compressible nature of lung tissue, this assumption is inappropriate. Here, we present an intensity model, referred to as varying intensity flow (VF), that accounts for intensity fluctuations.
Let image pairs I0(x) and I1(x) be the reference image and the target image, respectively. The goal is to determine a displacement vector d, for any position x in the reference image, that relates the position of x within the target image. The VF model is formulated by modifying the SSD formulation with an intensity compensation variable Ψ to allow for intensity variations:
| (5) |
where Nr(x) represents the “matching window” for x and is a neighborhood centered at x with radius r. Here d is the displacement vector. It can easily be shown that for any given d, the optimal value of Ψ is represented as
| (6) |
a result similar to the minimal variance similarity metric.
Using Eqs. 5, 6, a block matching strategy can be employed to compute the VF registration. To reduce the computational cost of the block-matching procedure, the reference image is sampled using a uniform 3D grid and the block matching is only conducted on the grid nodes. The resulting displacements obtained for each grid nodes are then interpolated with the moving least squares method22 to produce a displacement field defined on the entire ROI. The boundary conditions for the FEM are then given by the nodal displacements on the lung surface.
Elasticity estimation
The key properties of elastic materials are often described by the Young's modulus and Poisson's ratio, though both quantities have different definitions in literatures.10, 2, 15 In this study, the Poisson's ratio is assumed to be constant for lung deformation, while the Young's modulus is allowed to vary spatially to describe the unknown elasticity distribution. We aim to find the Young's modulus distribution that best approximates the displacement field from the VF registration. Therefore, the Young's modulus distribution is defined to minimize the difference between computed displacements from the FEM and predicted displacements from VF registration. It is given by
| (7) |
where Up is the vector of predicted displacements from VF registration and Uc(E) is the vector of computed displacements from Eq. 4 as Uc(E) = [K]−1F. Since Poisson's ratio is constant, the stiffness matrix [K] only has relationship to Young's modulus.
Formulation 7 can also be thought of as an inverse problem (IP) describing the unknown Young's modulus distribution E. To solve it, we first differentiate the objective function in Eq. 7 with respect to E and set the gradient to zero:
| (8) |
Taking a Taylor series of Φ′(E) at Ek, we have
| (9) |
where Φ″ is the Hessian matrix of Φ and given by
| (10) |
where IM is the identity matrix and ⊗ is the Kronecker product. In Eq. 10, the Hessian matrix can be approximated using only the first term because The second term [U″c]⌊IM ⊗ [Uc − Up]⌋ is small relative to []T[].
Substituting Eqs. 8, 10 into Eq. 9 yields
| (11) |
In order to solve forΔEk using Eq. 11, the sensitive matrix must first be determined. Since represents the first derivative of the displacement Uc with respect to the Young's modulus E, the following expression can be obtained by applying the partial derivative to both sides of Eq. 4:
| (12) |
Since the external force F is independent of Young's modulus, ∂F/∂E equates to zero. Therefore,
| (13) |
Given from Eq. 13, the corresponding ΔEk can be obtained using Eq. 11 and the can be updated iteratively by
| (14) |
in a quasi-Newton method scheme.
Algorithm implementation
Since the lung model is represented by discrete tetrahedral elements, our modeling approach assumes that each element has its own Young's modulus value. We calculate these values using an iterative quasi-Newton scheme and then estimate the lung's internal motion as follows.
-
1.
Initialize each element with the same Young's modulus Ek = 1000 kPa and Poisson's ratio ν = 0.38. Set k = 1.
-
2.
Find point matches between the reference and target images by the VF registration. With point matches, nodal displacements in volumetric model are interpolated and taken as the predicted displacements Up, including the predicted internal nodal displacements and external nodal displacements .
-
3.
Determine the stiffness matrix of each tetrahedral element and combine them into the total stiffness matrix K.
-
4.
Using linear Eq. 4 with as the boundary conditions, calculate the internal nodal displacements by the biconjugate gradient method. We thus obtain the computed displacements Uck.
-
5.
Solve for the sensitive matrix by Eq. 13 and compute ΔU = Uck − Up.
-
6.
Compute ΔEk by solving the linear Eq. 11 and then substitute it to Eq. 14 to compute Ek+1. Let k = k + 1 and go back to step 3.
-
7.
The above steps do not stop until the average value of Uck − Uc(k+1) is less than the predefined tolerance T = 0.5.
All numerical experiments were conducted on a Linux workstation with two Intel Xeon x5560 six-Core 2.80 GHz processors and a single NVIDIA Tesla 2070 GPU.
RESULTS
Data preparation
The proposed lung modeling method has been applied to the inhale/exhale phases of six 4DCT data sets. The detailed image characteristics are shown in Table 1.
Table 1.
The characteristics of the data for experiment.
| C | Respiratory period (s) | Tidal volume (ml) | Malignancy | Tumor location | GTV (ml) | Image dimensions | Voxel dimensions (mm) |
|---|---|---|---|---|---|---|---|
| 1 | 3.5 | 406 | Eso ca. | GE jxn | 41.4 | 256 × 256 × 104 | 1.15 × 1.15 × 2.50 |
| 2 | 3.3 | 269 | Eso ca. | GE jxn | 112.9 | 256 × 256 × 106 | 1.10 × 1.10 × 2.50 |
| 3 | 5.4 | 635 | Eso ca. | GE jxn | 16.7 | 512 × 512 × 136 | 0.97 × 0.97 × 2.50 |
| 4 | 2.9 | 255 | Eso ca. | Distal eso | 54.1 | 512 × 512 × 128 | 0.97 × 0.97 × 2.50 |
| 5 | 2.4 | 191 | Eso ca. | Mid eso | 30.2 | 256 × 256 × 94 | 0.97 × 0.97 × 2.50 |
| 6 | 4.0 | 673 | SCLC | LLL | 132 | 512 × 512 × 128 | 0.97 × 0.97 × 2.50 |
Note: C = case; Eso ca. = esophagus cancer; SCLC = small cell lung cancer; LLL = left lower lobe; GE jxn = Gastro-esophageal junction; and GTV = gross tumor volume.
All patients were treated for esophagus or lung cancer in the Department of Radiation Oncology at The University of Texas MD Anderson Cancer Center. The patient underwent a normal resting breathing in the supine position and the identifiers were removed according to a retrospective study protocol approved by the Institutional Review Board (RCR 03-0800). Using the respiratory signal from the Real-Time Position Management Respiratory Gating System (Varian Medical Systems, Palo Alto, CA), 4DCT images of the entire thorax and upper abdomen were acquired at 2.5 mm slice spacing on a PET/CT scanner (Discovery ST; GE Medical Systems, Waukesha, WI) with a 70 cm bore. We use images at EE and EI phases from the 4D CT sets for our experiments.
Qualitative evaluation
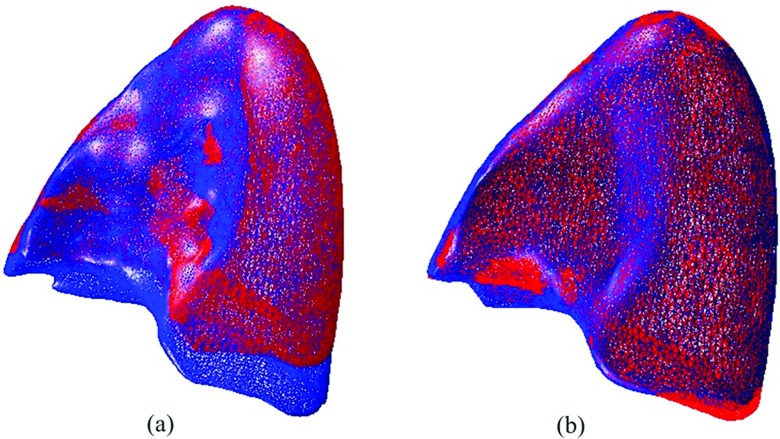
The proposed method has been used to deform the lung model from EE status to EI phase. In order to qualitatively visualize the deformation, the registration results are presented in two ways. First, The EI surface mesh was superimposed with the EE surface meshes before and after deformation. Figure 3a illustrates the differences between the EI surface mesh and the EE surface mesh before deformation. Using the proposed method, the EE surface is expended according to the EI surface, which reduces the differences after deformation. Figure 3b illustrates the comparison between the EI and the deformed EE surface meshes. The two meshes are in agreement with each other in general. Only some small deformation errors remain which are possibly due to the segmentation uncertainties.
Figure 3.
Comparison of surface meshes overlay between exhale and inhale: (a) prior to registration and (b) after registration.
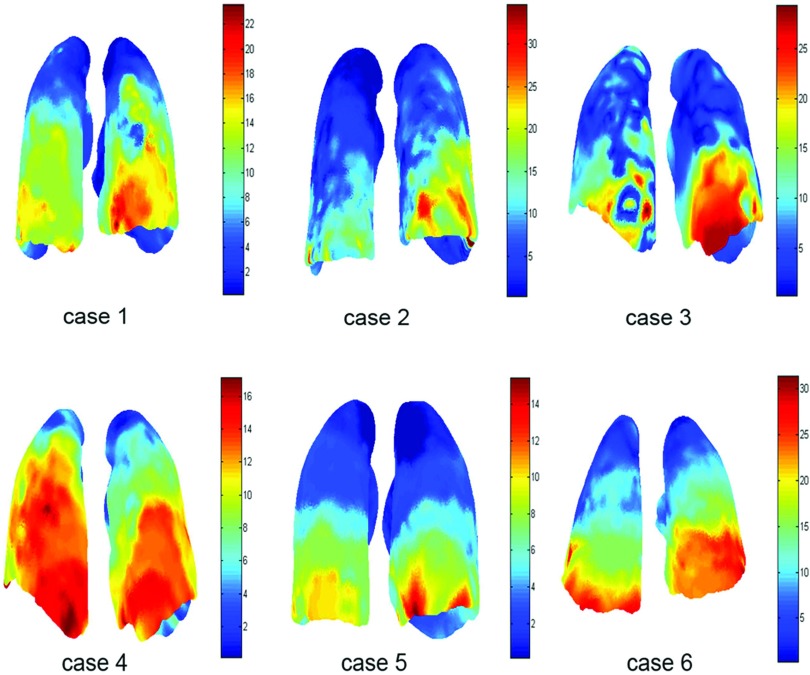
Second, the displacement field is measured for each case and represented in color as shown in Fig. 4. We can see that the motion magnitude varies from the top to the bottom of lungs with the maximal deformation occurring at the lower lobes because of the large diaphragm motion. In addition, the lung experiences the main motion in the SI direction. Cases 4 and 5 depict smaller deformation magnitudes in relation to the other cases. This is mainly due to the fact that lungs in the two cases, as shown in Table 1, have less breathing volumes and shorter respiratory cycles.
Figure 4.
Visualization of displacement magnitude (mm) of the left and right lungs using the nonuniform model.
Quantitative validation
Based on the validation framework introduced by Castillo et al.,23 a large number of expert determined landmark pairs are used to estimate the registration spatial accuracy. Table 2 summarizes the characteristics of the landmarks for the six cases used in this paper and previously described in publications.24, 25
Table 2.
The characteristics of landmarks.
| Landmark number in lungs |
Average displacements (standard deviation) (mm) |
|||||||
|---|---|---|---|---|---|---|---|---|
| C | Total | Left | Right | Intraobserver error (mm) | 3D- Euclidean | Anterior–posterior | Left–right | Superior–inferior |
| 1 | 1560 | 802 | 758 | 0.77 (1.01) | 9.42 (4.81) | 1.28 (1.23) | 1.17 (1.05) | 6.10 (4.49) |
| 2 | 1268 | 661 | 607 | 0.92 (1.16) | 7.10 (5.15) | 1.74 (1.66) | 0.86 (0.96) | 6.30 (5.45) |
| 3 | 398 | 204 | 194 | 0.81 (1.32) | 11.59 (7.87) | 2.13 (1.54) | 1.28 (1.17) | 10.85 (8.29) |
| 4 | 342 | 117 | 165 | 0.75 (1.09) | 7.82 (3.99) | 2.98 (1.93) | 1.25 (1.02) | 6.45 (4.51) |
| 5 | 1280 | 672 | 608 | 0.85 (1.24) | 4.01 (2.91) | 0.67 (0.79) | 0.58 (0.62) | 3.68 (3.04) |
| 6 | 419 | 230 | 189 | 0.97 (1.38) | 11.10 (6.98) | 2.53 (2.10) | 2.15 (1.89) | 10.21 (6.97) |
The registration spatial error is calculated as the 3D Euclidean distance between the target position manually determined by experts and the computed target location from the registration method. For each case, the mean error and standard deviation are calculated in anterior–posterior (AP), left–right (LR), and superior–inferior (SI) directions, respectively. For comparison, the spatial error of the same six cases using the VF method and a standard uniform Young's modulus FEM model are also measured. Table 3 shows the spatial accuracy results for the VF method, uniform and the proposed nonuniform models. For each of the six cases, the mean error ranged from 1.00(0.81) to 1.76(1.52) mm for the nonuniform model, from 1.21(0.64) to 4.79(5.35) mm for the uniform model, and from 0.98(0.91) to 1.83(2.17) mm for the VF method. In AP, LR, and SI directions, each overall mean error is less than 0.8 mm for nonuniform model but larger than 1 mm for uniform model. Table 3 demonstrates that the nonuniform model produces lower spatial error across all cases with an overall 3D mean error of 1.30(0.97) mm, as opposed to 3.05(2.36) mm spatial error obtained by the uniform model. Although the VF method obtains a similar overall 3D mean error of 1.34(1.64) mm, we note that the standard deviation (in 3D-Euclidean) produced by the nonuniform model is always lower than that produced by the VF method for each half lung.
Table 3.
The registration results of the VF method, the uniform and nonuniform models using landmarks.
| Average spatial error of registration (mm) |
||||||
|---|---|---|---|---|---|---|
| C | Lungs | Models/methods | 3D- Euclidean | Left–right | Anterior–posterior | Superior–inferior |
| 1 | LL | VF | 1.13 (0.92) | 0.47 (0.50) | 0.44 (0.48) | 0.69 (0.89) |
| Uniform | 2.15 (1.67) | 1.10 (1.13) | 0.64 (0.56) | 1.39 (1.49) | ||
| Nonuniform | 1.15 (0.87) | 0.48 (0.52) | 0.44 (0.48) | 0.69 (0.82) | ||
| RL | VF | 1.24 (2.18) | 0.56 (1.92) | 0.46 (0.53) | 0.65 (1.18) | |
| Uniform | 2.83 (1.93) | 0.94 (0.81) | 1.30 (1.22) | 1.96 (1.79) | ||
| Nonuniform | 1.12 (0.81) | 0.48 (0.48) | 0.46 (0.46) | 0.65 (0.80) | ||
| 2 | LL | VF | 1.83 (2.17) | 0.93 (1.64) | 0.71 (0.89) | 1.00 (1.50) |
| Uniform | 4.61 (4.15) | 2.25 (2.39) | 1.43 (1.31) | 2.98 (3.88) | ||
| Nonuniform | 1.76 (1.52) | 0.86 (1.08) | 0.69 (0.72) | 1.03 (1.21) | ||
| RL | VF | 1.45 (2.77) | 0.62 (0.80) | 0.48 (0.65) | 0.88 (2.71) | |
| Uniform | 3.22 (3.33) | 1.26 (1.25) | 0.99 (1.26) | 2.37 (3.18) | ||
| Nonuniform | 1.22 (1.06) | 0.58 (0.61) | 0.43 (0.48) | 0.71 (1.00) | ||
| 3 | LL | VF | 1.09 (0.77) | 0.45 (0.42) | 0.44 (0.40) | 0.65 (0.80) |
| Uniform | 2.66 (1.40) | 1.24 (0.86) | 1.06 (0.95) | 1.69 (1.36) | ||
| Nonuniform | 1.17 (0.76) | 0.50 (0.48) | 0.52 (0.50) | 0.68 (0.69) | ||
| RL | VF | 1.50 (1.13) | 0.67 (0.59) | 0.62 (0.61) | 0.82 (1.11) | |
| Uniform | 4.28 (2.27) | 1.94 (1.62) | 1.30 (1.04) | 2.91 (2.43) | ||
| Nonuniform | 1.59 (1.06) | 0.69 (0.59) | 0.62 (0.59) | 1.03 (1.02) | ||
| 4 | LL | VF | 1.44 (2.35) | 0.72 (1.40) | 0.56 (0.85) | 0.77 (1.87) |
| Uniform | 4.79 (5.35) | 2.70 (3.78) | 1.64 (1.83) | 2.71 (4.08) | ||
| Nonuniform | 1.17 (0.78) | 0.53 (0.49) | 0.50 (0.50) | 0.64 (0.75) | ||
| RL | VF | 1.34 (0.98) | 0.64 (0.68) | 0.47 (0.46) | 0.79 (0.91) | |
| Uniform | 3.20 (1.62) | 2.07 (1.69) | 1.20 (0.94) | 1.50 (1.07) | ||
| Nonuniform | 1.40 (0.94) | 0.69 (0.66) | 0.66 (0.49) | 0.87 (0.81) | ||
| 5 | LL | VF | 1.01 (1.48) | 0.32 (0.53) | 0.36 (0.72) | 0.64 (1.33) |
| Uniform | 1.40 (1.79) | 0.43 (0.42) | 0.56 (0.97) | 1.02 (1.59) | ||
| Nonuniform | 1.09 (1.01) | 0.42 (0.61) | 0.35 (0.39) | 0.69 (0.95) | ||
| RL | VF | 0.98 (0.91) | 0.41 (0.53) | 0.38 (0.45) | 0.51 (0.87) | |
| Uniform | 1.21 (0.64) | 0.51 (0.45) | 0.45 (0.37) | 0.84 (0.61) | ||
| Nonuniform | 1.00 (0.81) | 0.42 (0.45) | 0.38 (0.39) | 0.57 (0.81) | ||
| 6 | LL | VF | 1.69 (2.87) | 0.67 (0.90) | 0.89 (2.73) | 0.79 (0.99) |
| Uniform | 3.06 (2.13) | 1.23 (1.24) | 1.13 (1.29) | 2.12 (1.87) | ||
| Nonuniform | 1.49 (1.01) | 0.71 (0.73) | 0.66 (0.64) | 0.84 (0.81) | ||
| RL | VF | 1.43 (1.16) | 0.66 (0.68) | 0.51 (0.55) | 0.90 (1.06) | |
| Uniform | 3.15 (2.06) | 1.40 (1.42) | 0.98 (0.80) | 2.28 (1.84) | ||
| Nonuniform | 1.45 (1.06) | 0.66 (0.67) | 0.49 (0.46) | 0.97 (0.97) | ||
| Average | VF | 1.34 (1.64) | 0.59 (0.88) | 0.53 (0.78) | 0.76 (1.27) | |
| Uniform | 3.05 (2.36) | 1.42 (1.42) | 1.06 (1.05) | 1.98 (2.10) | ||
| Nonuniform | 1.30 (0.97) | 0.59 (0.61) | 0.52 (0.51) | 0.78 (0.89) | ||
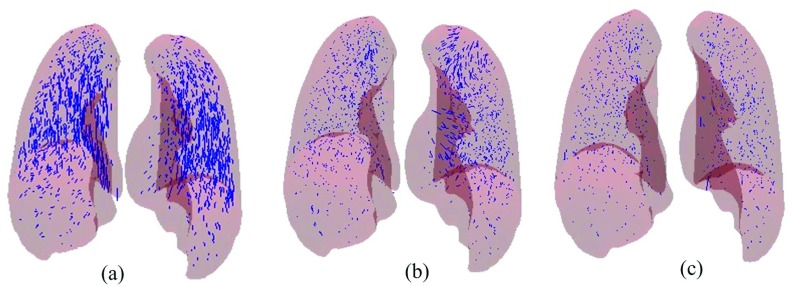
Figure 5 illustrates the error vectors of 1560 landmark pairs for case 1 between EE and EI phases. Figure 5a shows the expert-determined displacement vectors. Figures 5b, 5c show displacement error vectors of the uniform and nonuniform models, respectively. We can see that most error vectors become smaller in Fig. 5b, which are substantially reduced without visually apparent error in Fig. 5c. Specifically, the mean errors for the left and right lungs are 2.15(1.67) and 2.83 (1.93) mm, respectively, for the uniform model shown in Fig. 5b, whereas the errors achieved by the nonuniform model for the left and right lung, depicted in Fig. 5c, are 1.15(0.87) and 1.12(0.81), respectively.
Figure 5.
DIR errors of Landmark points for case 1: (a) expert-determined displacement vectors, (b) residual error vectors for uniform model, and (c) residual error for the proposed model.
Modeling characteristics
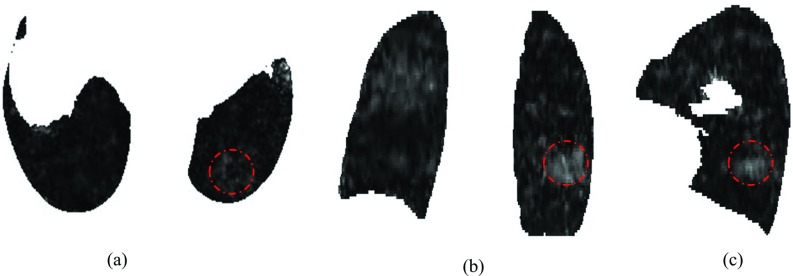
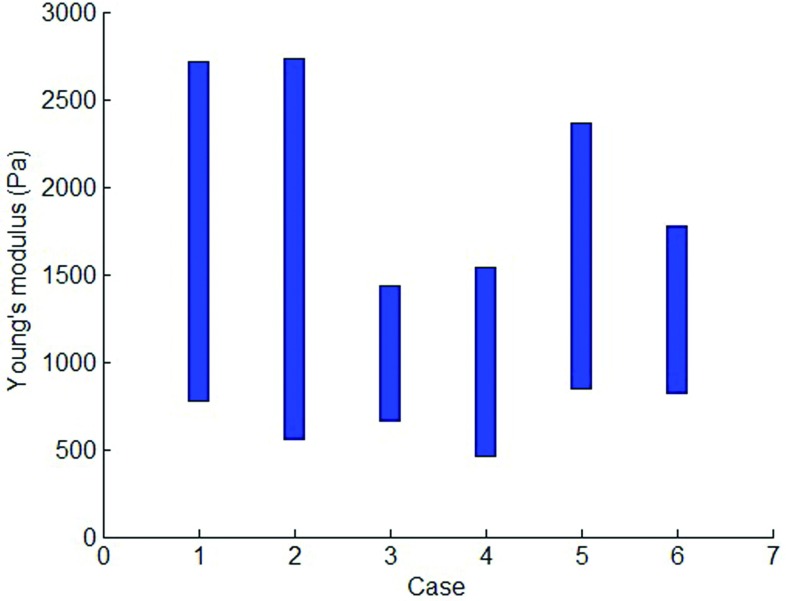
Figure 6 shows an example of the Young's modulus distribution in axial, coronal, and sagittal slices for case 6 and shows that the location-specific Young's modulus varies through the whole lung, which indicates characteristics of the inhomogeneous tissue. We calculate the average Young's modulus for each axial slice to generate the patient-specific range of Young's modulus that is shown in Fig. 7.
Figure 6.
The inhomogeneous Young's modulus distribution in 2D: (a) axial, (b) coronal, and (c) sagittal slices for case 6 with tumor area (indicated by circles).
Figure 7.
The range of Young's modulus for different cases.
One concern about the proposed method is the required computational workload, which is dominated by computing the stiffness and sensitivity matrices as well as block matching. One way to reduce computation time is to decrease the number of elements. However, this approach is limited in that accurate lung modeling requires a fine mesh to represent complex geometries. Table 4 illustrates characteristics of the model and algorithm computational time for each case. Table 4 shows that each lung is meshed with a large number of nodes and elements but maintains a fast computation speed. This is because the computational workload is effectively handled by utilizing GPU computing, a standard practice for accelerating image processing and radiation dose calculations. For a volumetric mesh with 482 073 tetrahedral elements and 108 387 nodes, it takes almost 10 h for a sequential MATLAB implementation to complete the stiffness matrix calculation, but only 483.91 s for the FEM simulation on an NVIDIA Tesla 2070 GPU.
Table 4.
Characteristics of the model and algorithm computational time.
| C | Point pair number from the VF registration | The VF registration time (s) | Lungs | Node number | Element number | FEM simulation time (s) |
|---|---|---|---|---|---|---|
| 1 | 7568 | 102.23 | LL | 84 282 | 372 239 | 436.95 |
| RL | 80 732 | 355 225 | 417.19 | |||
| 2 | 6517 | 92.03 | LL | 27 892 | 129 020 | 148.25 |
| RL | 68 090 | 300 320 | 289.4 | |||
| 3 | 9727 | 274.72 | LL | 91 669 | 407 946 | 479.97 |
| RL | 83 404 | 369 122 | 454.14 | |||
| 4 | 40 792 | 994.92 | LL | 50 709 | 220 024 | 621.52 |
| RL | 85 282 | 380 982 | 919.81 | |||
| 5 | 15 611 | 458.20 | LL | 69 483 | 307 152 | 444.52 |
| RL | 63 693 | 277 699 | 395.84 | |||
| 6 | 8243 | 102.51 | LL | 108 387 | 482 073 | 483.91 |
| RL | 77 768 | 363 181 | 415.14 |
DISCUSSION AND CONCLUSIONS
In this study, a novel approach for modeling lung motion based on block matching registration and elasticity was presented and applied to 4DCT images from six patients. The method utilized the block-matching algorithm to determine the boundary conditions for the FEM to calculate the lung motion from exhale to inhale. The FEM model allows for an unknown Young's modulus distribution that is assumed to be position-specific and patient-specific. The proposed methodology and the intensity based VF method, as well as a standard FEM approach with constant Young's modulus, were evaluated using large sets of expert-determined landmark point pairs. Results demonstrate that the proposed algorithm achieves significantly improved accuracy in lung deformation.
The validation of DIR methods is in general a difficult problem due to a lack of gold standards. One measure used within the literature is image similarity. However, image similarity is calculated with respect to intensity, which has been shown to be unreliable for the evaluation of spatial accuracy by many investigators.23, 14, 24 In previous publications, large sets of expert-determined landmark point pairs have been shown to effectively evaluate the spatial errors in registration. The data utilized in this study are freely available for download at www.dir-lab.com.
The influence of material parameters including Young's modulus and Poisson's ratio has been previously investigated.9, 2 In these studies, the Young's modulus varies from 0.1 to 7.8 kPa and the Poisson's ratio is between 0.2 and 0.45. These works conclude that the incorporation of nonconstant parameters values into the elasticity model would only marginally affect the displacement fields inside lungs. However, these studies only considered variance with respect to time. Spatially, a uniform model is employed. Using the uniform model, it can be observed that the registration error increases with the increasing tumor size in Table 3. For instance, case 2 has a large tumor and its registration error is relatively high as a result. Similar reports can be found in the literature.2 However, case 4 has the largest spatial error on average but contains a relatively small tumor. Therefore, we are not able to conclude that the tumor size is the only factor to affect the registration accuracy. But, based on our numerical experiments, larger tumors do seem to have more influence on the elasticity of lungs suggesting that the uniform model is lacking.
Though previous studies offer insights into lung modeling, none have presented the estimation of elasticity distribution over the entire lungs. In our study, we assume the mechanical properties of lung tissue to be inhomogeneous. Specifically, the material properties are assigned to be position-specific and individual-specific, which leads to a nonuniform model where the elasticity distribution is taken into account while computing the lung deformation. For simplicity, we assume a constant Poisson's ratio and only allow the Young's modulus to vary spatially. The unknown Young's modulus distribution is determined by a quasi-Newton method. Comparison with a standard uniform model reveals that the proposed nonuniform model exhibits the superior performance in terms of spatial accuracy and provides a significantly increased precision in motion predication for all cases. This finding indicates that the elasticity distribution has a substantial impact on the registration accuracy. The relatively small effect of Poisson's ratio on estimated lung deformations has also been reported by Brock et al.7 Naturally, lung tissue consists of many different structures, each of which should result in a different Poisson's ratio. It is possible that incorporating this behavior into the deformation model would have some effect on the registration accuracy. Research into the effect of Poisson's ratio distribution is our future work.
The proposed nonuniform biomechanical model can replace the uniform model in application because it achieves much more accurate registration than the uniform biomechanical model. The intensity based VF registration is good at registration for high contrast regions, which leads to accurate boundary conditions for the FEM. However, it loses physical meaning and may not be sufficiently realistic since the method only uses the local intensity information and does not consider spatially globe anatomic relationships. In our nonuniform model, the relationship among the force, stress, and strain is established locally at each tetrahedron and globally as a system with all the elements. Compared to the intensity based method, the proposed model conducts registration without loss of accuracy and provides a quantitative elasticity distribution directly from images without measurement. Moreover, tissue elasticity estimated by our method is position-specific and patient-specific, which would be of great significance in clinical application. For example, Young's modulus would be helpful for detection of the tumor area since abnormalities have different elasticity compared to the normal tissue.
ACKNOWLEDGMENTS
This work is partially funded by the National Institutes of Health through a NIH Director's New Innovator Award No. DP2OD007044. This research is also supported in part by grants from the National Natural Science Foundation of China (NSFC, Grant No. 60771025).
References
- Werner R., Ehrhardt J., Schmidt-Richberg A., and Handels H., “Validation and comparison of a biophysical modeling approach and non-linear registration for estimation of lung motion fields in thoracic 4D CT data,” Proc. SPIE 7259, 72590U (2009). 10.1117/12.811130 [DOI] [Google Scholar]
- Werner R., Ehrhardt J., Schmidt R., and Handels H., “Patient-specific finite element modeling of respiratory lung motion using 4D CT image data,” Med. Phys. 36(5), 1500–1511 (2009). 10.1118/1.3101820 [DOI] [PubMed] [Google Scholar]
- Guerrero T., Sanders K., Castillo E., Zhang Y., Bidaut L., Pan T., and Komaki R., “Dynamic ventilation imaging from four-dimensional computed tomography,” Phys. Med. Biol. 51, 777–791 (2006). 10.1088/0031-9155/51/4/002 [DOI] [PubMed] [Google Scholar]
- Al-Mayah A., Moseley J., and Brock K. K., “Contact surface and material nonlinearity modeling of human lungs,” Phys. Med. Biol. 53(1), 305–317 (2008). 10.1088/0031-9155/53/1/022 [DOI] [PubMed] [Google Scholar]
- Mead J., Takishima T., and Leith D., “Stress distribution in lungs: A model of pulmonary elasticity,” J. Appl. Physiol. 28, 596–608 (1970). [DOI] [PubMed] [Google Scholar]
- Lee G. C. and Frankus A., “Elasticity properties of lung parenchyma derived from experimental distortion data,” Biophys. J. 15, 481–493 (1975). 10.1016/S0006-3495(75)85832-2 [DOI] [PMC free article] [PubMed] [Google Scholar]
- Brock K. K., Sharpe M. B., Dawson L. A., Kim S. M., and Jaffray D. A., “Accuracy of finite element model-based multi-organ deformable image registration,” Med. Phys. 32(6), 1647–1659 (2005). 10.1118/1.1915012 [DOI] [PubMed] [Google Scholar]
- Brock K. K., “Results of a multi-institution deformable registration accuracy study (midras),” Int. J. Radiat. Oncol., Biol., Phys. 76(2), 583–596 (2010). 10.1016/j.ijrobp.2009.06.031 [DOI] [PubMed] [Google Scholar]
- Werner R., Ehrhardt J., Schmidt R., and Handels H., “Modeling respiratory lung motion: A biophysical approach using finite element methods,” Proc. SPIE 6916, 69160N (2008). 10.1117/12.769155 [DOI] [Google Scholar]
- Al-Mayah A., Moseley J., Velec M., and Brock K. K., “Toward efficient biomechanical-based deformable image registration of lungs for image-guided radiotherapy,” Phys. Med. Biol. 56(15), 4701–4713 (2011). 10.1088/0031-9155/56/15/005 [DOI] [PMC free article] [PubMed] [Google Scholar]
- Matthews F. L. and West J. B., “Finite element displacement analysis of a lung,” J. Biomech. 5, 591–600 (1972). 10.1016/0021-9290(72)90031-0 [DOI] [PubMed] [Google Scholar]
- Sundaram S. H. and Feng C. C., “Finite element analysis of the human thorax,” J. Biomech. 10, 505–516 (1977). 10.1016/0021-9290(77)90104-X [DOI] [PubMed] [Google Scholar]
- Zeng Y. J., Yager D., and Fung Y. C., “Measurement of the mechanical properties of the human lung tissue,” J. Biomech. Eng. 109, 169–174 (1987). 10.1115/1.3138661 [DOI] [PubMed] [Google Scholar]
- Li P., Malsch U., and Bendl R., “Combination of intensity-based image registration with 3D simulation in radiation therapy,” Phys. Med. Biol. 53(17), 4621–4637 (2008). 10.1088/0031-9155/53/17/011 [DOI] [PubMed] [Google Scholar]
- Zhong H., Kim J., Li H., Nurushev T., Movsas B., and Chetty I. J., “A finite element method to correct deformable image registration errors in low-contrast regions,” Phys. Med. Biol. 57(11), 3499–3515 (2012). 10.1088/0031-9155/57/11/3499 [DOI] [PMC free article] [PubMed] [Google Scholar]
- Carter T. J., Sermesant M., Cash D. M., Barratt D. C., Tanner C., and Hawkes D. J., “Application of soft tissue modelling to image-guided surgery,” Med. Eng. Phys. 27(10), 893–909 (2005). 10.1016/j.medengphy.2005.10.005 [DOI] [PubMed] [Google Scholar]
- Castillo R., Castillo E., Martinez J., and Guerrero T., “Ventilation from four-dimensional computed tomography: Density versus Jacobian methods,” Phys. Med. Biol. 55(16), 4661–4685 (2010). 10.1088/0031-9155/55/16/004 [DOI] [PubMed] [Google Scholar]
- Lorensen W. E. and Cline H. E., “Marching cubes: A high resolution 3D surface construction algorithm,” Comput. Graph. Proc. Annu. Conf. Ser. 21(4), 163–170 (1987). 10.1145/37402.37422 [DOI] [Google Scholar]
- Nealen A., Igarashi T., Sorkine O., and Alexa M., “Laplacian mesh optimization,” in Proceedings of ACM GRAPHITE (ACM, NY, 2006), pp. 381–389.
- Fang Q. and Boas D., “Tetrahedral mesh generation from volumetric binary and gray-scale images,” in Proceedings of IEEE International Symposium on Biomedical Imaging (IEEE, Boston, MA, 2009), pp. 1142–1145.
- Christensen G. E., Rabbitt R. D., and Miller M. I., “3D brain mapping using deformable neuroanatomy,” Phys. Med. Biol. 39, 609–618 (1994). 10.1088/0031-9155/39/3/022 [DOI] [PubMed] [Google Scholar]
- Dey T. K. and Sun J., “An adaptive MLS surface for reconstruction with guarantees,” in Proceedings of the Eurographics Symposium on Geometry Processing (ACM, Vienna, 2005), pp. 43–52.
- Castillo R., Castillo E., Guerra R., Johnson V., McPhail T., Garg A., and Guerrero T., “A framework for evaluation of deformable image registration spatial accuracy using large landmark point sets,” Phys. Med. Biol. 54(7), 1849–1870 (2009). 10.1088/0031-9155/54/7/001 [DOI] [PubMed] [Google Scholar]
- Castillo E., Castillo R., Martinez J., Shenoy M., and Guerrero T., “Four-dimensional deform-able image registration using trajectory modeling,” Phys. Med. Biol. 55(1), 305–327 (2010). 10.1088/0031-9155/55/1/018 [DOI] [PMC free article] [PubMed] [Google Scholar]
- Castillo E., Castillo R., White B., Rojo J., and Guerrero T., “Least median of squares filtering of locally optimal point matches for compressible flow image registration,” Phys. Med. Biol. 57(15), 4827–4833 (2012). 10.1088/0031-9155/57/15/4827 [DOI] [PMC free article] [PubMed] [Google Scholar]


