

Abstract
Background
In comparison to late-onset Alzheimer’s disease (LO-AD, onset > 65), early age-of-onset Alzheimer’s disease (EO-AD, onset<65 years) more often presents with language, visuospatial and/or executive impairment, often occurring earlier than a progressive memory deficit. The logopenic variant of primary progressive aphasia (lv-PPA) and the posterior cortical atrophy (PCA) have recently been described as possible atypical variants of EO-AD. Lv-PPA is characterized by isolated language deficit, while PCA is characterized by predominant visuospatial deficits. Severe hemispheric grey matter (GM) atrophy associated with EO-AD, lv-PPA and PCA has been described, but regional patterns of white matter (WM) damage are still poorly understood.
Methods
Using structural MRI and voxel-based morphometry, we investigated WM damage in 16 EO-AD, 13 PCA, 10 lv-PPA, and 14 LO-AD patients at presentation, and 72 age-matched controls.
Results
In EO-AD, PCA and lv-PPA patients, WM atrophy was centered on lateral temporal and parietal regions, including cingulum and posterior corpus callosum. Compared to controls, lv-PPA patients showed a more severe left parietal damage, and PCA showed a more severe occipital atrophy. Moreover, EO-AD had greater cingulum atrophy compared with LO-AD. LO-AD showed WM damage in medial temporal regions and less extensive hemispheric involvement.
Conclusions
Patterns of WM damage in EO-AD, lv-PPA and PCA are consistent with the clinical syndromes and GM atrophy patterns. WM injury in AD atypical variants may contribute to symptoms and disease pathogenesis.
Keywords: Alzheimer’s disease, white matter damage, cerebral network, age of onset, VBM
1. Introduction
Alzheimer’s disease (AD) can present with distinct clinical profiles, depending on the age of onset. Typical late-onset AD (> 65 years; LO-AD) presents with the classical progressive amnestic syndrome, while the AD with early age-of-onset (< 65 years; EO-AD) is often characterized by atypical manifestations with greater impairment in attention, executive, language, and visuo–spatial functions at the time of presentation. Furthermore, we have previously demonstrated (1) that two relatively focal, early-onset (usually before 65 years) clinical syndromes, i.e., posterior cortical atrophy (PCA) (2) and logopenic variant of primary progressive aphasia (lv-PPA)(3), are often clinical variants of Alzheimer’s pathology and can thus be considered clinical variants of EO-AD.
PCA is characterized by initially isolated, progressive impairment of higher order visual and visuo-spatial skills, which usually manifest as visual agnosia, prosopagnosia, environmental disorientation and elements of Balint’s syndrome (4,5). Consistent with their clinical presentation, patients with PCA show brain damage in parieto-occipital and posterior temporal cortices, which is often more prominent in the right hemisphere (6–9). Lv-PPA is a progressive language disorder characterized by slow speech, sentence repetition, and comprehension deficits, and relative sparing of motor speech, grammar, and single-word comprehension. Significant atrophy is located in the left posterior temporoparietal region (10).
A growing number of imaging studies are exploring white matter (WM) damage in typical LO-AD, mainly reporting widespread WM abnormalities and tissue loss in the temporal, parietal, and frontal lobes, as well as in the corpus callosum (11). Despite the clinical interest for the younger-onset form of AD, very few studies have explored the in vivo pattern of WM involvement in EO-AD (12), as well as in lv-PPA (13,14) and PCA (15–17).
The aim of the present study was to explore the patterns of WM atrophy in EO-AD and in its atypical lv-PPA and PCA variants, and to compare them with that of typical LO-AD. We hypothesized that younger patients would show preferential WM loss in posterior neocortical brain regions, and that such a pattern would be more global and symmetric in EO-AD and centered on the lateral parietal regions, with right- and left-lateralization in PCA and lv-PPA, respectively. In contrast, we expected that LO-AD patients would have a more circumscribed involvement of the medial temporal WM.
2. Methods
2.1 Subjects
Eligible subjects were identified by searching the database at the University of California San Francisco (UCSF), Memory and Aging Center for patients meeting criteria for AD, PCA and lv-PPA. Clinical diagnosis was based on a multi-disciplinary evaluation including a history and neurological examination by a neurologist, caregiver interview by a nurse, and a neuropsychological test battery by a neuropsychologist. The diagnosis of probable AD was based on standard research criteria (18), in which memory impairment is required, even if in younger patients it does not have to be the main symptom. Then, based on the age of onset (age at the first symptom as reported by patient and caregivers), AD patients were divided into EO- (<65) and LO-AD (>65). Memory impairment constituted the main clinical complaint in older patients. As expected (19), younger AD patients presented at first evaluation with important attention/executive, visuospatial, praxis and language deficits, while memory deficits, when present early, were often not considered the major cause of functional impairment. The following diagnostic criteria were applied, respectively, for PCA and lv-PPA: McMonagle et al. (20) and Alladi et al. (21) criteria, and Gorno-Tempini et al. (10).
Thirty right-handed AD patients (16 EO-AD and 14 LO-AD) were included. The group size (16/14) was chosen to preserve similar power for the EO-AD (mean age= 61 years) and LO-AD (mean age= 78 years) analyses. Thirteen patients with PCA (mean age= 61 years) and 10 patients with lv-PPA (mean age= 63 years) were also identified (Table 1). In order to be included in the study, patients needed to have a high-quality MRI within six months of the first clinical evaluation. No patient had a clear dominant family history of dementia or psychiatric diseases. During the diagnostic procedure, conventional MRI scans were used to exclude other causes of focal or diffuse brain damage, including extensive WM disease. All the patients but those with LO-AD were included in our previous paper (1).
Table 1.
Demographic and global cognitive assessment data (at time of the scan) for patients and controls.
| PCA | lv-PPA | EOAD | LOAD | Controls | |
|---|---|---|---|---|---|
| Number of subjects | 13 | 10 | 16 | 14 | 72 |
| Female/male | 8/5 | 4/6 | 6/10 | 6/8 | 42/30 |
| Mean age at MRI (SD) [years] | 61 (8.2) | 63.5 (7.2) | 60.7 (3.7) | 78.3 (5.6) * | 62.3 (10.4) |
| Right/left handed | 11/2 | 9/1 | 15/1 | 14/0 | 68/5 |
| Education (SD) [years] | 15.1 (2.9) | 17.2 (3.6) | 15.8 (4.1) | 15.8 (2.8) | 17.6 (2.4) |
| Disease duration (SD) [years] | 3.3 (1.9) | 3.3 (2.1) | 4 (2.3) | 3.6 (1.4) | - |
| MMSE (SD) | 20.6 (7.0) | 20.5 (4.4) | 21.3 (5.6) | 22.9 (6.9) | 29.8 (0.4)† |
p< 0.001 vs. early onset forms;
p< 0.001 vs. patients
As previously reported (1), PET with the beta-amyloid tracer 11C-labeled Pittsburgh Compound-B (PIB) study was conducted in a subgroup of patients: three PCA, four lv-PPA, and seven EO-AD. Autopsies were performed at UCSF for three additional patients: one PCA, one lv-PPA, and one EO-AD, showing in all cases amyloid deposition (on PET) or AD pathology at autopsy.
Seventy-two healthy subjects, with no history of neurological or major psychiatric disorders (longstanding Axis I psychiatric disorder), were studied (younger controls: 38 women, 27 men, mean age= 61 years; older controls: 21 women, 10 men, mean age= 73 years).
The study was approved by the UCSF committee on human research. All subjects provided written informed consent before participating.
2.2 Cognitive testing
The neuropsychological measures included in our bedside screening protocol, previously described (22,23), are reported for EO-AD, PCA and lv-PPA patients in the previous study (1), as well as in e-Table 1. Patients affected by LO-AD underwent a comparable cognitive protocol (e-Table 2).
2.3 Neuroimaging Study
MRI scanning
MRI scans were obtained on a 1.5 Tesla Magnetom VISION system (Siemens, Iselin, NJ). Structural MRI sequences included: (1) double spin echo sequence (repetion time [TR]=5000 ms, echo time [TE]=20/80 ms, 51 contiguous axial slices, thickness=3 mm, 1.0 × 1.25 mm2 in-plane resolution); and (2) volumetric magnetization prepared rapid gradient echo (MP-RAGE) sequence (TR=10 ms, TE=4 ms, inversion time=300 ms, flip angle=15°, coronal orientation perpendicular to the double echo sequence, matrix size=256 × 192, voxel resolution=1.0 × 1.0 × 1.0 mm, slab thickness=1.5 mm). In patients with multiple MRI scans, the earliest available MRI was used for analysis.
Voxel-based morphometry analysis
Voxel-based morphometry (VBM) was performed using the Statistical Parametric Mapping software (SPM5, Welcome Department of Imaging Neuroscience, London; http://www.fil.ion.ucl.ac.uk/spm) running on Matlab 7.2.1 (Math-Works, Natick, MA). First, T1-weighted images were segmented into GM, WM and cerebral spinal fluid (CSF) by using the standard unified segmentation model (24). Then, GM and WM segmented images were normalized, respectively, to the GM and WM population templates generated from the complete image set using the Diffeomorphic Anatomical Registration using Exponentiated Lie algebra (DARTEL) registration method(25). Spatially normalized images were modulated to ensure that the overall amount of each tissue class was not altered by the spatial normalization procedure. Since the DARTEL process warps to a common space that is smaller than MNI space, the modulated images from DARTEL were normalized to the MNI template using an affine transformation estimated from the DARTEL GM and WM template and the a priori GM and WM probability map without re-sampling. Finally, the images were smoothed with a 8-mm full-width at half-maximum Gaussian kernel. Smoothed images were used to perform a two sample t-test comparing patients and controls. Age, gender, and total intracranial volume (TIV) were entered as nuisance covariates.
The following sets of linear contrasts were performed to identify regional WM atrophy: (1) all patients vs. controls; (2) conjunction analyses of EO-AD, PCA, and lv-PPA vs. age-matched controls; (3) each syndrome separately: EO-AD, PCA, lv-PPA, and (4) LO-AD vs. age-matched controls; (5) EO-AD, PCA and lv-PPA syndrome vs. the others (EO-AD vs. PCA and lv-PPA; PCA vs. lv-PPA and EO-AD; lv-PPA vs. PCA and EO-AD); (6) older vs. younger controls. Moreover, in agreement with the contrasts analyses performed in the previous paper (1), regions of common atrophy across early onset syndromes were identified by inclusively masking the results of Contrast 2 with Contrast Set 3. Regions of atrophy more severe in each early onset syndrome compared to the other syndromes were identified by inclusively masking the relevant contrast from Set 3 (e.g., EO-AD vs. controls) with the appropriate contrast from Set 5 (e.g., EO-AD vs. lv-PPA and PCA). Finally, the conjunction analyses between the contrasts EO-AD vs. younger controls and LO-AD vs. older controls was assessed in order to evaluate the differences between the EO-AD and LO-AD. A significance threshold of p<0.05 corrected for multiple comparisons (Family Wise Error [FWE]) was accepted comparing patients vs. controls and of p<0.001 when directly comparing patient groups and controls groups. When used, masking thresholds were the same in all analysis with p=0.0025, because of three groups at the same time were compared.
2.4 Statistical Analyses
Group comparisons in continuous data were evaluated using ANOVA and post hoc Tukey tests, while dichotomous variables were compared using the χ2 test. Statistical analyses were performed using SPSS software (version 17 for windows; SPSS, Chicago, IL).
3. Results
3.1 Demographics and cognitive data
There were no significant group differences in gender, handedness, disease duration, or MMSE score between patient groups (Table 1). The patients with the early forms of AD were, as expected, younger than the LO-AD patients. Cognitive characteristics of the EO-AD, PCA, and lv-PPA have been already described in detail in our previous study (1) and here reported in e-Table 1, while cognitive characteristics of LO-AD group are reported in e-Table 2. In summary, patients with EO-AD performed worse than patients with lv-PPA on visual memory tasks. Patients with PCA scored lower on visuospatial tasks, while patients with lv-PPA performed better than other groups on all non-language-based tests (e-Table 1). In the LO-AD patients group, frequent impairments were observed on tests investigating memory, visuospatial function, language, and executive function; however, the most frequent impairment was in verbal memory recall (92.3% of subjects scored at least 1.5 SD below the normative mean in the 10-minute recall test)(e-Table 2).
3.2 Neuroimaging Data
WM areas atrophied in all patients vs. controls
Figure 1 shows WM volumes in all AD syndromes vs. younger and older normal subjects. The pattern of WM atrophy involved the WM underlying parietal regions, both dorsal (right x, y, z: 36, −60, 47 pFWE= 0.01; left x, y, z: −32, −51, 45 pFWE= 0.01) and medial (right x, y, z: 1, −42, 20 pFWE < 0.0001; left x, y, z: −4, −63, 29 pFWE= 0.001), the posterior temporal regions (right x, y, z: 40, −9, −35 pFWE < 0.0001; left x, y, z: −32, −7, −23 pFWE < 0.0001), and the parahippocampal regions (right x, y, z: 18, −13, −23 pFWE < 0.0001; left x, y, z: −18, −27, −18 pFWE < 0.0001), bilaterally. Smaller areas of WM atrophy were also found in the left inferior frontal and bilateral insula regions (right x, y, z: 40, −13, −23 pFWE= 0.020; left x, y, z: −11, 28, −25 pFWE < 0.0001). The posterior segment of the corpus callosum was also atrophied (p pFWE < 0.0001).
Figure 1.

Regions of WM atrophy in all AD patients compared with controls. Results are shown on the axial and sagittal sections of the Montreal Neurological Institute standard brain in neurological convention and displayed at the threshold p<0.05 corrected for multiple comparisons (Family Wise Error [FWE]).
WM areas atrophied in EO-AD, PCA, and lv-PPA vs. age-matched controls
The direct WM comparisons between each syndrome vs. controls are shown in figure 2 (A: EO-AD vs. controls, B: PCA vs. controls, C: lv-PPA vs. controls). The contrast of EO-AD patients to controls demonstrated WM atrophy in the medial parietal (right x, y, z: 23, −55, 32 pFWE < 0.0001; left x, y, z: −18, −57, 32 pFWE < 0.0001) and medial temporal (right x, y, z: 29, −4, −34 pFWE= 0.008; left x, y, z: −30, −4, −34 pFWE= 0.004) areas, symmetrically, as well as in the posterior part of corpus callosum (x, y, z: 4, −45, 20 pFWE < 0.0001). WM atrophy was also found in right lateral temporal lobe (x, y, z: 53, −27, −15 pFWE= 0.001). Compared to controls, PCA patients showed WM atrophy in the parietal (right x, y, z: 30, −58, 23 pFWE < 0.0001; left x, y, z: −37, −74, 21 pFWE < 0.0001), occipital (right x, y, z: 33, −56, −4 pFWE= 0.008; left x, y, z: −34, −59, −4 pFWE < 0.0001) and temporal regions (right x, y, z: 44, −44, 3 pFWE = 0.001; left x, y, z: −31, −40, −4 pFWE < 0.0001) bilaterally, but with right predominance, and in the posterior cingulum (x, y, z: 1, −44, 18 pFWE < 0.0001) and posterior part of the corpus callosum (x, y, z: 1, −36, 18 pFWE < 0.0001). Compared with controls, lv-PPA patients showed WM atrophy in left parietal region (x, y, z: −20, −57, 27 pFWE= 0.01).
Figure 2.

Regions of WM atrophy in each subgroup compared with matched healthy controls. A) EO-AD; B) PCA; C) lv-PPA, and D) LO-AD. Results are displayed on the coronal, sagittal and axial sections on SPM glass brain (upper) and WM DARTEL template (lower) and displayed at the threshold p<0.05 corrected for multiple comparisons (Family Wise Error [FWE]). Color bar indicates T values.
WM areas atrophied in LO-AD vs. age-matched controls
Compared to older controls LO-AD showed WM atrophy in parahippocampal regions (right x, y, z: 32, −21, −21 pFWE = 0.001; left x, y, z: −29, −24, −18 pFWE < 0.0001) (Figure 2, D: LO-AD vs. controls). In order to evaluate the involvement of cingulum WM regions, we lowered the threshold (p < 0.001 uncorrected), and a significant area of WM atrophy in the posterior (left x, y, z: −8, −47, 16; right x, y, z: 4, −45, 11−3), middle (left x, y, z: −5, −39, 37), and anterior (left x, y, z: −8, 30, −10; right x, y, z: 8, 26, −9) cingulate gyri (E-figure 1) was also found.
Common areas of WM atrophy in EO-AD, PCA, and lv-PPA vs. age-matched controls (masking analyses Contrast 2 with Contrast Set 3)
Regions of WM atrophy common to all early AD syndromes are shown in Figure 3. WM atrophy was found across the syndromes in posterior brain regions including medial (precuneus/cingulum region) and dorsal parietal, lateral temporal regions, bilaterally, and the posterior corpus callosum (p<0.05) (Figure 3 and Table 2 for details on p values, cluster size, proximal Broadmann areas, and probable long-range WM bundles involved).
Figure 3.
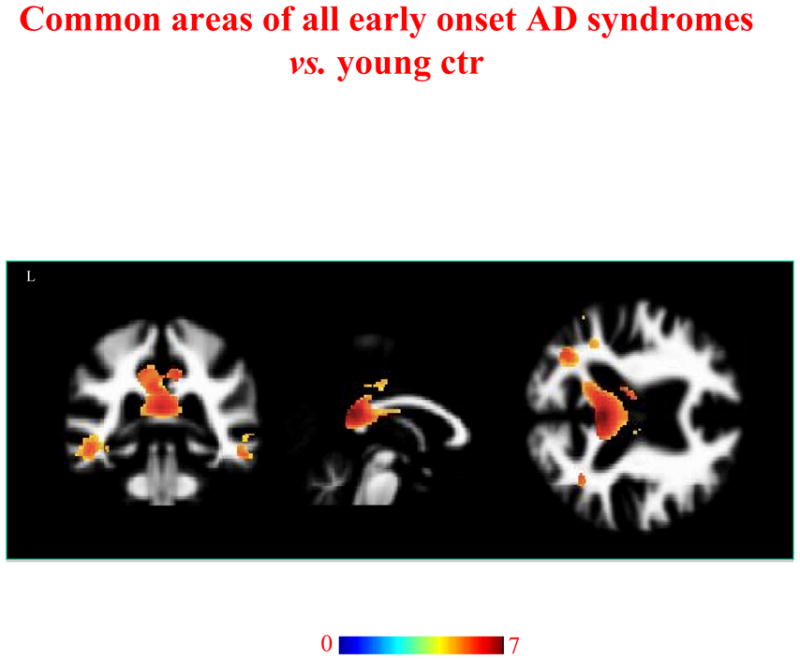
Regions of WM atrophy common to EO-AD, PCA and lv-PPA patients vs. controls. Results are displayed on the coronal, sagittal and axial sections on WM DARTEL template, at the threshold p<0.05 corrected for multiple comparisons (Family Wise Error [FWE]). Color bar indicates T values.
Table 2.
Upper table reports white matter (WM) areas commonly atrophied in all early onset patient-groups vs. younger controls (masking analyses). Lower table reports areas peculiarly affected in each early onset AD syndrome vs. younger controls and other patient groups (masking analyses).
| Common areas | ||||||
|---|---|---|---|---|---|---|
| White Matter anatomical region | Coordinates (x, y, z) | T value | pFWE | Cluster size | Proximal Broadmann areas | WM fasciculus |
| Dorsal parietal | R 17, −46,56 | 5.36 | 0.009 | 55 | 2, 4, 5, 7 | SLF |
| Medial parietal | R 1, −44,20 | 7.63 | ||||
| 25, −57,28 | 7.06 | < 0.0001 | 7, 19, 23, 26, 30 | Bilateral SLF, cingulum, corpus callosum | ||
| L −20, −57,28 | < 0.0001 | 9884 | 7, 19, 23, 26 | |||
| −5, −41,28 | < 0.0001 | 6980 | ||||
| < 0.0001 | ||||||
| Temporal lobe | R 44, −50, −4 | 6.74 | < 0.0001 | |||
| 46, −6, −18 | 6.00 | < 0.0001 | 2904 | 20, 21, 37 | Bilateral | |
| L −30, −1, −35 | 0.001 | 233 | 20, 28, 36 | SLF/arcuate, ILF/IFOF | ||
| −30, −3, −30 | 0.001 | |||||
| Peculiar areas | ||||||
| EO-AD | ||||||
| Medial parietal | R 19, −31,40 | 4.64 | 0.118 | 11 | 3, 23, 40 | SLF |
| L −21, −36,37 | 6.34 | 0.000 | 779 | 3, 23, 40 | SLF | |
| Frontal | R 15,43, −15 | 5.10 | 0.018 | 120 | 10, 11 | IFOF/uncina te |
| L−28,53, −10 | 4.65 | 0.043 | 168 | 10, 11 | IFOF/uncina te | |
| PCA | ||||||
| Occipital | R 38, −68,6 | 5.67 | 0.003 | 85 | 19, 37 | ILF |
| L −40, −78,23 | 6.36 | < 0.0001 | 18 | 19, 39 | ILF | |
| Parietal | R 4, −38,40 | 6.24 | < 0.0001 | 38 | 23, 40 | SLF |
| 56, −35,42 | < 0.0001 | |||||
| Temporal | R 33, −56, −4 | 5.39 | 0.075 | 33 | 19, 37 | ILF |
| L −31, −42, −3 | 6.30 | < 0.0001 | 158 | 37 | ILF | |
| Lv-PPA | ||||||
| Temporal | L −61, −39,3 | 3.57 | 0.968 | 40 | 21, 22, 42 | SLF/arcuate |
| −66, −27, −1 | 0.968 | |||||
ILF= inferior longitudinal fasciculus, IFOF= inferior fronto-occipital fasciculus, pFWE= p values corrected for multiple comparison; SLF superior longitudinal fasciculus, WM= white matter.
WM areas more atrophied in EO-AD, PCA, and lv-PPA, in comparison to the other early onset syndromes and age-matched controls (masking analyses relevant contrast from Set 3 with the appropriate contrast from Set 5)
EO-AD patients showed greater WM atrophy in the left cingulum and bilateral frontal regions (p <0.001, uncorrected). PCA showed greater WM atrophy in bilateral occipital and temporal ventral regions, right cingulum, right inferior parietal and left parahippocampal areas (p <0.001, uncorrected). Lv-PPA patients group showed greater WM atrophy in posterior temporo-parietal regions (p<0.001, uncorrected). WM atrophy areas for each early AD syndrome are shown in Table 2 along with details on p values, cluster size, proximal Broadmann areas, and probable long-range WM bundles involved.
Areas of WM atrophy difference between EO-AD and LO-AD
Conjunction analysis showed the differences between LO-and EO-AD. EO-AD patients showed greater WM atrophy in the posterior part of the cingulum (left x, y, z: −8, −45, 30) and precuneus region (right x, y, z: 11, −55, 33; left x, y, z: −16, −57, 32) compared to LO-AD (p< 0.001 uncorrected) (figure 4).
Figure 4.
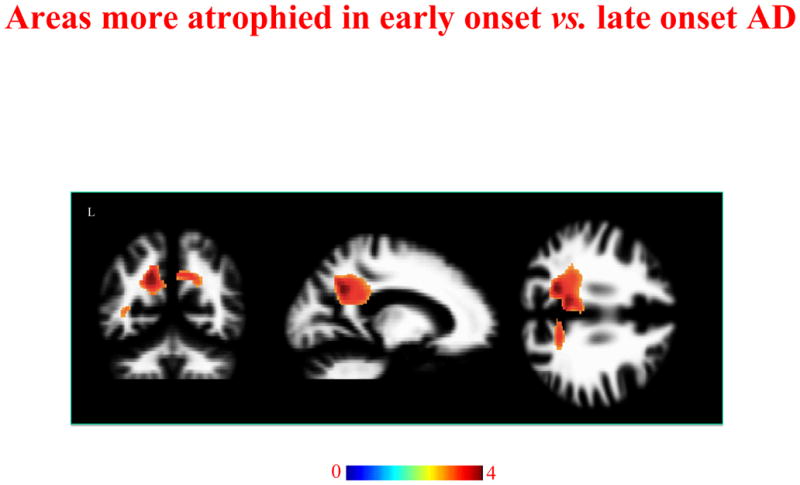
Regions of WM atrophy difference between EO-AD and LO-AD. Results are displayed on the coronal, sagittal and axial sections on WM DARTEL template, at the threshold p<0.001uncorrected. Color bar indicates T values.
Older controls vs. younger controls
No difference was found between older and younger subjects.
Results of the pattern of GM atrophy in EO-AD, PCA and lv-PPA have been previously published (1). E-figure 2 shows the GM atrophy profile of LO-AD.
4. Discussion
In this study, we found evidence that EO-AD, PCA and lv-PPA clinical syndromes are associated with WM tissue loss in posterior, hemispheric brain regions. This WM atrophy pattern is mainly localized to medial and dorsal parietal areas and consistent with their mostly hemispheric pattern of GM atrophy (1). Conversely, LO-AD mainly showed WM atrophy in medial temporal regions. We discuss these results in relation to the clinical profile of each syndrome, GM involvement, and taking into account the current literature about the brain areas involved in each clinical syndrome.
PCA patients demonstrated WM atrophy in bilateral dorsal parieto-temporal and ventral occipito-parietal regions with right side predominance, and involvement of medial structures, such as the posterior cingulum and the posterior corpus callosum (Figure 2, B). The distribution of WM atrophy follows the trajectories of dorsal and ventral streams, two “functional” networks implicated in the management of space-based and object-based visual processing, respectively. These cognitive functions are notably damaged in PCA patients (20). Symptoms ascribed to both the streams were variously present in our patients, such as visual agnosia and prosospagnosia for the ventral stream, and neglect and simultanagnosia for the dorsal stream (1). Moreover, the low percentage of language dysfunction in our PCA sample (36%) is in agreement with the less severe involvement of the left compared to the right hemisphere. The atrophy of the splenium of corpus callosum maybe secondary to neuronal degeneration of the posterior brain cortices (16) and could contribute to limb apraxia (26) and visual neglect (27), present in our sample. Consistent with the idea of WM damage contribution to the cognitive profile of PCA patients, a high right-lateralized network-level dysfunction, including WM bundles damage along the major visual pathways, was recently identified in a 59-years-old PCA patient with selective visuo-spatial deficits, by using diffusion tensor (DT)-based tractography (17). In the same way, a specific dorsal (e.g., superior longitudinal fasciculus) or ventral (e.g., inferior longitudinal fasciculus and inferior fronto-occipital fasciculus) WM pathway damage has been shown in a sample of seven PCA patients, and this anatomical damage closely mirrored the patient clinical presentations (28).
Lv-PPA was associated with atrophy in the left parietal region (Figure 2, C), consistent with both their selective language impairment and focal and left-lateralized GM atrophy. For this reason, it has been suggested that the lv-PPA syndrome might be considered as a left-lateralized presentation of AD (1,29). Moreover, the parietal area of WM atrophy could represent a “passage point” for the WM bundles running from the parietal lobe to the frontal and posterior temporal areas, and could represent, along with the GM damage, the anatomic bases for the lexical retrieval deficits and phonological errors typical of this syndrome (10). A recent study of DT-based tractography has shown that the posterior segment of superior longitudinal fasciculus running between posterior temporal and parietal cortices is the major long-range WM bundle damaged in these patients (13).
EO-AD showed a pattern of WM atrophy mainly involving the parieto-temporal regions (12), with symmetric distribution and greater medial temporal involvement (Figure 2, A). Previous imaging and pathological studies have indicated that the precuneus/posterior cingulum area of the cerebral cortex may be specifically vulnerable to early changes in AD (30). Recently, using DT MRI, the in vivo trajectories of WM degeneration in AD have been identified. These pathways include the posterior cingulum bundle, lateral posterior temporo-parietal areas, interhemispheric connections passing through the corpus callosum, with a relative preservation of WM in prefrontal, temporal pole and caudal occipital areas (31). This pattern suggests that these areas may degenerate as part of a functionally and anatomically integrated neural system. Moreover, distinct regional vulnerability patterns corresponding to specific neurodegenerative syndromes have been described, by using network-sensitive neuroimaging methods (32). In the case of AD, the network involved medial temporal, posterior cingulate/precuneus, and lateral temporoparietal regions, corresponding to the anatomical WM damage illustrated in the present study in our EO-AD group.
Following the set of analyses of our previous paper (1), we evaluated also the areas of exclusive atrophy specific to each of the three early syndromes. Consistent with the pattern of GM atrophy, as well as with their clinical hallmarks, unique areas of WM atrophy were identified in the right ventral occipito-temporal and the supramarginal and cingulum areas in PCA (17), in the left posterior temporal areas in lv-PPA (13), and in the cingulum/precuneus and bilateral prefrontal regions in EO-AD (1).
The LO-AD patients were the only group showing severe WM atrophy in the parahippocampal regions (Figure 2, D), as expected given their early and dominant episodic memory impairment. Moreover, when we analyzed WM volume differences between EO- and LO-AD, the former showed a greater medial parietal WM atrophy involving mainly the cingulum. As already suggested by other authors (7,12,33,34), the involvement of WM could elucidate the discrepancies between structural (medial temporal lobe atrophy) and functional changes (e.g., hypometabolism in posterior brain regions) in AD. In particular, the hippocampus is connected to the posterior brain regions via the cingulum bundle (35), and the destruction of this WM bundle could produce a functional impairment in parietal regions. In our VBM study, we did not find the involvement of cingulum in LO-AD at a threshold corrected for multiple comparisons, but it was found with a lower level of significance. This finding, along with severe WM damage to parahippocampal regions, part of Papez’s circuit, could result in a partial disconnection of information flow from the hippocampus to distant areas (such as parietal lobes) and vice versa.
Finally, when we looked at the similarities across all early syndromes, a pattern of WM atrophy mainly involving the medial parietal areas (posterior cingulum/precuneus, and posterior corpus callosum) was found, highlighting that the posterior brain involvement represent the common target of degeneration in the early syndromes.
These data emphasize the idea that certain large-scale neuronal networks, sustaining specific cognitive abilities, are especially vulnerable to the AD pathology. In the so-called retrogenesis model (36,37), the WM degeneration tends to be more severe in neocortical association fibers. Supporting evidence of WM damage, in particular in LOAD, comes from in vivo imaging studies (38) as well as from several pathological series reporting rarefaction, loss of axons and oligodendrocytes and reactive astrocytosis (39–41). One of the aspects less known and more debated of the WM damage in AD is the myelin involvement. Sjöbeck and coll. (42) have objectively demonstrated myelin loss on sections for microscopy in 16 post-mortem brains of patients with typical AD and with no cerebrovascular disease. The distribution of myelin loss was higher in fronto-parietal regions compared with occipital lobes, and the mechanisms evocated by the authors were consistent with the presence of recurrent episodes of microischemia, with gradual loss of oligodendrocytes and myelin. Within this framework, the authors suggested that the WM damage in AD may substantially contribute to the cognitive profile and could be used as a marker in clinical diagnostic brain imaging (42). More recently, WM pathology has been proposed to play an important role in the onset and progression of AD (43). Consisting with the involvement of both GM and WM in the AD degenerative process, Munoz and collaborators (44) described the co-existence of AD pathology and argyrophilic thorny astrocyte clusters (ATAC), intensely tau immunoreactive, in the fronto-temporo-parietal cortex and subcortical WM in the brain of seven PPA patients, with a logopenic-like language profile. They suggest that these ATAC might represent a marker of a process responsible for the prominent focal clinical manifestations in lv-PPA. The distribution of WM involvement in PCA, lv-PPA and EO-AD might sustain the biological hypothesis of AD as a disconnection syndrome in which the cognitive deficits not result from cortical damage alone, but by a network-level dysfunction including also WM damage. These interpretations might offer a framework for promising therapeutic interventions, such as the facilitation of neuronal communication and WM plasticity. The main limitation of our approach was to explore WM damage analyzing T1 structural images (45). The voxel-wise approach did not allow us to establish which specific WM bundles were involved in neurodegeneration. Another limitation of this study is that a low statistical threshold of significance was accepted. However, we accepted this level of statistical significance only when the comparison was intended to show differences across patient brain groups (for the masks that entailed within group comparisons), in agreement with the previous analyses performed on the GM (1). In summary, our study highlights that WM atrophy is present and particularly severe in AD that presents with atypical clinical syndromes before the age of 65. Investigations into the WM alterations of AD can help to clarify the pathophysiological mechanisms underlying neuropsychological and anatomical asymmetry, and further how selective networks are vulnerable to the disease.
Supplementary Material
E-Table 1. Cognitive assessment in PCA, lv-PPA, and EO-AD patients, at the time of the scan.
E-Table 2. Cognitive assessment in LO-AD patients, at the time of the scan.
E-Table 3. The table reports white matter (WM) areas atrophied in all patient-groups vs. controls (interaction analysis).
E-Figure 1. Region-of-interest analysis for cingulum WM areas in LO-AD vs. controls. Results are displayed on the coronal, sagittal and axial sections on WM DARTEL template, at the threshold p<0.001 uncorrected.
E-figure 2. Pattern of grey matter atrophy in LO-AD patients vs. controls. Results are displayed at the threshold p<0.05 for multiple comparisons (Family Wise Error [FWE]).
Acknowledgments
Sources of support that require acknowledgment: R. Migliaccio is supported by the Neuropôle de recherche Francilien (NeRF). Authors acknowledge also National Institutes of Health (NINDS R01 NS050915, NIA P50 AG03006, NINDS K23 AG037566-01A1, NIA P01 AG019724); State of California (DHS 04-35516); Alzheimer’s Disease Research Centre of California (03-75271 DHS/ADP/ARCC); Larry L. Hillblom Foundation; John Douglas French Alzheimer’s Foundation; Koret Family Foundation; and McBean Family Foundation.
Abbreviations
- PCA
posterior cortical atrophy
- lv-PPA
logopenic variant of primary progressive aphasia
- EO-AD
early-age-of-onset Alzheimer’s disease
- LO-AD
late-age-of-onset Alzheimer’s disease
- VBM
voxel-based morphometry
References
- 1.Migliaccio R, Agosta F, Rascovsky K, Karydas A, Bonasera S, Rabinovici GD, et al. Clinical syndromes associated with posterior atrophy: early age at onset AD spectrum. Neurology. 2009;73:1571–1578. doi: 10.1212/WNL.0b013e3181c0d427. [DOI] [PMC free article] [PubMed] [Google Scholar]
- 2.Benson DF, Davis RJ, Snyder BD. Posterior cortical atrophy. Arch Neurol. 1988;45:789–793. doi: 10.1001/archneur.1988.00520310107024. [DOI] [PubMed] [Google Scholar]
- 3.Gorno-Tempini ML, Brambati SM, Ginex V, Ogar J, Dronkers NF, Marcone A, et al. The logopenic/phonological variant of primary progressive aphasia. Neurology. 2008;71:1227–1234. doi: 10.1212/01.wnl.0000320506.79811.da. [DOI] [PMC free article] [PubMed] [Google Scholar]
- 4.Mendez MF, Ghajarania M, Perryman KM. Posterior cortical atrophy: clinical characteristics and differences compared to Alzheimer’s disease. Dement Geriatr Cogn Disord. 2002;14:33–40. doi: 10.1159/000058331. [DOI] [PubMed] [Google Scholar]
- 5.Tang-Wai DF, Graff-Radford NR, Boeve BF, Dickson DW, Parisi JE, Crook R, et al. Clinical, genetic, and neuropathologic characteristics of posterior cortical atrophy. Neurology. 2004;63:1168–1174. doi: 10.1212/01.wnl.0000140289.18472.15. [DOI] [PubMed] [Google Scholar]
- 6.Galton CJ, Patterson K, Xuereb JH, Hodges JR. Atypical and typical presentations of Alzheimer’s disease: a clinical, neuropsychological, neuroimaging and pathological study of 13 cases. Brain. 2000;123(Pt 3):484–498. doi: 10.1093/brain/123.3.484. [DOI] [PubMed] [Google Scholar]
- 7.Nestor PJ, Caine D, Fryer TD, Clarke J, Hodges JR. The topography of metabolic deficits in posterior cortical atrophy (the visual variant of Alzheimer’s disease) with FDG-PET. J Neurol Neurosurg Psychiatry. 2003;74:1521–1529. doi: 10.1136/jnnp.74.11.1521. [DOI] [PMC free article] [PubMed] [Google Scholar]
- 8.Schmidtke K, Hull M, Talazko J. Posterior cortical atrophy: variant of Alzheimer’s disease? A case series with PET findings. J Neurol. 2005;252:27–35. doi: 10.1007/s00415-005-0594-5. [DOI] [PubMed] [Google Scholar]
- 9.Whitwell JL, Jack CR, Jr, Kantarci K, Weigand SD, Boeve BF, Knopman DS, et al. Imaging correlates of posterior cortical atrophy. Neurobiol Aging. 2007;28:1051–1061. doi: 10.1016/j.neurobiolaging.2006.05.026. [DOI] [PMC free article] [PubMed] [Google Scholar]
- 10.Gorno-Tempini ML, Hillis AE, Weintraub S, Kertesz A, Mendez M, Cappa SF, et al. Classification of primary progressive aphasia and its variants. Neurology. 2011;76:1006–1014. doi: 10.1212/WNL.0b013e31821103e6. [DOI] [PMC free article] [PubMed] [Google Scholar]
- 11.Teipel SJ, Bayer W, Alexander GE, Zebuhr Y, Teichberg D, Kulic L, et al. Progression of corpus callosum atrophy in Alzheimer disease. Arch Neurol. 2002;59:243–248. doi: 10.1001/archneur.59.2.243. [DOI] [PubMed] [Google Scholar]
- 12.Canu E, Frisoni GB, Agosta F, Pievani M, Bonetti M, Filippi M. Early and late onset Alzheimer’s disease patients have distinct patterns of white matter damage. Neurobiol Aging. 2010 doi: 10.1016/j.neurobiolaging.2010.09.021. [DOI] [PubMed] [Google Scholar]
- 13.Galantucci S, Tartaglia MC, Wilson SM, Henry ML, Filippi M, Agosta F, et al. White matter damage in primary progressive aphasias: a diffusion tensor tractography study. Brain. 2011 doi: 10.1093/brain/awr099. [DOI] [PMC free article] [PubMed] [Google Scholar]
- 14.Agosta F, Scola E, Canu E, Marcone A, Magnani G, Sarro L, et al. White Matter Damage in Frontotemporal Lobar Degeneration Spectrum. Cereb Cortex. 2011 doi: 10.1093/cercor/bhr288. [DOI] [PubMed] [Google Scholar]
- 15.Duning T, Warnecke T, Mohammadi S, Lohmann H, Schiffbauer H, Kugel H, et al. Pattern and progression of white-matter changes in a case of posterior cortical atrophy using diffusion tensor imaging. J Neurol Neurosurg Psychiatry. 2009;80:432–436. doi: 10.1136/jnnp.2008.153148. [DOI] [PubMed] [Google Scholar]
- 16.Yoshida T, Shiga K, Yoshikawa K, Yamada K, Nakagawa M. White matter loss in the splenium of the corpus callosum in a case of posterior cortical atrophy: a diffusion tensor imaging study. Eur Neurol. 2004;52:77–81. doi: 10.1159/000079750. [DOI] [PubMed] [Google Scholar]
- 17.Migliaccio R, Agosta F, Toba MN, Samri D, Corlier F, De Souza LC, et al. Brain networks in posterior cortical atrophy: a single case tractography study and literature review. Cortex. 2011 Oct 20; doi: 10.1016/j.cortex.2011.10.002. [Epub ahead of print] [DOI] [PMC free article] [PubMed] [Google Scholar]
- 18.McKhann G, Drachman D, Folstein M, Katzman R, Price D, Stadlan EM. Clinical diagnosis of Alzheimer’s disease: report of the NINCDS-ADRDA Work Group under the auspices of Department of Health and Human Services Task Force on Alzheimer’s Disease. Neurology. 1984;34:939–944. doi: 10.1212/wnl.34.7.939. [DOI] [PubMed] [Google Scholar]
- 19.Frisoni GB, Testa C, Sabattoli F, Beltramello A, Soininen H, Laakso MP. Structural correlates of early and late onset Alzheimer’s disease: voxel based morphometric study. J Neurol Neurosurg Psychiatry. 2005;76:112–114. doi: 10.1136/jnnp.2003.029876. [DOI] [PMC free article] [PubMed] [Google Scholar]
- 20.McMonagle P, Deering F, Berliner Y, Kertesz A. The cognitive profile of posterior cortical atrophy. Neurology. 2006;66:331–338. doi: 10.1212/01.wnl.0000196477.78548.db. [DOI] [PubMed] [Google Scholar]
- 21.Alladi S, Xuereb J, Bak T, Nestor P, Knibb J, Patterson K, et al. Focal cortical presentations of Alzheimer’s disease. Brain. 2007;130:2636–2645. doi: 10.1093/brain/awm213. [DOI] [PubMed] [Google Scholar]
- 22.Kramer JH, Jurik J, Sha SJ, Rankin KP, Rosen HJ, Johnson JK, et al. Distinctive neuropsychological patterns in frontotemporal dementia, semantic dementia, and Alzheimer disease. Cogn Behav Neurol. 2003;16:211–218. doi: 10.1097/00146965-200312000-00002. [DOI] [PubMed] [Google Scholar]
- 23.Possin KL, Laluz VR, Alcantar OZ, Miller BL, Kramer JH. Distinct neuroanatomical substrates and cognitive mechanisms of figure copy performance in Alzheimer’s disease and behavioral variant frontotemporal dementia. Neuropsychologia. 49:43–48. doi: 10.1016/j.neuropsychologia.2010.10.026. [DOI] [PMC free article] [PubMed] [Google Scholar]
- 24.Ashburner J, Friston KJ. Unified segmentation. Neuroimage. 2005;26:839–851. doi: 10.1016/j.neuroimage.2005.02.018. [DOI] [PubMed] [Google Scholar]
- 25.Ashburner J. A fast diffeomorphic image registration algorithm. Neuroimage. 2007;38:95–113. doi: 10.1016/j.neuroimage.2007.07.007. [DOI] [PubMed] [Google Scholar]
- 26.Heilman KM, Watson RT. The disconnection apraxias. Cortex. 2008;44:975–982. doi: 10.1016/j.cortex.2007.10.010. [DOI] [PubMed] [Google Scholar]
- 27.Doricchi F, Thiebaut de Schotten M, Tomaiuolo F, Bartolomeo P. White matter (dis)connections and gray matter (dys)functions in visual neglect: gaining insights into the brain networks of spatial awareness. Cortex. 2008;44:983–995. doi: 10.1016/j.cortex.2008.03.006. [DOI] [PubMed] [Google Scholar]
- 28.Migliaccio R, Agosta F, Scola E, Magnani G, Cappa SF, Pagani E, et al. Ventral and dorsal visual streams in posterior cortical atrophy: A DT MRI study. Neurobiol Aging. 2012 Jan 23; doi: 10.1016/j.neurobiolaging.2011.12.025. [Epub ahead of print] [DOI] [PMC free article] [PubMed] [Google Scholar]
- 29.Rohrer JD, Ridgway GR, Crutch SJ, Hailstone J, Goll JC, Clarkson MJ, et al. Progressive logopenic/phonological aphasia: erosion of the language network. Neuroimage. 2010;49:984–993. doi: 10.1016/j.neuroimage.2009.08.002. [DOI] [PMC free article] [PubMed] [Google Scholar]
- 30.Buckner RL, Snyder AZ, Shannon BJ, LaRossa G, Sachs R, Fotenos AF, et al. Molecular, structural, and functional characterization of Alzheimer’s disease: evidence for a relationship between default activity, amyloid, and memory. J Neurosci. 2005;25:7709–7717. doi: 10.1523/JNEUROSCI.2177-05.2005. [DOI] [PMC free article] [PubMed] [Google Scholar]
- 31.Acosta-Cabronero J, Williams GB, Pengas G, Nestor PJ. Absolute diffusivities define the landscape of white matter degeneration in Alzheimer’s disease. Brain. 2010;133:529–539. doi: 10.1093/brain/awp257. [DOI] [PubMed] [Google Scholar]
- 32.Seeley WW, Crawford RK, Zhou J, Miller BL, Greicius MD. Neurodegenerative diseases target large-scale human brain networks. Neuron. 2009;62:42–52. doi: 10.1016/j.neuron.2009.03.024. [DOI] [PMC free article] [PubMed] [Google Scholar]
- 33.Villain N, Desgranges B, Viader F, de la Sayette V, Mezenge F, Landeau B, et al. Relationships between hippocampal atrophy, white matter disruption, and gray matter hypometabolism in Alzheimer’s disease. J Neurosci. 2008;28:6174–6181. doi: 10.1523/JNEUROSCI.1392-08.2008. [DOI] [PMC free article] [PubMed] [Google Scholar]
- 34.Villain N, Fouquet M, Baron JC, Mezenge F, Landeau B, de La Sayette V, et al. Sequential relationships between grey matter and white matter atrophy and brain metabolic abnormalities in early Alzheimer’s disease. Brain. 2010;133:3301–3314. doi: 10.1093/brain/awq203. [DOI] [PMC free article] [PubMed] [Google Scholar]
- 35.Schmahmann JD, Pandya DN. Fiber pathways of the brain. Oxford University Press; 2006. [Google Scholar]
- 36.Reisberg B, Franssen EH, Hasan SM, Monteiro I, Boksay I, Souren LE, et al. Retrogenesis: clinical, physiologic, and pathologic mechanisms in brain aging, Alzheimer’s and other dementing processes. Eur Arch Psychiatry Clin Neurosci. 1999;249 (Suppl 3):28–36. doi: 10.1007/pl00014170. [DOI] [PubMed] [Google Scholar]
- 37.Stricker NH, Schweinsburg BC, Delano-Wood L, Wierenga CE, Bangen KJ, Haaland KY, et al. Decreased white matter integrity in late-myelinating fiber pathways in Alzheimer’s disease supports retrogenesis. Neuroimage. 2009;45:10–16. doi: 10.1016/j.neuroimage.2008.11.027. [DOI] [PMC free article] [PubMed] [Google Scholar]
- 38.Zhang Y, Schuff N, Du AT, Rosen HJ, Kramer JH, Gorno-Tempini ML, et al. White matter damage in frontotemporal dementia and Alzheimer’s disease measured by diffusion MRI. Brain. 2009;132:2579–2592. doi: 10.1093/brain/awp071. [DOI] [PMC free article] [PubMed] [Google Scholar]
- 39.Englund E. Neuropathology of white matter changes in Alzheimer’s disease and vascular dementia. Dement Geriatr Cogn Disord. 1998;9 (Suppl 1):6–12. doi: 10.1159/000051183. [DOI] [PubMed] [Google Scholar]
- 40.Sjobeck M, Englund E. Glial levels determine severity of white matter disease in Alzheimer’s disease: a neuropathological study of glial changes. Neuropathol Appl Neurobiol. 2003;29:159–169. doi: 10.1046/j.1365-2990.2003.00456.x. [DOI] [PubMed] [Google Scholar]
- 41.Sjobeck M, Haglund M, Persson A, Sturesson K, Englund E. Brain tissue microarrays in dementia research: white matter microvascular pathology in Alzheimer’s disease. Neuropathology. 2003;23:290–295. doi: 10.1046/j.1440-1789.2003.00515.x. [DOI] [PubMed] [Google Scholar]
- 42.Sjöbeck M, Haglund M, Englund E. Decreasing myelin density reflected increasing white matter pathology in Alzheimer’s disease: a neuropathological study. Int J GeriatrPsychiatry. 2005 Oct;20:919–26. doi: 10.1002/gps.1384. [DOI] [PubMed] [Google Scholar]
- 43.Bartzokis G. Age-related myelin breakdown: a developmental model of cognitive decline and Alzheimer’s disease. Neurobiol Aging. 2004;25:5–18. doi: 10.1016/j.neurobiolaging.2003.03.001. author reply 49–62. [DOI] [PubMed] [Google Scholar]
- 44.Munoz DG, Woulfe J, Kertesz A. Argyrophilic thorny astrocyte clusters in association with Alzheimer’s disease pathology in possible primary progressive aphasia. Acta Neuropathol. 2007;114:347–357. doi: 10.1007/s00401-007-0266-x. [DOI] [PubMed] [Google Scholar]
- 45.Yoon B, Shim YS, Hong YJ, Koo BB, Kim YD, Lee KO, et al. Comparison of diffusion tensor imaging and voxel-based morphometry to detect white matter damage in Alzheimer’s disease. J Neurol Sci. 2011;302:89–95. doi: 10.1016/j.jns.2010.11.012. [DOI] [PubMed] [Google Scholar]
Associated Data
This section collects any data citations, data availability statements, or supplementary materials included in this article.
Supplementary Materials
E-Table 1. Cognitive assessment in PCA, lv-PPA, and EO-AD patients, at the time of the scan.
E-Table 2. Cognitive assessment in LO-AD patients, at the time of the scan.
E-Table 3. The table reports white matter (WM) areas atrophied in all patient-groups vs. controls (interaction analysis).
E-Figure 1. Region-of-interest analysis for cingulum WM areas in LO-AD vs. controls. Results are displayed on the coronal, sagittal and axial sections on WM DARTEL template, at the threshold p<0.001 uncorrected.
E-figure 2. Pattern of grey matter atrophy in LO-AD patients vs. controls. Results are displayed at the threshold p<0.05 for multiple comparisons (Family Wise Error [FWE]).