

Abstract
The inhibitory receptor programmed death-1 (PD-1) constrains type 1 diabetes (T1D) in the nonobese diabetic (NOD) mouse. However, how PD-1 influences diabetogenic CD4+ T cells during natural diabetes is not fully understood. To address this question, we developed a novel model to investigate antigen-specific CD4+ T cells under physiological conditions in vivo. We transferred a low number of naïve CD4+ T cells from the BDC2.5 mouse into prediabetic NOD mice to mimic a physiological precursor frequency and allowed the cells to become primed by endogenous autoantigen. Transferred BDC2.5 T cells became activated, differentiated into T-bet+ IFN-γ–producing cells, and infiltrated the pancreas. In this model, loss of PD-1, but not programmed death ligand-1 (PD-L1), on the antigen-specific CD4+ T cell resulted in increased cell numbers in the spleen, pancreas-draining lymph node, and pancreas. PD-1 deficiency also increased expression of the chemokine receptor CXCR3. Lastly, histological data showed that a loss of PD-1 caused BDC2.5 cells to penetrate deep into the islet core, resulting in conversion from peri-insulitis to destructive insulitis. These data support a model by which PD-1 regulates islet-reactive CD4+ T cells in a cell intrinsic manner by suppressing proliferation, inhibiting infiltration of the pancreas, and limiting diabetes.
Type 1 diabetes (T1D) is an autoimmune disease mediated by T-cell destruction of the insulin-producing β-cells in the pancreatic islets of Langerhans (1). The nonobese diabetic (NOD) mouse is a classic model for studying T1D because it shares many similarities with human T1D, including the requirement of CD4+ T cells for disease (2–4). However, knowledge of how diabetogenic CD4+ T cells are regulated and how this regulation fails, causing T1D, is limited owing to a lack of tools to monitor endogenous diabetogetic CD4+ T cells.
Common models used to study diabetogenic CD4+ T cells in NOD mice include adoptive transfer of high numbers of naïve or in vitro activated T-cell receptor (TCR) transgenic cells into wild-type (WT) or lymphopenic NOD recipients (5–10). While informative, these approaches fail to recapitulate the natural inflammatory environment present in NOD mice and the timing associated with T1D progression. Previous work in other systems showed that transferring lower numbers of naïve T cells allowed greater clonal expansion on a per cell basis and more efficient effector cell differentiation (11–14). Since we speculate that endogenous autoantigen in the NOD mouse is low, we predicted that limiting the diabetogenic precursor frequency would be essential for autoantigen encounter and activation. Therefore, in this study we developed a new model by transferring a small number of islet-specific BDC2.5 transgenic CD4+ T cells (15,16) into prediabetic NOD mice to mimic an endogenous preimmune repertoire.
The inhibitory receptor programmed death-1 (PD-1) interacting with programmed death ligand-1 (PD-L1) is critical for suppressing diabetes, since disrupting PD-1/PD-L1 interactions accelerates T1D in NOD mice (7,17–19) and polymorphisms in PD-1 have been associated with human T1D (20). Previous studies demonstrated roles for the PD-1 pathway by inhibiting CD4+ T-cell survival, proliferation, and cytokine production using in vitro and in vivo systems (5,7,21–24). However, since many of the in vivo studies relied on adoptive transfer of nonphysiologically high numbers of TCR transgenic T cells, the cellular mechanisms by which PD-1 constrains diabetogenic CD4+ T cells in hosts with a normal T-cell repertoire remain unclear. We therefore reexamined the role of PD-1 in regulating CD4+ T cells in vivo using a new adoptive transfer model that more closely mimics the normal naïve preimmune repertoire. Our results show that PD-1 expressed by the BDC2.5 T cell is required to regulate proliferation, chemokine receptor CXCR3 expression, infiltration of the pancreas, and diabetes pathogenesis.
RESEARCH DESIGN AND METHODS
NOD mice were purchased from Taconic (Germantown, NY). NOD.BDC2.5 TCR mice were purchased from The Jackson Laboratory (Bar Harbor, ME) and crossed to NOD.Thy1.1+ mice. C57BL/6.PD-1–deficient mice (25) were backcrossed 13 generations, and PD-L1–deficient mice (7) were backcrossed 15 generations to the NOD background. PD-1 and PD-L1 knockout (KO) NOD.BDC2.5.Thy1.1 mice were generated by crossing NOD.BDC2.5.Thy1.1 with NOD.PD-1+/− (backcross 13) and NOD.PD-L1+/− (backcross 15) mice, and F1 mice were intercrossed to produce NOD.BDC2.5.Thy1.1.PD-1−/− and NOD.BDC2.5.Thy1.1.PD-L1−/− mice, respectively. Prediabetic NOD mice were used as recipients for BDC2.5 T cells between 7 and 12 weeks of age. Animal experiments were approved by the Institutional Animal Care and Use Committee of the University of Minnesota.
Adoptive transfer of BDC2.5 T cells and anti–PD-L1 administration.
Naïve NOD.BDC2.5.Thy1.1+ T cells were enriched from spleen and inguinal, axillary, brachial, cervical, and periaortic lymph nodes (LNs) between 4.5 and 6.5 weeks of age using negative selection with magnetic columns (Miltenyi Biotec, Auburn, CA). Anti-biotin microbeads (Miltenyi) were used to deplete cells based on biotinylated anti–granulocyte differentiation antigen 1, major histocompatibility class (MHC)-II, CD8α, CD117, CD24, CD25, TER119, CD19, B220, and CD44. Cells were ≥98% CD44low. We transferred 7,500 or 1 × 10⁶ naïve CD4+.BDC2.5 T cells intravenously into NOD recipients. In vitro activated BDC2.5 T cells were generated as previously described (5). Pancreata were harvested for histology at diabetes onset.
Anti–PD-L1 antibody (clone M1H6) was generated as previously described (26). Rat IgG was purchased from Jackson ImmunoResearch (West Grove, PA). Antibody (200–250 μg/mouse/injection) was injected intraperitoneally every other day prior to harvest for two to three injections or diabetes onset as indicated in the figure legends. Blood glucose levels were measured, and >250 mg/dL was considered diabetic (LifeScan, Milpitas, CA).
Flow cytometry.
BDC2.5 T cells were enriched from single cell suspensions from spleen and/or pooled non–antigen draining LN samples (27). Anti-Thy1.1-APC (eBioscience, San Diego, CA) and anti-APC microbeads were used to enrich BDC2.5.Thy1.1 cells by positive selection magnetic columns (Miltenyi). Single cell suspensions from pancreas were generated using collagenase P digestion (Roche, Indianapolis, IN) and discontinuous percoll separation as previously described (28). Antibodies included anti-Thy1.1, -CXCR3, –PD-1, –interleukin (IL)-2, –γ-interferon (IFN-γ), –tumor necrosis factor (TNF)-α (eBioscience), and -Ki67 (BD Biosciences, San Jose, CA). Cell numbers were determined using AccuCheck Counting Beads (Life Technologies, Grand Island, NY).
Flow cytometry was performed using BD LSRII and Fortessa instruments (BD). Data were analyzed using FlowJo (Tree Star, Ashland, OR). The gating strategy to define BDC2.5 T cells was singlet+, CD3+ lineage− (B220−, CD11b−, and CD11c−), CD4+, and Thy1.1+ cells.
Immunofluorescence microscopy.
Pancreata were frozen in optimal cutting temperature (Tissue-Tek; VWR, Arlington Heights, IL), cut at 7 μm, and fixed using acetone. Antibodies included guinea pig anti-swine insulin (Dako, Denmark), donkey anti–guinea pig AF488 (Jackson ImmunoResearch), Thy1.1-PE (clone OX7; BioLegend, San Diego, CA), and CD3e-APC (eBioscience). Slides were mounted using Prolong Gold with DAPI (Life Technologies) and imaged on a Leica epifluorescent DM5500 microscope (Wetzlar, Germany). Data were compiled using MetaMorph software (Molecular Devices, Sunnyvale, CA).
Stimulation of cells for cytokine production.
Single cell suspensions were stimulated in complete Dulbecco’s modified Eagle’s medium (5) with 10 μg/mL brefeldin A, 100 ng/mL phorbol 12-myristate 13-acetate (PMA), and 1,000 ng/mL ionomycin (Sigma-Aldrich, St. Louis, MO). Cells were incubated for 4 h at 37°C and 5% CO2. BD cytofix/cytoperm fixation/permeabilization kit was used for intracellular cytokine staining.
Proliferation assays.
Purified BDC2.5 T cells were labeled with carboxyfluorescein-succinimidyl ester (CFSE) using the manufacturer’s protocol (Life Technologies). Intracellular staining for Ki67 (BD) was performed using a Foxp3 fixation/permeabilization kit according to the manufacturer’s protocol (eBioscience).
Statistical analysis.
Statistical analysis was performed using GraphPad Prism 5 software (La Jolla, CA). P values were calculated using unpaired two-tailed Student t tests or Mann-Whitney U tests using a 95% CI.
RESULTS
Establishment of a novel model to study an autoreactive T-cell population after activation by endogenous autoantigen.
To investigate the role of PD-1 in regulating islet-reactive CD4+ T cells during T1D progression, we established a model to track these cells in vivo. We used the BDC2.5 transgenic mouse, which contains CD4+ T cells specific for an islet peptide–MHCII (pMHCII) complex (15,16). We did not provide exogenous antigen or adjuvant but, rather, relied on presentation of endogenous levels of autoantigen to activate the cells. We speculated that since levels of endogenous islet-pMHCII complexes are low, precursor frequency would dictate the ability of T cells to become activated (11). To test this hypothesis, we transferred naïve BDC2.5 cells into NOD mice and compared the frequency of cells that increased CD44 expression after a low (7,500 cells) or high (1 × 10⁶ cells) transfer (Fig. 1A and B). At day 6 posttransfer, a significantly higher frequency of BDC2.5 cells had converted to CD44high in the low transfer compared with the high transfer in the pancreas-draining LN (pLN) and spleen and non–antigen draining LNs (nondLNs) (Fig. 1A and B). Importantly, at a later time point (day 27), many of the BDC2.5 cells remained naïve in the high-transfer situation, while nearly the entire population in the low-transfer setting had encountered autoantigen (Fig. 1B). For this reason, the remainder of this study used the low-transfer model.
FIG. 1.

Establishment of a novel model to assess natural breakdown of peripheral tolerance using a physiologically relevant and traceable autoreactive T-cell population. A: Representative flow cytometry contour plots are shown from the spleen and nondraining LNs comparing CD44 expression on the endogenous CD4+ T-cell population (Thy1.1−) with transferred BDC2.5 T cells (Thy1.1+) at day 6 after transfer of 7,500 (low transfer) or 1 × 10⁶ (high transfer) BDC2.5 T cells. B: Quantification of the frequency of BDC2.5 T cells that were CD44high at days 6 and 27 after transfer of 7,500 or 1 × 10⁶ BDC2.5 T cells in the spleen and nondraining LNs and pLN. Data from A and B are representative of two independent experiments with three to five mice per group. C: Quantification of the frequency of CD44high BDC2.5 T cells at various time points (x-axis) between the pLN and the spleen and nondraining LNs after transfer of 7,500 cells. D: The absolute number of BDC2.5 Thy1.1+ T cells in the spleen and nondraining LNs and pLN at various time points over 70 days after low transfer into prediabetic NOD.Thy1.2 mice. All mice shown were nondiabetic at the time of harvest. Nondraining LNs included inguinal, axillary, brachial, cervical, and periaortic. E: The absolute number of BDC2.5 T cells in the pancreas of mice shown in D after low transfer into NOD mice. Data for C–E are representative of two independent experiments with three to four mice per time point. F: Histological analysis of the pancreas from nondiabetic mice 90 days posttransfer of BDC2.5 T cells. Images are representative of four mice 90–114 days posttransfer. G: Histological analysis of the pancreas from NOD mice 5–7 days posttransfer of 2.5 × 10⁶ in vitro activated BDC2.5 T cells at T1D onset. Images are representative of five mice. Insulin is gray, Thy1.1+ BDC2.5 T cells are red, CD3+ T cells are green, and DAPI marking nuclei is blue. In F and G, single color images showing BDC2.5 T cells in red are to the right of the overlaid image containing all four colors. White lines in the red single color image outline the islet body containing the insulin-producing cells. Select BDC2.5 T cells in the low-transfer model are marked with a yellow arrow to aid in visualization of the cells. Scale bar = 200 μm. PancLN, pancreatic LN. *Significant, P = 0.01–0.05. ***Extremely significant, P < 0.001.
To further characterize the low-transfer BDC2.5 model, we transferred 7,500 naïve BDC2.5 cells into NOD mice. Approximately 10–15% of the BDC2.5 cells survived the transfer (data not shown), providing a naïve preimmune repertoire of ~750 cells. Although this is higher than what has recently been reported for endogenous preimmune CD4+ T cells using pMHCII tetramers (20–400 cells) (29–31), it is orders of magnitude closer to reality than other transfer models (5,6). After low transfer, the majority of BDC2.5 cells (73 ± 6%) in the pLN increased CD44 expression indicating that they encountered autoantigen by day 3 posttransfer, while a minority of cells in the spleen and nondLNs expressed CD44 (34.8 ± 6.2) (Fig. 1C). At time points 28 days and later, there was no significant difference in CD44 levels between these organs (Fig. 1C). We conclude from these data that the entire population converted to the CD44high phenotype by day 28, though the majority was CD44high by day 7 (Fig. 1C).
We next enumerated BDC2.5 cells to determine the shape of the clonal expansion curve. Endogenous priming led to a 2.5-fold increase in BDC2.5 cells at day 7 (Fig. 1D), which was low compared with a classic acute infection response (30). Interestingly, we did not measure a contraction of antigen-specific T cells at later stages (post–day 21). Importantly, BDC2.5 cells accumulated in the pancreas and localized to the infiltrate surrounding the islet (peri-insulitis) (Fig. 1E and F). BDC2.5 were rarely found deep within the islet core (insulitis) (Fig. 1F). The frequency and localization of BDC2.5 cells in the pancreas differ substantially from in vitro activated and transferred BDC2.5 cells, which destroy the pancreas within 1 week (5,8) by mediating more destructive insulitis (Fig. 1G) than the low-transfer model (Fig. 1F).
Lastly, we determined the effector potential of transferred BDC2.5 cells. We measured the transcription factor T-bet, which controls the differentiation of Th1 cells (32). After activation, the majority of BDC2.5 cells differentiated into T-bet+ effector cells with significant production of IFN-γ in the pLN and pancreas (Supplementary Fig. 1A–C). These cells did not express Foxp3 (data not shown). This low-transfer system provided a novel tool to examine the role of PD-1 in the regulation of an autoreactive CD4+ T-cell population in vivo.
PD-1 blockade accelerated T1D and increased BDC2.5 T-cell numbers in the low-transfer model.
We next used the low-transfer model to evaluate the requirement for PD-1/PD-L1 interactions during T1D. We determined that BDC2.5 cells in the pLN were PD-1+ at day 3, consistent with recent T-cell activation (Fig. 2A). PD-1 expression on the BDC2.5 T cells in the spleen and nondLNs was lower at day 3 than in the pLN, as was expected, since a higher frequency of BDC2.5 cells was naïve in this location (33). At day 7, there was a decrease in PD-1 expression in the pLN compared with day 3, though the significance of this decline is unclear. By day 21 posttransfer, PD-1 levels were elevated in the pLN, spleen, and nondLNs, and these levels remained elevated. By day 7, PD-1 levels were highest in the pancreas and remained highest in this organ (Fig. 2A and B), which could reflect chronic antigen engagement.
FIG. 2.

Anti–PD-L1 administration results in increased BDC2.5 T cells in the spleen, pLN, and pancreas. A: PD-1 expression on BDC2.5 T cells is shown from the spleen and nondraining LNs, pLN, and pancreas at days 3, 7, 21, and 56 posttransfer. PD-1 expression levels are compared with endogenous CD44low CD4+ T cells. B: Average geometric mean fluorescence intensity (MFI) of PD-1 from four mice analyzed at day 21 posttransfer of BDC2.5 T cells. Data are representative of six independent experiments. C: Absolute number of BDC2.5 Thy1.1+ T cells 3 weeks posttransfer from mice treated with 200 μg anti–PD-L1 or isotype control antibody at days −5, −3, and −1 prior to harvest. Data from spleen, pLN, and pancreas are representative of seven independent experiments, four of which contained inguinal LNs, with at least three mice per treatment condition per experiment. Data shown are combined from three independent experiments. D: Histological analysis of the pancreas 3 weeks posttransfer with or without anti–PD-L1 administration. Islets are representative of four to six mice per group. Gray is insulin, red is Thy1.1+ BDC2.5 T cells, green is CD3+ T cells, and DAPI marking nuclei is blue. Single color images showing BDC2.5 T cells in red are to the right of the overlaid image containing all four colors. White lines in the red single color image outline the islet body containing the insulin-producing cells. Select BDC2.5 T cells are marked with yellow arrows in the WT control to aid visualization of the cells. Scale bar = 100 μm. E: Insulitis was scored blinded from mice 3 weeks posttransfer with or without anti–PD-L1 administration. Insulitis scores correspond as follows: 1, peri-insulitis or <25 infiltrated; 2, 25–50% infiltrated; and 3, >50%. Forty-three islets from WT without anti–PD-L1 at day 22–23 and 70 islets from WT with anti–PD-L1 administration at day 22–23 were scored. *Significant, P = 0.01–0.05. **Very significant, P = 0.001–0.01. ***Extremely significant, P < 0.001.
We next determined whether blocking PD-1 influenced the BDC2.5 cells. Three weeks posttransfer, anti–PD-L1 resulted in a significant increase in BDC2.5 cells in the pLN and pancreas (Fig. 2C). There was no statistically significant increase in BDC2.5 cells in the non–antigen draining inguinal LN (iLN) after PD-1 blockade (Fig. 2C), consistent with PD-1 functioning in an antigen-dependent manner (34). An increase in the number of BDC2.5 cells was also observed in the spleen, which was likely due to increased migration of cells from the pLN, since antigen was unlikely to be present. Lastly, we sought to determine whether anti–PD-L1 administration impacted the spatial organization of BDC2.5 cells within the pancreatic infiltrate. At 3 weeks posttransfer, the majority of pancreas infiltrate was peri-insulitis (Fig. 2E). However, anti–PD-L1 administration caused a substantial conversion from peri-insulitis to destructive insulitis (Fig. 2E), consistent with previous work (18). Importantly, BDC2.5 cells were present within the islet core after PD-1 blockade (Fig. 2D). Anti–PD-L1 accelerated T1D in this model (Supplementary Fig. 1D), consistent with previous reports in WT NOD mice (18). These data highlight the significant pathogenic effect of anti–PD-L1 administration on BDC2.5 cells in the pancreas during T1D.
Blocking PD-1 can sustain proliferation early during activation and reinitiate cell cycle in quiescent cells late in the response.
Previous work identified a role for PD-1 in regulating T-cell proliferation, survival, and cytokine production using in vitro assays and high–cell transfer models in vivo (6,7,24,35). However, the role for PD-1 inhibition in an endogenous antigen system has not been tested. Additionally, since the majority of work focused on early time points (<10 days posttransfer), little is known about how PD-1 regulates CD4+ T cells at chronic time points. We therefore tested the role of PD-1 in regulation of BDC2.5 cell proliferation early during the activation phase (day 7) and late during the chronic phase (day 42). At day 7, anti–PD-L1 resulted in a significant increase in the frequency of BDC2.5 cells that fully diluted CFSE in the pLN (Fig. 3A and B), consistent with previous work (6). We did not measure a significant difference in the frequency of CFSE-diluted BDC2.5 cells in the iLN or the pancreas. We also found an increase in CFSE-diluted BDC2.5 cells in the spleen after PD-L1 blockade and speculate that the splenic increase is due to increased trafficking from the pLNs.
FIG. 3.
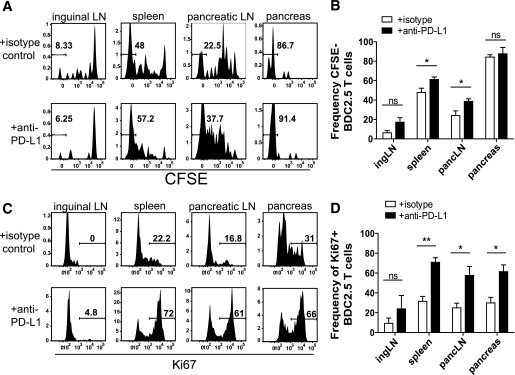
Blocking PD-1 results in sustained proliferation early during priming and causes quiescent cells to enter cycle late during the response. A: Representative flow cytometry histograms illustrating cell proliferation determined by CFSE dye dilution gated on Thy1.1+ BDC2.5 T cells from mice that received 250 μg/mouse isotype control or anti–PD-L1 antibody at days −3 and −1 relative to harvest at day 7 posttransfer. B: Frequency of BDC2.5 T cells that had fully diluted CFSE from A. Data are representative of three independent experiments with four mice in each treatment group. C: Ki67 expression from mice treated with 250 μg/mouse isotype control or anti–PD-L1 antibody at days −3 and −1 prior to harvest at day 42 posttransfer. D: Quantification of the frequency of Ki67+ BDC2.5 T cells from C. Data are representative of at least four independent experiments per organ with at least three mice per treatment condition. ingLN, inguinal LN; pancLN, pancreatic LN. ns, not significant, P > 0.05. *Significant, P = 0.01–0.05. **Very significant, P = 0.001–0.01.
We next tested the role of PD-1 regulation on proliferation during the chronic phase. We treated with anti–PD-L1 or control antibody 6 weeks posttransfer and measured Ki67, a molecule associated with cell cycle entry. As predicted, the BDC2.5 cells from control-treated animals were quiescent (Ki67−) (Fig. 3C and D). PD-1 blockade resulted in a significant increase in the frequency of BDC2.5 cells entering cell cycle (Ki67+) in the spleen, pLN, and pancreas (Fig. 3C and D). PD-1 blockade did not significantly increase Ki67+ BDC2.5 cells in the iLN, as expected, since this organ lacks pancreatic antigens (Fig. 3C and D). Collectively, these data suggest that PD-1 regulates CD4+ T-cell proliferation early during priming (Fig. 3A and B) and late during the persistent phase of the response (Fig. 3C and D). These findings extend our knowledge of how PD-1 regulates proliferation, demonstrating that loss of PD-1 can restore proliferative capabilities in CD4+ T cells at late time points in vivo.
CXCR3 expression is increased on BDC2.5 T cells after PD-1 blockade.
Our results indicated that PD-1 blockade increased BDC2.5 cell infiltration of the pancreas (Fig. 2C). Therefore, we determined whether PD-1 regulated expression of a chemokine receptor associated with trafficking to the pancreas. CXCR3 sensing CXCL10 promotes effector Th1 cell trafficking to pancreatic islets during T1D (36). Additionally, CXCR3 is required for optimal Th1 differentiation in antigen-draining LNs (37). PD-1 blockade resulted in the significant increase of CXCR3 expression on BDC2.5 cells in the spleen and pLN (Fig. 4A and B). PD-1 blockade also resulted in a highly significant increase in the absolute number of CXCR3-expressing BDC2.5 cells in the spleen and pLN (Fig. 4C and D). Interestingly, the highest CXCR3 expression was on Ki67high T cells after PD-1 blockade (Fig. 4E). This increased CXCR3 expression may aid in optimal Th1 differentiation and trafficking of islet-reactive CD4+ T cells to the pancreas during T1D pathogenesis.
FIG. 4.

PD-1 blockade results in increased expression of the chemokine receptor CXCR3. A: Representative flow cytometry histogram plots showing CXCR3 expression on Thy1.1+ BDC2.5 T cells from mice that received 200 μg of isotype control or anti–PD-L1 antibody at days −5, −3, and −1 prior to harvest. Mice were harvested 3 weeks posttransfer. Quantification of A showing geometric mean fluorescence intensity (MFI) of CXCR3 (B), the frequency of BDC2.5 T cells expressing CXCR3 (C), and the absolute number of BDC2.5 T cells expressing CXCR3 (D). Data are representative of three independent experiments with at least three mice per treatment condition per experiment. E: Representative flow cytometry contour plots showing Ki67 and CXCR3 expression with or without anti–PD-L1 administration 7 days posttransfer. Data are representative of four experiments with at least three animals per group. ingLN, inguinal LN; pancLN, pancreatic LN. ns, not significant, P > 0.05. *Significant, P = 0.01–0.05. **Very significant, P = 0.001–0.01. ***Extremely significant, P < 0.001.
Blocking PD-1 increases the number of cytokine-producing BDC2.5 cells.
We hypothesized that PD-1 blockade would enhance the capacity for BDC2.5 cells to produce effector cytokines similarly to findings with islet-reactive CD8+ T cells (35,38). Contrary to our prediction, PD-1 blockade did not alter the frequency of BDC2.5 T cells producing the cytokines IFN-γ, TNF-α, and IL-2 (Fig. 5A–C and Supplementary Table 1). However, PD-1 blockade resulted in a significant increase in the number of cytokine-producing BDC2.5 cells in the pLN and pancreas (Fig. 5D and E). These data suggest that PD-1 blockade does not alter the capacity for cytokine production but significantly affects the quantity of cytokine-producing cells.
FIG. 5.
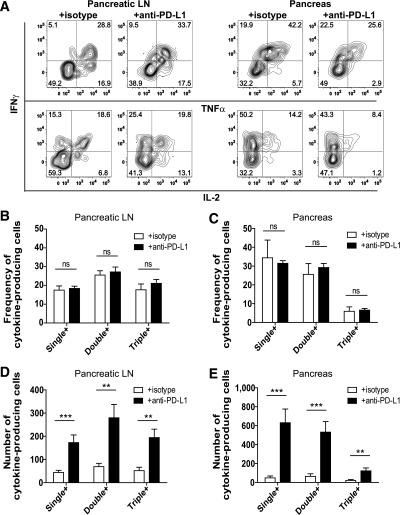
Blocking PD-1 does not alter the frequency of BDC2.5 T cells programmed to produce effector cytokines but increases the absolute number of cytokine-producing cells. A: Intracellular IFN-γ, TNF-α, and IL-2 were measured in Thy1.1+ BDC2.5 T cells isolated from the pLN and pancreas after ex vivo stimulation with PMA and ionomycin. Representative flow cytometry plots are from mice harvested at day 39 posttransfer. Quantification of the frequency of cytokine-producing BDC2.5 T cells in the pLN (B) and pancreas (C). Quantification of the absolute number of cytokine-producing BDC2.5 T cells in the pLN (D) and the pancreas (E). Data shown are combined from three independent experiments conducted between days 35 and 39 posttransfer. Data in B–E represent PMA- and ionomycin-stimulated cells from 12 mice treated with isotype control and 11 mice treated with anti–PD-L1. Mice received 250 μg/injection anti–PD-L1 or isotype control antibody at days −3 and −1 prior to harvest. Analysis of single-, double-, and triple-cytokine–producing BDC2.5 cells was performed using Boolean gating. Data are representative of four independent experiments. Single +, cells that produce IFN-γ only, TNF-α only, or IL-2 only; double +, cells that produce IFN-γ and IL-2, IFN-γ and TNF-α, or TNF-α and IL-2; triple +, cells that produce IFN-γ, TNF-α, and IL-2. ns, not significant, P > 0.05. **Very significant, P = 0.001–0.01. ***Extremely significant, P < 0.001.
PD-1, but not PD-L1, expressed by the BDC2.5 T cell is required to limit antigen-specific proliferation and infiltration of the pancreas.
Our results demonstrate that PD-1/PD-L1 blockade enhanced proliferation and infiltration of the pancreas in this low-transfer model. Previous work has demonstrated roles for both PD-1 and PD-L1 expressed by effector CD8+ T cells in regulating function (38,39); however, the specific requirement for PD-1 or PD-L1 on antigen-specific CD4+ T cells during T1D has not been studied. Therefore, we generated BDC2.5 mice deficient for PD-1 or PD-L1 (Supplementary Fig. 1F). NOD.BDC2.5.PD-1−/− and NOD.BDC2.5.PD-L1−/− mice developed normally, and both strains displayed accelerated T1D compared with WT BDC2.5 mice (Supplementary Fig. 1E). However, disease mean onset was delayed compared with reports of non-TCR transgenic NOD.PD-1−/− and NOD.PD-L1−/− mice (7,17). Importantly, all donor mice used for these experiments were euglycemic at the time of BDC2.5 cell transfer.
We next tested the role of PD-1 and PD-L1 on BDC2.5 cells in the low–cell transfer model in NOD recipients. This approach allowed us to determine the requirement for PD-1 and PD-L1 on the T cell in a WT environment. The park rates between WT and KO BDC2.5 cells were comparable (data not shown). At day 7 posttransfer, we observed a statistically significant increase in PD-1–deficient BDC2.5 cells in the spleen, pLN, and pancreas compared with PD-1–sufficient controls (Fig. 6A). There was not a significant increase in PD-1–deficient BDC2.5 cells in the iLN. Conversely, there was no difference in the number of PD-L1–deficient BDC2.5 cells compared with PD-L1–sufficient controls in any organ (Fig. 6B). These data suggest that PD-1, but not PD-L1, expressed by the BDC2.5 cell was required to suppress proliferation and infiltration of the pancreas.
FIG. 6.

PD-1, but not PD-L1, expressed by the BDC2.5 T cell is required to limit antigen-specific proliferation, CXCR3 expression, and infiltration of the pancreas. A: The absolute number of WT or PD-1 KO BDC2.5 T cells was measured 7 days posttransfer using the low-transfer model. Data are representative of six experiments containing spleen, pLN, and pancreas, five of which also contained inguinal LNs, with three to four mice for each genotype. B: The absolute number of WT or PD-L1 KO BDC2.5 T cells was determined 8 days posttransfer. Data are representative of three experiments containing spleen, pLN, and pancreas, two of which also contained inguinal LNs, with three to four mice per genotype. C: Flow cytometry histograms showing CXCR3 expression of WT or PD-1 KO BDC2.5 T cells 7 days posttransfer. D: Frequency of CXCR3+ WT or PD-1 KO BDC2.5 T cells 7 days posttransfer. E: Histological analysis of pancreas from mice 7–8 days posttransfer of WT or PD-1 KO BDC2.5 T cells. Gray is insulin, red is Thy1.1+ BDC2.5 T cells, green is CD3+ T cells, and DAPI marking nuclei is blue. Single color images showing BDC2.5 T cells in red are to the right of the overlaid image containing all four colors. White lines in the red single color image show the outline of the islet body containing the insulin-producing cells. BDC2.5 T cells are marked with yellow arrows in the WT group to aid in the visualization of the cells. Scale bar = 100 μm. F: Insulitis was scored blinded from mice 7–8 days posttransfer of WT or PD-1 KO BDC2.5 T cells. Thirty islets from WT and sixty-four islets from PD-1 KO transfers were scored blinded. Insulitis scores: 1, peri-insulitis or <25% infiltrated; 2, 25–50% infiltrated; and 3, >50% infiltrated. E and F: Two independent experiments with four mice per group. ingLN, inguinal LN; max, maximum; pancLN, pancreatic LN. ns, not significant, P > 0.05. *Significant, P = 0.01–0.05. **Very significant, P = 0.001–0.01. ***Extremely significant, P < 0.001.
We next measured CXCR3 expression on PD-1-KO.BDC2.5 cells after low transfer and found significantly higher levels of CXCR3 in the spleen and pLN compared with WT (Fig. 6C and D). Importantly, CXCR3 was not elevated in the intact PD-1-KO.BDC2.5 mouse compared with WT BDC2.5 mice (data not shown). Additionally, since naïve cells were transferred (Supplementary Fig. 1G), all BDC2.5 cells were CXCR3− at the time of transfer.
Lastly, we determined how the loss of PD-1 selectively on the BDC2.5 cells impacted localization within the pancreas. Interestingly, PD-1-KO.BDC2.5 cells could be detected both around and deep within the islet core (Fig. 6E). Mice that received PD-1-KO.BDC2.5 cells displayed more severe insulitis compared with mice that received WT BDC2.5 (Fig. 6F). This suggests that loss of PD-1 on the BDC2.5 cells promotes the ability to penetrate into the core of the islet. These data support a model where PD-1 expressed by islet-reactive CD4+ T cells regulates proliferation, CXCR3 expression, and pancreas infiltration.
DISCUSSION
The critical link between the PD-1/PD-L1 pathway and constraint of T1D has been reported (17,18); however, the cellular mechanisms are unclear. In this study, we developed a new model system to investigate how autoreactive CD4+ T cells respond to endogenous autoantigen and the role for PD-1. Our study showed that PD-1 on the BDC2.5 cell regulated proliferation, CXCR3 expression, pancreas infiltration, and autoimmune diabetes.
Current knowledge of how CD4+ T cells are regulated during spontaneous T1D progression is limited owing to a lack of tools to track these cells in vivo. Our study used the transfer of a low number of naïve autoreactive T cells to mimic rare self-reactive T cells in the preimmune repertoire (27,29). Precursor frequency can influence the magnitude of an immune response, and previous reports showed that transferring nonphysiologically high numbers of TCR transgenic T cells can lead to abnormal T-cell activation and function (12–14). We reasoned that precursor frequency would be critically important in T1D because of limited endogenous self-pMHC complexes. Indeed, analysis of CD44high frequencies in BDC2.5 cells after low or high transfer revealed that a significantly higher frequency of cells encountered antigen and became activated in the low-transfer system. Importantly, in the high transfer a large fraction of cells failed to encounter antigen at later time points even though antigen persisted, presumably because of competition for limiting pMHCII (11). In addition to antigen being a limiting factor in activation, we postulate that tolerance mechanisms in NOD mice are also limiting. Overwhelming the system with large numbers of either naïve or previously activated cells reduces the likelihood that endogenous regulatory mechanisms (e.g., PD-L1 in the islet) could induce or maintain tolerance. For studying how peripheral tolerance is maintained and why it breaks down, we believe models that more closely mimic physiological conditions should be used. Lastly, this low-transfer approach allowed us to investigate diabetogenic T-cell dynamics in the natural inflammatory environment in NOD mice during T1D pathogenesis, which cannot be recapitulated with in vitro systems, priming regimens, or mice that have transgenic expression of model antigens in the pancreas (5,8,24,35,38,40). By limiting the precursor frequency, we were able to define the dynamics of autoreactive T-cell activation in response to endogenous autoreactive pMHCII complexes.
The role for PD-1/PD-L1 interactions in regulating T cells has been investigated previously in vitro and in vivo (19). Current knowledge of how PD-1 regulates CD4+ T cells during T1D in vivo is largely limited to the secondary lymphoid organs, while less is known about the pancreas. Work from Guleria and colleagues investigated mechanisms of PD-1–mediated regulation of antigen-specific CD4+ T cells in NOD mice (6), including BDC2.5 cells. However, a high number of BDC2.5 cells were transferred into recipient mice, and a large fraction of these cells failed to proliferate in the pLN even after anti–PD-L1 administration. In our low-transfer model, the majority of the BDC2.5 cells in the pLN diluted CFSE after anti–PD-L1 administration, highlighting an important difference between low– and high–T-cell transfer numbers during diabetes pathogenesis. We extended the results from the previous study by demonstrating that PD-1 blockade caused quiescent cells to reenter cycle during a later and chronic stage of disease. During this time, Ki67+ BDC2.5 cells increased in the pancreas; however, it is unclear whether this increase correlated with trafficking or proliferation within the pancreas. It is interesting to speculate that islet-reactive CD4+ T cells could enter cell cycle in the pancreas, since T cells persist in this organ in NOD mice for weeks to months prior to T1D onset. Additionally, we showed that loss of PD-1 signaling correlated with increased expression of CXCR3. CXCR3 is not only involved in diabetogenic T cell homing to the pancreas but also optimizes Th1 differentiation in antigen-containing LNs (37). These data support a model where PD-1 expressed by the islet-reactive CD4+ T cell suppresses proliferation and limits CXCR3 expression, thereby inhibiting optimal Th1 differentiation and infiltration of the pancreas.
Lastly, we used a genetic approach to determine whether the effects that we measured with anti–PD-L1 were due to a direct effect of PD-1 or PD-L1 on the CD4+ T cells or indirect effects such as alternative ligand binding (e.g., PD-1/PD-L2 or B7-1/PD-L1). Our data highlight the importance of PD-1, but not PD-L1, acting directly on the CD4+ T cell and suggest that the PD-L1/B7-1 (41,42) interaction plays little or no role in regulating these cells. The lack of expansion with PD-L1-KO.BDC2.5 cells further excludes the PD-L1/B7-1 pathway in this model. While the PD-1-KO result underscores the importance of PD-1 on the CD4+ T cell in regulating T1D, there are important differences between anti–PD-L1 administration and selective loss of PD-1 on BDC2.5 cells. Anti–PD-L1 induced rapid onset of diabetes, consistent with reports in intact NOD mice (18). Paradoxically, PD-1-KO.BDC2.5 cells did not accelerate T1D in NOD mice despite the overwhelming number of cells in the pancreas and direct invasion of the islet early posttransfer. The lack of T1D observed with PD-1-KO.BDC2.5 cell transfers differs from previous work using PD-1-KO OT-I T-cell transfers into RIP-mOVA mice (38). We speculate that this discordance reflects differences in CD4+ and CD8+ T cells during T1D. Since CD8+ T cells are responsible for direct killing of β-cells, it stands to reason that PD-1-KO diabetogenic CD8+ T cells could have a more direct pathogenic effect on disease than PD-1-KO diabetogenic CD4+ T cells. Our histological data suggest that anti–PD-L1 is impacting other cells within islets in addition to BDC2.5 cells. Additional work is needed to define the role of anti–PD-L1 on the dynamic interplay between diabetogenic CD4+ and CD8+ T cells, dendritic cells, and regulatory T cells in the pancreas. By understanding how the PD-1 pathway functions during normal T1D development, we will strengthen our ability to target this pathway in humans.
ACKNOWLEDGMENTS
The studies were supported by the JDRF (2-2011-662 to B.T.F.), the American Diabetes Association (ADA 07-09-JF-21 to B.T.F.), and the University of Minnesota Graduate School Fellowship (to K.E.P.).
No potential conflicts of interest relevant to this article were reported.
K.E.P. designed and conceptualized the research project, did the experiments, analyzed data, prepared the figures, interpreted data, and wrote the manuscript. M.K.J. designed and conceptualized the research project, contributed to discussion, and reviewed and edited the manuscript. M.A. provided anti–PD-L1 hybridoma. B.T.F. designed and conceptualized the research project, did the experiments, analyzed data, prepared the figures, interpreted data, and wrote the manuscript. B.T.F. is the guarantor of this work and, as such, had full access to all the data in the study and takes responsibility for the integrity of the data and the accuracy of the data analysis.
The authors thank Dr. Bruce Blazar, Department of Pediatrics, University of Minnesota; Dr. David Masopust and Dr. Vaiva Vezys, Department of Microbiology, University of Minnesota; Dr. Kristin Hogquist, Department of Laboratory Medicine and Pathology, University of Minnesota; and Dr. Todd Eagar, Department of Pathology, Immunology, University of Texas-Southwestern for critical review of the manuscript and scientific discussions. The authors thank T. Obu, J. Mader, and N. Sahli from the Department of Medicine, University of Minnesota, for animal care and husbandry.
Footnotes
This article contains Supplementary Data online at http://diabetes.diabetesjournals.org/lookup/suppl/doi:10.2337/db12-1475/-/DC1.
REFERENCES
- 1.Bach JF. Insulin-dependent diabetes mellitus as an autoimmune disease. Endocr Rev 1994;15:516–542 [DOI] [PubMed] [Google Scholar]
- 2.Kikutani H, Makino S. The murine autoimmune diabetes model: NOD and related strains. Adv Immunol 1992;51:285–322 [DOI] [PubMed] [Google Scholar]
- 3.Shizuru JA, Taylor-Edwards C, Banks BA, Gregory AK, Fathman CG. Immunotherapy of the nonobese diabetic mouse: treatment with an antibody to T-helper lymphocytes. Science 1988;240:659–662 [DOI] [PubMed] [Google Scholar]
- 4.Mora C, Wong FS, Chang CH, Flavell RA. Pancreatic infiltration but not diabetes occurs in the relative absence of MHC class II-restricted CD4 T cells: studies using NOD/CIITA-deficient mice. J Immunol 1999;162:4576–4588 [PubMed] [Google Scholar]
- 5.Fife BT, Guleria I, Gubbels Bupp M, et al. Insulin-induced remission in new-onset NOD mice is maintained by the PD-1-PD-L1 pathway. J Exp Med 2006;203:2737–2747 [DOI] [PMC free article] [PubMed] [Google Scholar]
- 6.Guleria I, Gubbels Bupp M, Dada S, et al. Mechanisms of PDL1-mediated regulation of autoimmune diabetes. Clin Immunol 2007;125:16–25 [DOI] [PubMed] [Google Scholar]
- 7.Keir ME, Liang SC, Guleria I, et al. Tissue expression of PD-L1 mediates peripheral T cell tolerance. J Exp Med 2006;203:883–895 [DOI] [PMC free article] [PubMed] [Google Scholar]
- 8.Fife BT, Pauken KE, Eagar TN, et al. Interactions between PD-1 and PD-L1 promote tolerance by blocking the TCR-induced stop signal. Nat Immunol 2009;10:1185–1192 [DOI] [PMC free article] [PubMed] [Google Scholar]
- 9.Esensten JH, Lee MR, Glimcher LH, Bluestone JA. T-bet-deficient NOD mice are protected from diabetes due to defects in both T cell and innate immune system function. J Immunol 2009;183:75–82 [DOI] [PMC free article] [PubMed] [Google Scholar]
- 10.Nikoopour E, Sandrock C, Huszarik K, et al. Cutting edge: vasostatin-1-derived peptide ChgA29-42 is an antigenic epitope of diabetogenic BDC2.5 T cells in nonobese diabetic mice. J Immunol 2011;186:3831–3835 [DOI] [PubMed] [Google Scholar]
- 11.Catron DM, Rusch LK, Hataye J, Itano AA, Jenkins MK. CD4+ T cells that enter the draining lymph nodes after antigen injection participate in the primary response and become central-memory cells. J Exp Med 2006;203:1045–1054 [DOI] [PMC free article] [PubMed] [Google Scholar]
- 12.Marzo AL, Klonowski KD, Le Bon A, Borrow P, Tough DF, Lefrançois L. Initial T cell frequency dictates memory CD8+ T cell lineage commitment. Nat Immunol 2005;6:793–799 [DOI] [PMC free article] [PubMed] [Google Scholar]
- 13.Badovinac VP, Haring JS, Harty JT. Initial T cell receptor transgenic cell precursor frequency dictates critical aspects of the CD8(+) T cell response to infection. Immunity 2007;26:827–841 [DOI] [PMC free article] [PubMed] [Google Scholar]
- 14.Hataye J, Moon JJ, Khoruts A, Reilly C, Jenkins MK. Naive and memory CD4+ T cell survival controlled by clonal abundance. Science 2006;312:114–116 [DOI] [PubMed] [Google Scholar]
- 15.Katz JD, Wang B, Haskins K, Benoist C, Mathis D. Following a diabetogenic T cell from genesis through pathogenesis. Cell 1993;74:1089–1100 [DOI] [PubMed] [Google Scholar]
- 16.Haskins K, Portas M, Bradley B, Wegmann D, Lafferty K. T-lymphocyte clone specific for pancreatic islet antigen. Diabetes 1988;37:1444–1448 [DOI] [PubMed] [Google Scholar]
- 17.Wang J, Yoshida T, Nakaki F, Hiai H, Okazaki T, Honjo T. Establishment of NOD-Pdcd1-/- mice as an efficient animal model of type I diabetes. Proc Natl Acad Sci USA 2005;102:11823–11828 [DOI] [PMC free article] [PubMed] [Google Scholar]
- 18.Ansari MJ, Salama AD, Chitnis T, et al. The programmed death-1 (PD-1) pathway regulates autoimmune diabetes in nonobese diabetic (NOD) mice. J Exp Med 2003;198:63–69 [DOI] [PMC free article] [PubMed] [Google Scholar]
- 19.Fife BT, Pauken KE. The role of the PD-1 pathway in autoimmunity and peripheral tolerance. Ann N Y Acad Sci 2011;1217:45–59 [DOI] [PubMed] [Google Scholar]
- 20.Nielsen C, Hansen D, Husby S, Jacobsen BB, Lillevang ST. Association of a putative regulatory polymorphism in the PD-1 gene with susceptibility to type 1 diabetes. Tissue Antigens 2003;62:492–497 [DOI] [PubMed] [Google Scholar]
- 21.Freeman GJ, Long AJ, Iwai Y, et al. Engagement of the PD-1 immunoinhibitory receptor by a novel B7 family member leads to negative regulation of lymphocyte activation. J Exp Med 2000;192:1027–1034 [DOI] [PMC free article] [PubMed] [Google Scholar]
- 22.Salama AD, Chitnis T, Imitola J, et al. Critical role of the programmed death-1 (PD-1) pathway in regulation of experimental autoimmune encephalomyelitis. J Exp Med 2003;198:71–78 [DOI] [PMC free article] [PubMed] [Google Scholar]
- 23.Brown JA, Dorfman DM, Ma FR, et al. Blockade of programmed death-1 ligands on dendritic cells enhances T cell activation and cytokine production. J Immunol 2003;170:1257–1266 [DOI] [PubMed] [Google Scholar]
- 24.Chemnitz JM, Parry RV, Nichols KE, June CH, Riley JL. SHP-1 and SHP-2 associate with immunoreceptor tyrosine-based switch motif of programmed death 1 upon primary human T cell stimulation, but only receptor ligation prevents T cell activation. J Immunol 2004;173:945–954 [DOI] [PubMed] [Google Scholar]
- 25.Nishimura H, Minato N, Nakano T, Honjo T. Immunological studies on PD-1 deficient mice: implication of PD-1 as a negative regulator for B cell responses. Int Immunol 1998;10:1563–1572 [DOI] [PubMed] [Google Scholar]
- 26.Yamazaki T, Akiba H, Iwai H, et al. Expression of programmed death 1 ligands by murine T cells and APC. J Immunol 2002;169:5538–5545 [DOI] [PubMed] [Google Scholar]
- 27.Moon JJ, Chu HH, Hataye J, et al. Tracking epitope-specific T cells. Nat Protoc 2009;4:565–581 [DOI] [PMC free article] [PubMed] [Google Scholar]
- 28.Zhou X, Bailey-Bucktrout SL, Jeker LT, et al. Instability of the transcription factor Foxp3 leads to the generation of pathogenic memory T cells in vivo. Nat Immunol 2009;10:1000–1007 [DOI] [PMC free article] [PubMed] [Google Scholar]
- 29.Moon JJ, Chu HH, Pepper M, et al. Naive CD4(+) T cell frequency varies for different epitopes and predicts repertoire diversity and response magnitude. Immunity 2007;27:203–213 [DOI] [PMC free article] [PubMed] [Google Scholar]
- 30.Pepper M, Pagán AJ, Igyártó BZ, Taylor JJ, Jenkins MK. Opposing signals from the Bcl6 transcription factor and the interleukin-2 receptor generate T helper 1 central and effector memory cells. Immunity 2011;35:583–595 [DOI] [PMC free article] [PubMed] [Google Scholar]
- 31.Jenkins MK, Moon JJ. The role of naive T cell precursor frequency and recruitment in dictating immune response magnitude. J Immunol 2012;188:4135–4140 [DOI] [PMC free article] [PubMed] [Google Scholar]
- 32.Szabo SJ, Kim ST, Costa GL, Zhang X, Fathman CG, Glimcher LH. A novel transcription factor, T-bet, directs Th1 lineage commitment. Cell 2000;100:655–669 [DOI] [PubMed] [Google Scholar]
- 33.Agata Y, Kawasaki A, Nishimura H, et al. Expression of the PD-1 antigen on the surface of stimulated mouse T and B lymphocytes. Int Immunol 1996;8:765–772 [DOI] [PubMed] [Google Scholar]
- 34.Bennett F, Luxenberg D, Ling V, et al. Program death-1 engagement upon TCR activation has distinct effects on costimulation and cytokine-driven proliferation: attenuation of ICOS, IL-4, and IL-21, but not CD28, IL-7, and IL-15 responses. J Immunol 2003;170:711–718 [DOI] [PubMed] [Google Scholar]
- 35.Martin-Orozco N, Wang YH, Yagita H, Dong C. Cutting Edge: Programmed death (PD) ligand-1/PD-1 interaction is required for CD8+ T cell tolerance to tissue antigens. J Immunol 2006;177:8291–8295 [DOI] [PubMed] [Google Scholar]
- 36.Frigerio S, Junt T, Lu B, et al. Beta cells are responsible for CXCR3-mediated T-cell infiltration in insulitis. Nat Med 2002;8:1414–1420 [DOI] [PubMed] [Google Scholar]
- 37.Groom JR, Richmond J, Murooka TT, et al. CXCR3 chemokine receptor-ligand interactions in the lymph node optimize CD4+ T helper 1 cell differentiation. Immunity 2012;37:1091–1103 [DOI] [PMC free article] [PubMed] [Google Scholar]
- 38.Keir ME, Freeman GJ, Sharpe AH. PD-1 regulates self-reactive CD8+ T cell responses to antigen in lymph nodes and tissues. J Immunol 2007;179:5064–5070 [DOI] [PubMed] [Google Scholar]
- 39.Latchman YE, Liang SC, Wu Y, et al. PD-L1-deficient mice show that PD-L1 on T cells, antigen-presenting cells, and host tissues negatively regulates T cells. Proc Natl Acad Sci USA 2004;101:10691–10696 [DOI] [PMC free article] [PubMed] [Google Scholar]
- 40.Kurts C, Heath WR, Carbone FR, Allison J, Miller JF, Kosaka H. Constitutive class I-restricted exogenous presentation of self antigens in vivo. J Exp Med 1996;184:923–930 [DOI] [PMC free article] [PubMed] [Google Scholar]
- 41.Butte MJ, Keir ME, Phamduy TB, Sharpe AH, Freeman GJ. Programmed death-1 ligand 1 interacts specifically with the B7-1 costimulatory molecule to inhibit T cell responses. Immunity 2007;27:111–122 [DOI] [PMC free article] [PubMed] [Google Scholar]
- 42.Paterson AM, Brown KE, Keir ME, et al. The programmed death-1 ligand 1:B7-1 pathway restrains diabetogenic effector T cells in vivo. J Immunol 2011;187:1097–1105 [DOI] [PMC free article] [PubMed] [Google Scholar]