

Abstract
Vitamin A deficiency causes impaired vision and blindness in millions of children around the world. Previous studies in zebrafish have demonstrated that retinoic acid (RA), the acid form of vitamin A, plays a vital role in early eye development. The objective of this study was to describe the effects of early RA deficiency by treating zebrafish with diethylaminobenzaldehyde (DEAB), a potent inhibitor of the enzyme retinaldehyde dehydrogenase (Raldh) that converts retinal to RA. Zebrafish embryos were treated for 2 hours beginning at 9 hours post-fertilization (hpf). Gross morphology and retinal development were examined at regular intervals for 5 days after treatment. The optokinetic reflex (OKR) test, visual background adaptation (VBA) test, and the electroretinogram (ERG) were performed to assess visual function and behavior. Early treatment of zebrafish embryos with 100 μM DEAB (9hr) resulted in reduced eye size and this microphthalmia persisted through larval development. Retinal histology revealed that DEAB eyes, had significant developmental abnormalities but had relatively normal retinal lamination by 5.5 days post-fertilization (dpf). However, the fish showed neither, an OKR or VBA response. Further, the retina did not respond to light as measured by the ERG. We conclude that early deficiency of RA during eye development causes microphthalmia as well as other visual defects, and that timing of the RA deficiency is critical to the developmental outcome.
Keywords: zebrafish, retinoic acid, microphthalmia, ERG, OKR
INTRODUCTION
Retinoic acid (RA) plays a vital role in embryonic development. Both excess and insufficient RA levels lead to severe congenital defects in the eyes, as well as the skull, limbs, brain, heart, and other systems and structures (Ross et al., 2000). Studies in zebrafish (Danio rerio) have demonstrated that excess RA during optic primordia formation leads to duplication of the ventral retina (Hyatt et al., 1992). Conversely, using citral, a retinaldehyde dehydrogenase (Raldh) inhibitor, to reduce endogenous RA results in eyes lacking a ventral retina.(Marsh-Armstrong et al., 1994) Studies examining RA effects in mice have had to employ double and triple gene knockouts since mice have 3 RALDH enzymes, whereas the Raldh enzymes in zebrafish are readily inhibited by water-soluble biochemical agents that block RA synthesis (Molotkov et al., 2006; Kumar et al., 2012). The relatively large size of its eyes and well documented embryogenesis make zebrafish an ideal candidate for studying the role of RA during eye development.
Microphthalmia is a congenital ocular deformation characterized by abnormally small eyes, with or without structural abnormalities. It is clinically juxtaposed with anophthalmia, a more severe condition in which ocular components are absent. Studies in both human and animal models have associated microphthalmia with genes that are involved in vitamin A metabolism. For example, STRA6 (STimulated by Retinoic Acid gene 6) is proposed to play a role in the pathogenesis of anophthalmia/microphthalmia (A/M).
STRA6 encodes a trans-membrane receptor for retinol-binding protein, which mediates cellular uptake of retinol. Once channeled into the cell, retinol is oxidized to retinal, which is in turned oxidized to RA. A mutation in STRA6 will disrupt vitamin A metabolism and ultimately reduce levels of RA. Clinical research has identified variants of STRA6 in patients with A/M (White et al., 2008). In particular, truncating mutations in STRA6 link to Mathew-Wood syndrome, a rare congenital disorder characterized by microphthalmia as well as heart and lung defects (Golzio et al., 2007).
In animal models, microphthalmia has been experimentally induced by reducing levels of RA. In 2008, Isken et al. used an antisense morpholino oligonucleotide to knock down stra6 in developing zebrafish (Isken et al., 2008). Injected embryos developed a microphthalmia, curved body axis, cardiac edema, and craniofacial defects (Isken et al., 2008). These multisystem malformations are similar to those observed in children suffering from Mathew-Wood Syndrome. Chicken embryos also develop microphthalmia at specific developmental stages when RA signaling is inhibited (Sen et al., 2005). Additionally, morpholino knockdown of bcox, a key enzyme in vitamin A biogenesis in zebrafish, resulted in a small eye and photoreceptor defects (Biehlmaier et al., 2005a). We have found that zebrafish embryos treated with RA inhibitors (citral or diethylaminobenzaldehyde) just before bud formation (i.e. ~9 hours post fertilization) develop microphthalmia. Inhibiting RA synthesis slightly later, on the other hand, results in a different phenotype, namely an absence of the ventral retina (Marsh-Armstrong et al., 1994). Our results provide further evidence that RA deficiency plays a role in the pathogenesis of microphthalmia, and also that small alterations in the timing of the RA deficiency result in quite different phenotypes.
MATERIALS AND METHODS
Zebrafish care
AB, alpha-actin-GFP, and RGYn fish strains were maintained under standard conditions at 28.5°C on a 10-hours dark and 14-hours light cycle (Higashijima et al., 1997; Westerfield, 2000). The RGYn fish utilize retinoic acid response element (RARE) driven promoters to express EYFP (Perz-Edwards et al., 2001). To work with embryos at the desired developmental stage, zebrafish tanks were kept in a modular lighting system that alters the fish’s day/night cycles. The light box was set to automatically turn on and off at 12:15am and 2:15pm, respectively. Embryos were staged in hours post-fertilization (hpf) and days post-fertilization (dpf) based on morphological features. Embryos were raised in E3 buffer (5 mM NaCl, 0.17 mM KCl, 0.33 mM CaCl2, 0.33 mM MgSO4) at 28.5°C. All animal husbandry and experiments were approved and conducted in accordance with guidelines set forth by the Institutional Animal Care and Use Committee of Harvard University and Western University of Health Sciences, and adhered to the ARVO Statement for the Use of Animals in Ophthalmic and Vision Research.
Diethylaminobenzaldehyde (DEAB) treatment
A stock solution of 40 mM DEAB (VWR Radnor, PA) was made by dissolving 0.071 g of DEAB in 10 mL of dimethyl sulfoxide (DMSO) and kept at room temperature. DEAB is a potent, partially competitive inhibitor of aldehyde dehydrogenases (ALDH), the enzymes that convert retinal to retinoic acid in vivo as well as in vitro (Russo et al., 1988; Mahmoud et al., 1993). The optimal concentration of DEAB and the appropriate embryonic stage for biochemical perturbation were determined through a series of experimental trials. 8, 9, and 10 hpf embryos were treated for 2 hours with different DEAB concentrations in E3 buffer: 10, 50, 100, 200, and 400 μM. Control embryos were treated with equivalent DMSO-treated E3 buffer. After treatment, embryos were washed three times with E3 buffer and allowed to grow for the duration of the study. Demonstration of DEAB’s effectiveness at inhibiting RA synthesis was accomplished by incubating 100 μM DEAB with 60hpf RGYn embryos for 2 hours. The treated embryos were then embedded in methylcellulose and oriented with the lateral side up for examination using a fluorescence microscope with a FITC filter. RGYn embryos express a RARE driven EYFP construct. In the presence of RA, a fluorescence signal is detected. In the absence of RA, the signal is eliminated. Treating RGYn embryos at 8–10 hpf was not beneficial since the RARE EYFP construct is not expressed at that time (Perz-Edwards et al., 2001).
Eye measurement
Lateral images of zebrafish eyes were taken using a Motic 1000 camera (Motic North America Richmond, British Columbia) attached to a stereo microscope and analyzed using ImageJ. Each eye was measured in the dorsal to ventral (vertical) and anterior to posterior (horizontal) plane. To more accurately demonstrate changes to to the eye size, the surface area (SA) of each eye was calculated using a modified surface area formula for an ellipse: . Horizontal body length measurements were similarly measured on the lateral axis.
Histology
Embryos were fixed in 4% paraformaldehyde in PBS at 4°C overnight. Embryos were rinsed and stored in 100% methanol at −20°C. Embryos were dehydrated in ethanol and embedded in Epon resin. Embryos were bathed in propylene oxide twice, 15 minutes each time. Samples were infused with 1:1 propylene oxide and Epon and mixed for 2 hours at room temperature. Embryos were then placed in 1:3 propylene oxide and Epon and mixed overnight at room temperature. The next day, embryos were transferred into appropriately labeled wells in an embedding mold. The embedding mold containing embryos was placed in an oven at 65°C for approximately one day, to polymerize the resin.
Embedded embryos were coronally sectioned using a Sorvall JB-4 microtome. 1μm sections of the eye were transferred to a 25 × 75 × 1 mm glass slide and left to dry on a hot plate. Sections were stained according to a modified Lee’s methylene blue-basic fuchsin dye procedure and then examined using a Zeiss light microscope (Carl Zeiss Thornwood, New York) to locate the position of the desired section. Slides were covered with a cover slip using PPX mounting solution. Sections were imaged on a Leica light microscope with a RetigaExi camera (QImaging Surrey, BC.) Presence of an optic nerve was used as the criterion to select appropriate central sections for analysis.
Visual background adaptation (VBA)
Petri dishes containing 5.5 dpf larvae were placed in a small box to condition them to 20 minutes of darkness and dorsal view images of the larvae taken immediately. The larvae were then conditioned to 15 minutes of bright light and images captured in the same manner (Neuhauss et al., 1999; Muto et al., 2005).
Optokinetic reflex (OKR)
Experiments were done using a modified OKR stimulator system, consisting of computer, binocular microscope, video camera, projector, screen and computer-generated stimulation pattern (Stujenske et al., 2011). The computer was equipped with LabView (National Instruments Austin, TX), custom-built software that provided both the stimulus and the image and video capture. Computer-generated stimuli, which allowed for continuous variation of velocity, were composed of alternating vertical black and white stripes.
Under dim light, 5.5 dpf larvae were placed in a small Petri dish containing methylcellulose. Using the image and video capture in LabView, a box was made around the head of each larva to capture responses of the eyes for the duration of the stimulus. The stimulus was programmed to run for 2 minutes, during which the width of the stripes as well as the speed and the direction of the stimulation pattern were manipulated to elicit responses from the larvae. Captured videos of the eyes were analyzed using Tracker 4.0 (Brown & Cox, 2009).
Electroretinogram (ERG)
Experiments were performed on 5.5 dpf larvae at room temperature in the mid-afternoon. Anesthetized larvae were placed laterally on a filter paper covered with 2% agarose and perfused with Ringer’s solution. Ringer’s solution was maintained at pH 7.8 by continuously gassing it with 97% O2 and 3% CO2. The eye was positioned, with the cornea facing upward, at the center of the stimulus light spot (diameter = 5 mm) generated by a halogen light source. To record ERG responses, a glass electrode with a tip diameter of 2–6 μm containing a chloride-coated silver wire and filled with Ringer’s solution was gently inserted under the surface of the eye near the cornea. ERGs were amplified at 1,000 total gain and low-pass filtered at 300 Hz. Stimulus flash duration was controlled by an electromechanical shutter and a customized LabView macro. Software gathered data generated the ERG waveforms for each individually tested eye.
Statistics
Microsoft Excel 2010 and SPSS v13 were used for statistical analysis. T-tests and ANOVA were used for treatment comparisons. Regression analysis and the Fisher Exact test were used for survival analysis. Significance was set at 0.05.
RESULTS
DEAB treatment at 9hpf increases mortality and induces microphthalmia
Zebrafish embryos treated with 10, 50, 100, 200, or 400 μM DEAB at 9 hpf for 2hours showed variable survivability. Embryos treated with 400 μM DEAB failed to develop and died by 24 hpf. Treatment with 200 μM resulted in severe cardiac edema and significant mortality within the first days after treatment. DEAB treatments between 10 and 100 μM resulted in relatively high survival rates and eye size was almost always reduced as compared to controls (Fig. 1). The 100 μM DEAB treatments resulted in the most consistent phenotype and were used for subsequent experiments. Treatment of RGYn embryos with 100 μM DEAB dramatically reduced RA activity as evidenced by the decreased EYFP signal (Fig. 2).
Figure 1.

Effect of DEAB at different concentrations. 9 hpf embryos were treated with different concentrations of DEAB: 10, 50, and 100 μM. At 5.5 dpf, morphological changes induced by RA deficiency appear to be increasingly severe as DEAB concentration increases. At all concentrations, DEAB-treated larvae show an abnormal swim bladder and a shorter body axis. Larvae treated with 10 μM appear relatively normal. Larvae treated with 50 μM showed cardiac edema and smaller eyes. Larvae treated with 100 μM showed prominent cardiac edema, curved body axis, and microphthalmia. Lateral view. Scale bar =200 μm.
Figure 2.

DEAB treatment inhibits RA signaling. 60 hpf RGYn embryos were treated with 100 μM DEAB for 2 hours. (A) Embryo at 60 hpf before DEAB treatment. The green fluorescence is indicative of RA activity in the ventral retina activating the retinoic acid response element (RARE) EYFP construct in the RGYn fish and viewed through a FITC filter. (B) The same embryo after a 2 hour incubation with DEAB beginning at 60 hpf. Expression of the RARE driven EYFP construct is greatly reduced.
Treating 9 hpf embryos with 100 μM DEAB for 2 hours did reduce their survivability somewhat. At 36 hpf, 62.8% of DEAB-treated embryos (n=972) had survived compared to 85.2% of controls (n=399). That 15% of the controls did not survive could be accounted for by natural death and/or unintended impact from experimental procedures such as injury from pipette suction during washes. When the survival rate of control larvae is normalized to 100%, the survival rate of DEAB-treated larvae normalizes to 73.6%. Embryos surviving past 36hpf usually remained alive up to 6 dpf, at which point most of them died due to rupture of an edematous heart. Less than 3% of DEAB-treated larvae survived to adulthood, and none of these long-term survivors showed noticeably smaller eyes or cardiac edema.
A small percentage (<25%) of DEAB-treated embryos developed a transient microphthalmia with little or no cardiac edema. The vast majority of the 100 μM DEAB-treated embryos (>75%), on the other hand, developed a progressive and persistent microphthalmia along with cardiac edema (Fig. 3 and Fig. 4). Starting at 84 hpf, the small eye phenotype became quite pronounced. By this stage, other typical characteristics of RA deficiency were observed in DEAB-treated larvae: lack of a touch response, shortened body axis, curly tail, reduced forebrains, enlarged yolk sac, and motor problems such as the inability to swim. By 5.5 dpf the microphthalmia is quite dramatic in DEAB larvae (Fig. 4). The eye size of DEAB-treated larvae is just 77% of that of controls. Although the body length of DEAB larvae is also reduced at 5.5 dpf, eye diameter relative to body length is nevertheless significantly smaller in DEAB treated animals as compared to control larvae: 7.7% compared to 8.5% respectively diameter of the eye as a percentage of body length; p=0.003; Control n=6; DEAB n=15; T-test).
Figure 3.
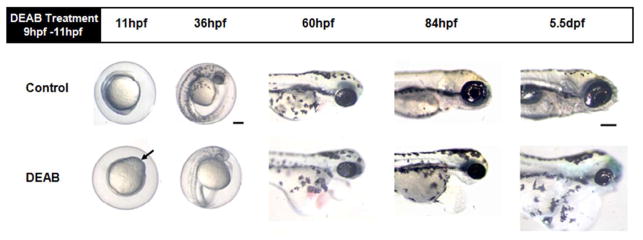
RA deficiency perturbs eye development. At 11 hpf, 2 hours after treatment, DEAB-treated embryos show signs of abnormal development (black arrow). At 36 hpf, they appear developmentally delayed, showing less pigmentation and their eyes are not as well-defined as the controls. By 60 hpf, microphthalmia is quite noticeable in DEAB-treated embryos. Cardiac edema is also quite evident. At 84 hpf, DEAB-treated embryos continue to have smaller eyes, cardiac edema and have an overall smaller body size. These differences become quite pronounced by 5.5 dpf, at which stage DEAB-treated embryos’ eyes are smaller and rounder than control eyes, even when adjusting for the difference in body size. Lateral view. Scale bar =200 μm.
Figure 4.
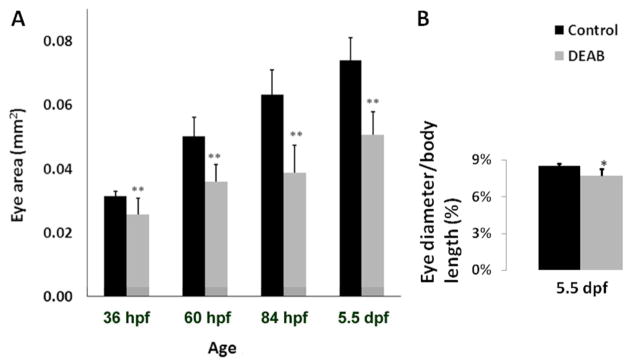
Retinoic acid deficiency significantly reduces eye size. A) Control and DEAB eyes continue to grow throughout larval development. DEAB eyes have a significantly smaller surface area as compared to controls beginning at 36 hpf and continuing through 132 hpf (5.5dpf). 36 hpf (Control, n=14; DEAB, n=48); 60 hpf (Control, n=14; DEAB n=22). 84 hpf (Control, n=14; DEAB n=35). 5.5 dpf (Control, n=21; DEAB n=57). B) The eye diameter, relative to body length, in DEAB treated larvae is smaller compared to controls at 5.5 dpf. (Control, n=6; DEAB n=15) For all data measures, error bars represent the standard deviation of the mean. * p = 0.003; ** p≪0.001T-test.
Retinal development is perturbed in DEAB-treated larvae
Histological analysis confirmed microphthalmia, but also revealed abnormal retinal development in DEAB-treated larvae at 36, 60, and 84 hpf (Fig. 5). Transverse sections at 36 hpf showed that retinas from DEAB-treated embryos were discernibly smaller and the retinal cell population was reduced.
Figure 5.

Retinal histology of controls vs. DEAB eyes. At 36 hpf, DEAB sections show an optic nerve (ON) but cell density is reduced. By 60 hpf, controls have proper retinal lamination with 5 layers: ganglion cell layer (GCL), inner nuclear layer (INL), outer plexiform layer, and outer nuclear layer (ONL). 60 hpf DEAB retinas lack these well-defined retinal layers. By 84 hpf, DEAB retinas appear significantly smaller than age-matched controls and retinal cell layers are not well organized. At 5.5 dpf, DEAB retinas show distinct retinal cell layers with normal stratification. Top-left inset: Red arrows identify the pink stained outer segments extending from purple-stained photoreceptor inner segments to the RPE in control 5.5 dpf retinas. Similar stained structures are not identified in DEAB-treated retinas. Bottom right inset: The elongated cells of the cilliary marginal zone, found in controls and DEAB-treated fish. Black arrows point to the elongated proliferative cells. Transverse sections selected represent the typical retina seen within each age group: 36 hpf (Control, n=4; DEAB, n=6); 60 hpf (Control, n=5; DEAB n=4). 84 hpf (Control, n=7; DEAB n=9). 5.5 dpf (Control, n=8; DEAB n=11). Dorsal is up. Scale bar = 100 μm.
By 60hpf the retina cells in controls had begun to differentiate and to migrate creating a laminated structure. However, at this stage, retinas from the DEAB-treatment group were developmentally delayed; both the inner and outer plexiform layers were minimally developed although a small optic nerve was apparent, indicating some ganglion cell differentiation. By 84 hpf, control retinas had developed further whereas retinas from DEAB treated fish remained smaller and showed variation in cell layer lamination. Whereas most retinas from DEAB-treated fish at 84 hpf showed distinctive layers of cells, there were some that still had negligible lamination. Although not as well defined, the ganglion cell layer (GCL), inner nuclear cell layer (INL), and outer nuclear layer (ONL) are present in this retina. Further, photoreceptors and bipolar cells could be distinguished by their elongated oval shape and circular shape, respectively. Finally, by 5.5 dpf, retinas from DEAB-treated fish remained significantly smaller in size, but had distinctive cell layers with appropriate layer stratification. The OPL and IPL as well as ganglion cells, bipolar cells, and photoreceptors cells were clearly visible.
DEAB-treated larvae have no behavioral or physiological visual response
To test the responsivity of DEAB-treated larvae to light, we first examined their visual background adaptation (VBA) response. VBA is a neuroendocrine camouflage response that matches pigment distribution in the body to the environment’s light levels (von Frisch, 1911; Hogben & Slome, 1931). Dark-adapted fish disperse their melanin pigment and thus appear dark. Light-adapted fish aggregate melanin granules and thus appear pale. Blind fish, unable to detect light, appear dark under any condition whereas fish with impaired vision have been shown to have gradations of melanin dispersal that corresponds to the degree of visual impairment (Neuhauss et al., 1999).
After 20 minutes of darkness, 5.5 dpf control larvae appeared dark. After 15 minutes of light exposure, they appeared transparent. 5.5 dpf DEAB-treated larvae on the other hand did not exhibit a VBA response, appearing dark under both dark and light conditions (Fig. 6). VBA depends on the retina and pineal pathways and does not appear to require the optic tectum based on evidence in zebrafish showing that neither unilateral nor bilateral ablations of the tectal neuropil permanently eliminated VBA responses (Roeser & Baier, 2003)(Zhang et al., 2010). Thus, abolishment of the VBA suggests that DEAB larvae may be visually impaired and possibly have impaired pineal functionality as well – though this latter point was never specifically examined.
Figure 6.
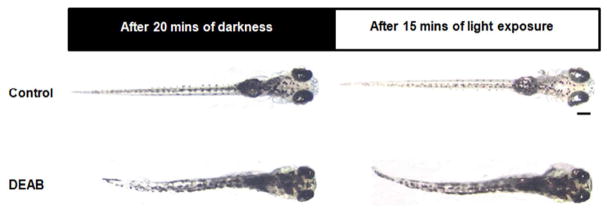
DEAB larvae do not show a VBA response at 5.5 dpf. After 20 minutes in the dark, control larvae disperse their melanin granules, appearing dark. After 15 minutes of light exposure, they adapt by aggregating melanin granules, becoming translucent. DEAB-treated larvae failed to adjust their melanin dispersal in response to changes in ambient light level, appearing dark under both conditions. Dorsal view. Scale bar =200 μm.
The optokinetic response (OKR) is a reflexive eye movement in response to gradient motion. All vertebrates display this visually guided behavior. The purpose of this reflex is to compensate for body and head motion and stabilize visual images on the retina. It also allows animal’s eyes to follow moving objects while its head remains stationary. This reflexive behavior develops rapidly in zebrafish, making it possible to test larvae as young as 5 dpf, at which time the OKR is fully developed (Brockerhoff et al., 1995; Neuhauss et al., 1999; Huang & Neuhauss, 2008). The OKR serves as an advantageous behavioral paradigm to study vision because it is robust and does not require training. A response is easily elicited by moving vertical stripes through the animal’s visual field. The eyes follow the stripes with a smooth pursuit movement, followed by a rapid eye movement (saccade) in the opposite direction (Emran et al., 2007) 5.5 dpf DEAB-treated larvae failed to show any OKR responses. (n=11). However, we also observed that whereas the extracellular muscles developed in these fish, they did not appear to attach correctly to the eyes in DEAB-treated fish (Fig. 7), perhaps explaining the lack of OKR responses in these fish.
Figure 7.
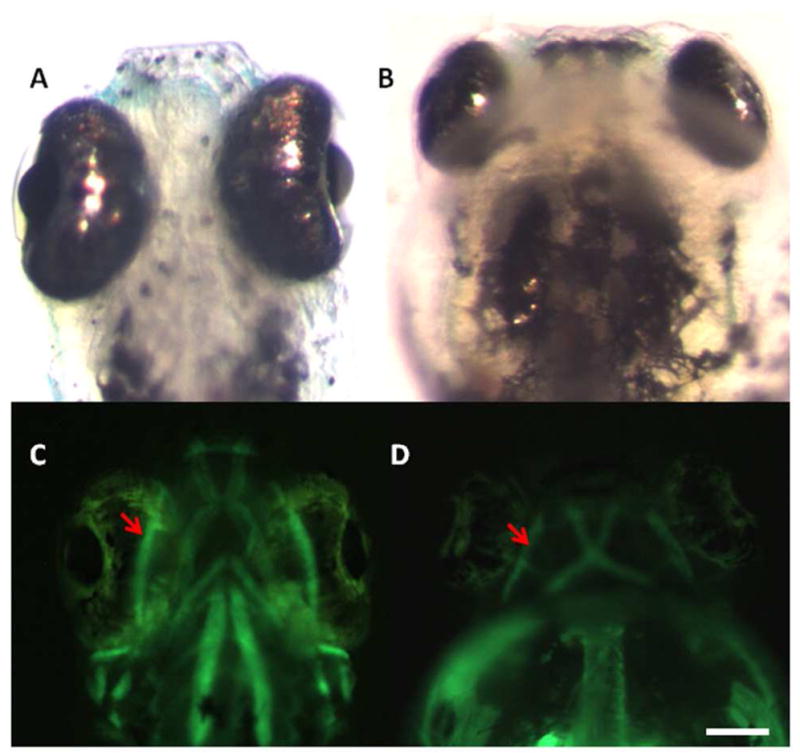
Extraocular muscles are present but not in the correct location relative to the eyes after RA deficiency. (A and B) Control and DEAB-treated embryos at 5.5 dpf viewed from the ventral side. (C and D) Fluorescence images showing the muscles tagged with an α-actin GFP construct in the same Control and DEAB-treated embryos. The oblique muscles (red arrows) of DEAB embryos develop, but are behind the eye compared to Control oblique muscles which are correctly attached to the eye. Scale bar = 100 μm.
To determine if the absence of both OKR and VBA response was a direct consequence of retinal impairment, electroretinogram (ERG) recordings were performed with larvae at 5.5 dpf, at which age ERG responses are readily elicited from zebrafish retinas (Brockerhoff et al., 1995). The ERG, commonly used in diagnosis of retinal diseases, is a mass electrical response of the outer retina to brief flashes of light. A typical zebrafish ERG recording consists of three main components: a-, b-, and d-waves. The a-wave originates from the photoreceptors, the b-wave from ON-bipolar cells, and the d-wave mainly from OFF bipolar cells (Sieving et al., 1994).
Intact eye recordings indicated that retinas from DEAB-treated larvae did not generate any ERG components (Fig. 8). Control recordings showed typical zebrafish ERGs, in which the b-wave, significantly larger than the d-wave, is preceded by a small, but distinguishable a- wave (Dowling, 2012). The absence of an a-wave indicates that photoreceptors from DEAB-treated larvae do not respond to light.
Figure 8.
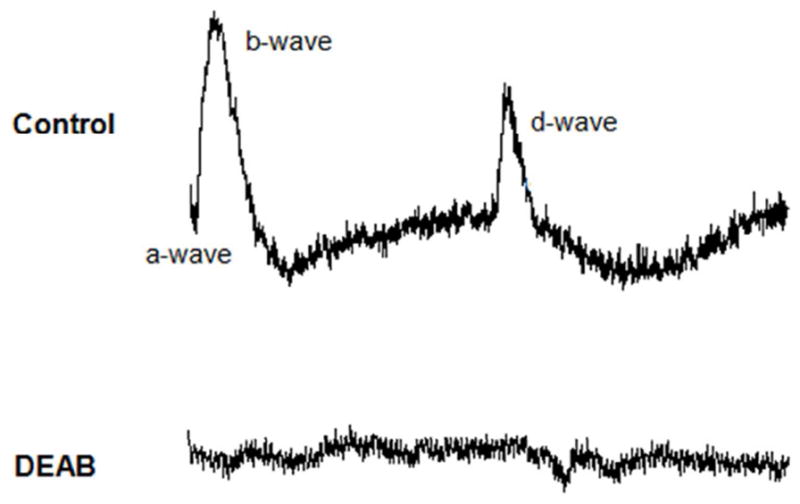
DEAB larvae do not have an ERG response at 5.5 dpf. In zebrafish, a normal ERG shows 3 waves: the a-wave originates from the photoreceptor cells, b-wave from the ON-bipolar cells, and d-wave from the OFF-bipolar cells. In DEAB eyes, the ERG lacks all three components, as shown by a relatively flat line (n=9).
DISCUSSION
Earlier work demonstrated that exogenous RA given between 10 and 11 hpf induces excess ventral retina formation, whereas inhibition of RA synthesis by citral, another RA synthesis inhibitor, at the 9–12 somite stage of zebrafish development prevents ventral retina formation. Extending this work, we found that inhibiting RA at a slightly earlier time point, by just one hour, leads to the development of microphthalmia, a delay in retinal development. Our initial findings were presented using citral as in earlier studies(Cameron & Dowling, 2009). However, due to DEAB’s selectivity for the retinal dehydrogenase pathway and greater embryo survival we elected to use it for this study (Russo et al., 1988; Mahmoud et al., 1993; Perz-Edwards et al., 2001). We have independently demonstrated that DEAB effectively eliminated RA synthesis, albeit in slightly older embryos (Fig. 2). It should be noted that RA signaling, as measured by the fluorescence in the RGYn embryos, was not completely eliminated due to existing RA; DEAB only inhibits its synthesis and does not degrade RA already present.
We inhibited RA synthesis using DEAB for 2 hours, just as the optic primordium is forming (9 hpf), and examined the developing eye for several days after. DEAB-treated larvae had statistically smaller eyes compared to controls beginning at 36 hpf and continuing to at least 5.5 dpf (Fig. 3 and 4). This observation supports the well-established link between vitamin A deficiency (VAD) and congenital ocular malformations (Mark et al., 2006). The multi-system abnormalities observed in DEAB-treated fish also substantiate Wilson et al.’s finding that vitamin A-deficient rat fetuses present a large array of congenital malformations affecting the ocular, cardiac, respiratory, and urogenital systems, collectively referred to as fetal VAD syndrome (Wilson et al., 1953).
The DEAB phenotype resembles human syndromic microphthalmia, which is typically associated with craniofacial dysmorphic features, heart and vascular malformations, skeletal and limb anomalies, and gut and brain defects (Golzio et al., 2007). In particular, severe microphthalmia and cardiac edema observed in DEAB-treated larvae are similar to the symptoms observed in patients suffering from Mathew-Wood syndrome (Golzio et al., 2007; Pasutto et al., 2007). This correlation has also been demonstrated by Isken et al.’s study, which showed that stra6-deficient zebrafish embryos developed microphthalmia and heart edema. Similar to DEAB-treated fish, stra6-knockdown fish had normal retinal lamination at 4 dpf (Isken et al., 2008).
Since the expression of Stra6 is directly regulated by RA signaling and is required for cellular uptake of retinol to synthesize RA, it is not surprising that stra6-knockdown embryos develop the same symptoms as the RA-deficient larvae in our study. Ironically, Isken et al. suggested that microphthalmia as well as cardiac and craniofacial abnormalities are caused by RA excess in surrounding tissues rather than RA deficiency. Our data disagree with this view. DEAB effectively down regulates the synthesis of RA, thereby challenging Isken et al.’s assertion on the role of extracellular excess RA (Russo et al., 1988). The ocular, cardiac, and other development malformations in DEAB-treated fish were undoubtedly induced by RA deprivation not RA excess. Given the well-established association between vitamin A deficiency and ocular defects, the DEAB phenotype presents a more appropriate model for clinical microphthalmia.
While we have not presented evidence examining the mechanism behind the observed microphthalmia, the proliferating ciliary marginal zone is present in DEAB-treated zebrafish larvae (Fig 5 lower inset) (Wehman et al., 2005). Nevertheless, the rate of eye growth was statistically slower for DEAB-treated fish (AVOVA p≪0.001) suggesting that proliferation may be impaired. It is also possible that changes in apoptosis similar to those seen in the chick could account for the reduced eye size (Sen et al., 2005).
Several published studies have attested to the involvement of RA regulation in photoreceptor differentiation and maturation (Hyatt et al., 1996; Biehlmaier et al., 2005b; Prabhudesai et al., 2005; Khanna et al., 2006). The top inset images shown in Figure 5 suggest that outer segment development in the DEAB larvae may be impaired and could explain the complete lack of an ERG response. This argument fits well with the historical evidence linking RA signaling and photoreceptor development. Even the small group of DEAB treated larvae that did not develop microphthalmia had reduced visual function as measured by the OKR and ERG. The OKR saccades per minute were reduced 25% compared to controls (p=0.01 n=6 for each group), and the ERG amplitudes (both a- and b-wave) from these larvae were also reduced compared to controls, though the sample size was insufficient for statistical significance (n=3). Taken together with the complete lack of visual response in their microphthalmia counterparts, RA inhibition is likely affecting the retina’s function beginning at the photoreceptor level. However, the exact effect on the photoreceptors needs elucidation using molecular techniques and electron microscopy to identify the cellular changes.
Retinal cell fate specification follows a specific timeline (Cepko et al., 1996). Although we treated our embryos before the eye anlage forms, our results suggest that RA plays a vital regulatory role to a host of genes controlling eye development. Once this regulatory process is hampered – in our case by inhibiting RA synthesis – the downstream, long-term consequences can be quite severe. In this case microphthalmia, a dysfunctional vision system, and ultimately death are the results.
The mechanism of the persistent microphthalmia in DEAB treated fish is not clear. First, RA synthesis is presumed to only be inhibited for a brief time using our protocol. DEAB is a competitive inhibitor and once DEAB is oxidized to 4-Diethylaminobenzoic acid, (which happens quickly) it loses its ability to bind to the active site on Raldh (Russo et al., 1988). When the DEAB solution is removed and the embryos washed in fresh E3, recovery of RA synthesis should quickly ensue – though we never specifically tested this. Second, this period of inhibition overlaps with the time when RA inhibition was shown to cause the loss of ventral retina tissue (Marsh-Armstrong et al., 1994). Marsh-Armstong et al. found that citral treatment beginning at 10 hpf was sufficient to prevent ventral retina formation, and yet we never saw this phenotype treating at 9 hpf. We did however reproduce the ventral retina absence phenotype by treating our fish with DEAB an hour later (10 hpf). We found similar results using citral, but chose to use DEAB for this study because of its specific interaction with the retinaldehyde dehydrogenase enzymes (Mahmoud et al., 1993).
Deficiency of RA at slightly different times in zebrafish can cause quite different phenotypes. We conclude, therefore, that the regulation of RA synthesis and signaling is tightly controlled during embryonic development. Despite many published studies exploring and clarifying the role that RA plays in early eye development, the gene targets for RA are still largely unknown (Adler & Canto-Soler, 2007; Duester, 2008a, b). The use of comprehensive gene expression analysis tools, such as microarrays, has been useful in understanding the genes involved in eye development (Cameron et al., 2005; Leung & Dowling, 2005; Leung et al., 2007). Similar tools may prove beneficial toward our understanding of RAs gene regulatory role during eye development and explaining the causes of microphthalmia, alterations in dorsal/ventral patterning, and other eye and visual defects.
Acknowledgments
The authors thank Drs. Yong Li, Farida Emran, Jonathan Matsui, and Jian Liu for constructive discussions; Dr. Elwood Linney for the RGYn transgenics, and Joseph Stujenske for assistance with the electrophysiology. This work was supported by The Harvard College Research Program (HGL) and the National Institutes of Health EY000811 (JED) and T32-EY07145(DJC).
References
- Adler R, Canto-Soler MV. Molecular mechanisms of optic vesicle development: complexities, ambiguities and controversies. Dev Biol. 2007;305:1–13. doi: 10.1016/j.ydbio.2007.01.045. [DOI] [PMC free article] [PubMed] [Google Scholar]
- Biehlmaier O, Lampert JM, von Lintig J, Kohler K. Photoreceptor morphology is severely affected in the beta, beta-carotene-15,15′-oxygenase (bcox) zebrafish morphant. European Journal of Neuroscience. 2005a;21:59–68. doi: 10.1111/j.1460-9568.2004.03830.x. [DOI] [PubMed] [Google Scholar]
- Biehlmaier O, Lampert JM, von Lintig J, Kohler K. Photoreceptor morphology is severely affected in the beta, beta-carotene-15,15 ′-oxygenase (bcox) zebrafish morphant. European Journal of Neuroscience. 2005b;21:59–68. doi: 10.1111/j.1460-9568.2004.03830.x. [DOI] [PubMed] [Google Scholar]
- Brockerhoff SE, Hurley JB, Janssen-Bienhold U, Neuhauss SC, Driever W, Dowling JE. A behavioral screen for isolating zebrafish mutants with visual system defects. Proc Natl Acad Sci U S A. 1995;92:10545–10549. doi: 10.1073/pnas.92.23.10545. [DOI] [PMC free article] [PubMed] [Google Scholar]
- Brown D, Cox A. Innovative Uses of Video Analysis. The Physic Teacher. 2009;47:145–150. [Google Scholar]
- Cameron DA, Gentile KL, Middleton FA, Yurco P. Gene expression profiles of intact and regenerating zebrafish retina. Mol Vis. 2005;11:775–791. [PubMed] [Google Scholar]
- Cameron DJ, Dowling JE. Temporal Elimination of Retinoic Acid Signaling Alters Eye Development in Zebrafish. ARVO Meeting Abstracts; April 11, 2009; Ft. Lauderdale, FL. 2009. p. 4002. [Google Scholar]
- Cepko CL, Austin CP, Yang X, Alexiades M, Ezzeddine D. Cell fate determination in the vertebrate retina. Proc Natl Acad Sci U S A. 1996;93:589–595. doi: 10.1073/pnas.93.2.589. [DOI] [PMC free article] [PubMed] [Google Scholar]
- Dowling JE. The Retina: An Approachable Part of the brain, Revised Edition. Belknap press of Harvard University press; Cambridge, MA: 2012. [Google Scholar]
- Duester G. Keeping an eye on retinoic acid signaling during eye development. Chem Biol Interact. 2008a doi: 10.1016/j.cbi.2008.09.004. [DOI] [PMC free article] [PubMed] [Google Scholar]
- Duester G. Retinoic acid synthesis and signaling during early organogenesis. Cell. 2008b;134:921–931. doi: 10.1016/j.cell.2008.09.002. [DOI] [PMC free article] [PubMed] [Google Scholar]
- Emran F, Rihel J, Adolph AR, Wong KY, Kraves S, Dowling JE. OFF ganglion cells cannot drive the optokinetic reflex in zebrafish. Proc Natl Acad Sci U S A. 2007;104:19126–19131. doi: 10.1073/pnas.0709337104. [DOI] [PMC free article] [PubMed] [Google Scholar]
- Golzio C, Martinovic-Bouriel J, Thomas S, Mougou-Zrelli S, Grattagliano-Bessieres B, Bonniere M, Delahaye S, Munnich A, Encha-Razavi F, Lyonnet S, Vekemans M, Attie-Bitach T, Etchevers HC. Matthew-Wood syndrome is caused by truncating mutations in the retinol-binding protein receptor gene STRA6. Am J Hum Genet. 2007;80:1179–1187. doi: 10.1086/518177. [DOI] [PMC free article] [PubMed] [Google Scholar]
- Higashijima S, Okamoto H, Ueno N, Hotta Y, Eguchi G. High-frequency generation of transgenic zebrafish which reliably express GFP in whole muscles or the whole body by using promoters of zebrafish origin. Dev Biol. 1997;192:289–299. doi: 10.1006/dbio.1997.8779. [DOI] [PubMed] [Google Scholar]
- Hogben L, Slome D. The pigmentary effector system. VI. The dual character of endocrine co-ordination in amphibian color change. Proc R Soc Lond B Biol Sci. 1931;108:10–53. [Google Scholar]
- Huang YY, Neuhauss SC. The optokinetic response in zebrafish and its applications. Front Biosci. 2008;13:1899–1916. doi: 10.2741/2810. [DOI] [PubMed] [Google Scholar]
- Hyatt GA, Schmitt EA, Fadool JM, Dowling JE. Retinoic acid alters photoreceptor development in vivo. Proc Natl Acad Sci U S A. 1996;93:13298–13303. doi: 10.1073/pnas.93.23.13298. [DOI] [PMC free article] [PubMed] [Google Scholar]
- Hyatt GA, Schmitt EA, Marsh-Armstrong NR, Dowling JE. Retinoic acid-induced duplication of the zebrafish retina. Proc Natl Acad Sci U S A. 1992;89:8293–8297. doi: 10.1073/pnas.89.17.8293. [DOI] [PMC free article] [PubMed] [Google Scholar]
- Isken A, Golczak M, Oberhauser V, Hunzelmann S, Driever W, Imanishi Y, Palczewski K, von Lintig J. RBP4 disrupts vitamin A uptake homeostasis in a STRA6-deficient animal model for Matthew-Wood syndrome. Cell Metab. 2008;7:258–268. doi: 10.1016/j.cmet.2008.01.009. [DOI] [PMC free article] [PubMed] [Google Scholar]
- Khanna H, Akimoto M, Siffroi-Fernandez S, Friedman JS, Hicks D, Swaroop A. Retinoic acid regulates the expression of photoreceptor transcription factor NRL. J Biol Chem. 2006;281:27327–27334. doi: 10.1074/jbc.M605500200. [DOI] [PMC free article] [PubMed] [Google Scholar]
- Kumar S, Sandell LL, Trainor PA, Koentgen F, Duester G. Alcohol and aldehyde dehydrogenases: Retinoid metabolic effects in mouse knockout models. Biochim Biophys Acta. 2012;1821:198–205. doi: 10.1016/j.bbalip.2011.04.004. [DOI] [PMC free article] [PubMed] [Google Scholar]
- Leung YF, Dowling JE. Gene expression profiling of zebrafish embryonic retina. Zebrafish. 2005;2:269–283. doi: 10.1089/zeb.2005.2.269. [DOI] [PubMed] [Google Scholar]
- Leung YF, Ma P, Dowling JE. Gene expression profiling of zebrafish embryonic retinal pigment epithelium in vivo. Invest Ophthalmol Vis Sci. 2007;48:881–890. doi: 10.1167/iovs.06-0723. [DOI] [PMC free article] [PubMed] [Google Scholar]
- Mahmoud MI, Potter JJ, Colvin OM, Hilton J, Mezey E. Effect of 4- (diethylamino)benzaldehyde on ethanol metabolism in mice. Alcohol Clin Exp Res. 1993;17:1223–1227. doi: 10.1111/j.1530-0277.1993.tb05233.x. [DOI] [PubMed] [Google Scholar]
- Mark M, Ghyselinck NB, Chambon P. Function of retinoid nuclear receptors: lessons from genetic and pharmacological dissections of the retinoic acid signaling pathway during mouse embryogenesis. Annu Rev Pharmacol Toxicol. 2006;46:451–480. doi: 10.1146/annurev.pharmtox.46.120604.141156. [DOI] [PubMed] [Google Scholar]
- Marsh-Armstrong N, McCaffery P, Gilbert W, Dowling JE, Drager UC. Retinoic acid is necessary for development of the ventral retina in zebrafish. Proc Natl Acad Sci U S A. 1994;91:7286–7290. doi: 10.1073/pnas.91.15.7286. [DOI] [PMC free article] [PubMed] [Google Scholar]
- Molotkov A, Molotkova N, Duester G. Retinoic acid guides eye morphogenetic movements via paracrine signaling but is unnecessary for retinal dorsoventral patterning. Development. 2006;133:1901–1910. doi: 10.1242/dev.02328. [DOI] [PMC free article] [PubMed] [Google Scholar]
- Muto A, Orger MB, Wehman AM, Smear MC, Kay JN, Page-McCaw PS, Gahtan E, Xiao T, Nevin LM, Gosse NJ, Staub W, Finger-Baier K, Baier H. Forward genetic analysis of visual behavior in zebrafish. PLoS Genet. 2005;1:e66. doi: 10.1371/journal.pgen.0010066. [DOI] [PMC free article] [PubMed] [Google Scholar]
- Neuhauss SC, Biehlmaier O, Seeliger MW, Das T, Kohler K, Harris WA, Baier H. Genetic disorders of vision revealed by a behavioral screen of 400 essential loci in zebrafish. J Neurosci. 1999;19:8603–8615. doi: 10.1523/JNEUROSCI.19-19-08603.1999. [DOI] [PMC free article] [PubMed] [Google Scholar]
- Pasutto F, Sticht H, Hammersen G, Gillessen-Kaesbach G, Fitzpatrick DR, Nurnberg G, Brasch F, Schirmer-Zimmermann H, Tolmie JL, Chitayat D, Houge G, Fernandez-Martinez L, Keating S, Mortier G, Hennekam RC, von der Wense A, Slavotinek A, Meinecke P, Bitoun P, Becker C, Nurnberg P, Reis A, Rauch A. Mutations in STRA6 cause a broad spectrum of malformations including anophthalmia, congenital heart defects, diaphragmatic hernia, alveolar capillary dysplasia, lung hypoplasia, and mental retardation. Am J Hum Genet. 2007;80:550–560. doi: 10.1086/512203. [DOI] [PMC free article] [PubMed] [Google Scholar]
- Perz-Edwards A, Hardison NL, Linney E. Retinoic acid-mediated gene expression in transgenic reporter zebrafish. Dev Biol. 2001;229:89–101. doi: 10.1006/dbio.2000.9979. [DOI] [PubMed] [Google Scholar]
- Prabhudesai SN, Cameron DA, Stenkamp DL. Targeted effects of retinoic acid signaling upon photoreceptor development in zebrafish. Dev Biol. 2005;287:157–167. doi: 10.1016/j.ydbio.2005.08.045. [DOI] [PMC free article] [PubMed] [Google Scholar]
- Roeser T, Baier H. Visuomotor behaviors in larval zebrafish after GFP-guided laser ablation of the optic tectum. J Neurosci. 2003;23:3726–3734. doi: 10.1523/JNEUROSCI.23-09-03726.2003. [DOI] [PMC free article] [PubMed] [Google Scholar]
- Ross SA, McCaffery PJ, Drager UC, De Luca LM. Retinoids in embryonal development. Physiol Rev. 2000;80:1021–1054. doi: 10.1152/physrev.2000.80.3.1021. [DOI] [PubMed] [Google Scholar]
- Russo JE, Hauguitz D, Hilton J. Inhibition of mouse cytosolic aldehyde dehydrogenase by 4-(diethylamino)benzaldehyde. Biochem Pharmacol. 1988;37:1639–1642. doi: 10.1016/0006-2952(88)90030-5. [DOI] [PubMed] [Google Scholar]
- Sen J, Harpavat S, Peters MA, Cepko CL. Retinoic acid regulates the expression of dorsoventral topographic guidance molecules in the chick retina. Development. 2005;132:5147–5159. doi: 10.1242/dev.02100. [DOI] [PubMed] [Google Scholar]
- Sieving PA, Murayama K, Naarendorp F. Push-pull model of the primate photopic electroretinogram: a role for hyperpolarizing neurons in shaping the b-wave. Vis Neurosci. 1994;11:519–532. doi: 10.1017/s0952523800002431. [DOI] [PubMed] [Google Scholar]
- Steinberg RH, Fisher SK, Anderson DH. Disc morphogenesis in vertebrate photoreceptors. J Comp Neurol. 1980;190:501–508. doi: 10.1002/cne.901900307. [DOI] [PubMed] [Google Scholar]
- Stujenske JM, Dowling JE, Emran F. The bugeye mutant zebrafish exhibits visual deficits that arise with the onset of an enlarged eye phenotype. Invest Ophthalmol Vis Sci. 2011;52:4200–4207. doi: 10.1167/iovs.10-6434. [DOI] [PMC free article] [PubMed] [Google Scholar]
- von Frisch K. BeiträgezurPhysiologie der Pigmentzellen in der Fischhaut. Pflügers Arch. 1911;138:319–387. [Google Scholar]
- Wehman AM, Staub W, Meyers JR, Raymond PA, Baier H. Genetic dissection of the zebrafish retinal stem-cell compartment. Dev Biol. 2005;281:53–65. doi: 10.1016/j.ydbio.2005.02.010. [DOI] [PubMed] [Google Scholar]
- Westerfield M. The zebrafish book: a guide for the laboratory use of zebrafish (Danio rerio) Eugene: University of Oregon Press; 2000. [Google Scholar]
- White T, Lu T, Metlapally R, Katowitz J, Kherani F, Wang TY, Tran-Viet KN, Young TL. Identification of STRA6 and SKI sequence variants in patients with anophthalmia/microphthalmia. Mol Vis. 2008;14:2458–2465. [PMC free article] [PubMed] [Google Scholar]
- Wilson JG, Roth CB, Warkany J. An analysis of the syndrome of malformations induced by maternal vitamin A deficiency. Effects of restoration of vitamin A at various times during gestation. Am J Anat. 1953;92:189–217. doi: 10.1002/aja.1000920202. [DOI] [PubMed] [Google Scholar]
- Zhang C, Song Y, Thompson DA, Madonna MA, Millhauser GL, Toro S, Varga Z, Westerfield M, Gamse J, Chen W, Cone RD. Pineal-specific agouti protein regulates teleost background adaptation. Proc Natl Acad Sci U S A. 2010;107:20164–20171. doi: 10.1073/pnas.1014941107. [DOI] [PMC free article] [PubMed] [Google Scholar]