Abstract
Atomic partial charges for use in traditional force fields for biomolecular simulation are often fit to the electrostatic potentials of small molecules and, hence, neglect large-scale electronic polarization. On the other hand, recent advances in atoms-in-molecule charge derivation schemes show promise for use in flexible force fields but are limited in size by the underlying quantum mechanical calculation of the electron density. Here, we implement the density derived electrostatic and chemical charges method in the linear-scaling density functional theory code ONETEP. Our implementation allows the straightforward derivation of partial atomic charges for systems comprising thousands of atoms, including entire proteins. We demonstrate that the derived charges are chemically intuitive, reproduce ab initio electrostatic potentials of proteins and are transferable between closely related systems. Simulated NMR data derived from molecular dynamics of three proteins using force fields based on the ONETEP charges are in good agreement with experiment.
1. Introduction
Proteins are essential components of all organisms, carrying out tasks defined by the information encoded within genes, for example catalyzing biochemical reactions, mediating cell signaling, or providing structural rigidity. Computation plays an important role in the study of proteins—simulations range from elucidation of enzymatic reaction mechanisms, to the study of folding pathways, to design of therapeutic molecules against disease.1 In biomolecular simulations such as these, molecular mechanics (MM) force fields are often used in which electrostatic interactions are described by atom-centered point charges. However, there is no unique method for partitioning the rigorously calculated quantum mechanical (QM) electron density among the individual atoms and different charge derivation schemes often lead to very different results.
In commonly used force fields such as AMBER,2 the MM partial charges of protein molecules are optimized by fitting them to reproduce the QM electrostatic potential (ESP) of small molecules.3,4 These ESP charges are well-suited for MM force fields, as they reproduce ab initio multipole moments and electrostatic interactions between molecular fragments.5 A disadvantage of such techniques is the neglect of polarization by the environment—indeed, a recent density functional theory (DFT) natural population analysis of an entire protein in water found that net charges of residues can vary by up to 0.5 e from their putative integer values.6 While mean field approaches for charge fitting are the most appropriate for deriving transferable force field parameters, often, as in the example of the study of protein–ligand binding, we are only interested in sampling in the vicinity of the protein’s native state. In these cases, it would be ideal to incorporate electrostatic polarization that is specific to that native state into the charge fitting procedure.
Recent studies have calculated atom-centered charges for entire proteins, accounting for native state polarization by including background point charges in a series of iterative fragment-based ESP fits. The resulting polarized protein-specific charges perform better than standard AMBER charges in determining free energies of ligand binding,7 in pKa calculations,8 and in comparisons with NMR data.9,10 These results point to the potential improvements that can be made by using polarized protein-specific point charges. However, such an approach potentially requires a large number of QM calculations to iterate all charges in the system to self-consistency8 and requires restraints11 or conformational averaging12,13 to treat buried atoms and to address the sensitivity of the charges to small conformational changes.
An ideal charge derivation scheme should efficiently account for the surrounding environment, while the resulting charges should be chemically intuitive, reproduce ab initio electrostatic properties, be robust with respect to conformational changes, and be insensitive to buried atoms.14 The charges should be derived from first principles, with no empirical parameters, applicable to a wide range of systems without requiring specialized treatments based on specific chemical knowledge of a particular molecule, and preferably computable from a single QM calculation of the whole system. Recently, there has been renewed interest in electronic density-based atoms-in-molecule (AIM) charge partitioning based on the Hirshfeld approach.15−18 Such methods differ conceptually from ESP in that the net atomic charges are assigned by dividing a converged, QM electronic density into a union of overlapping atomic basins. The density derived electrostatic and chemical charges (DDEC) method, developed by Manz and Sholl,18 combines two AIM approaches, iterative Hirshfeld (IH) and iterated stockholder atoms (ISA), to assign atomic charges from the electron density. The resulting charges have already been shown to be suitable for force field development.19 The charges are chemically intuitive and insensitive to small conformational changes. They adapt to the atom’s environment, reproduce the ab initio electrostatic potential, and, where applicable, correlate well with X-ray diffraction and X-ray absorption near-edge spectroscopy data.19,20 The method can be applied with no adjustable parameters to buried atoms and to either periodic or nonperiodic systems. DDEC charges have already been used to develop force fields for molecular adsorption inside metal–organic frameworks.21,22 The DDEC method is implemented in a freely available code (http://ddec.sourceforge.net/), which is interfaced with codes such as VASP and Gaussian among others.
Thus, DDEC charges are suitable for environment-specific, flexible force field development for biomolecular simulations but are limited by the unfavorable computational scaling of the underlying QM calculation to systems of a few hundred atoms. In this paper, we overcome this limitation by implementing the DDEC scheme in the ONETEP linear-scaling DFT code. ONETEP combines high basis set accuracy, comparable to that of plane-wave DFT methods, with a computational cost that scales linearly with the number of atoms, which allows for an accurate, fully QM description of systems of thousands of atoms,23,24 including entire proteins.25−27 We begin by outlining the various underlying AIM schemes, followed by a brief description of the linear-scaling DFT code ONETEP. We validate our internal implementation of the DDEC methodology against quantum chemistry calculations in Gaussian0928 for a benchmark set of 25 representative small molecules and show that charges are derived with linear-scaling computational cost, allowing analysis of proteins comprising thousands of atoms from a single DFT calculation. We demonstrate that, for these large systems, the features of the DDEC scheme that make the charges desirable for flexible force field development are maintained. Namely, the charges (i) respond to their environment in a chemically intuitive manner; (ii) reproduce electrostatic properties of the DFT calculation; and (iii) are not overly sensitive to small conformational changes or the presence of buried atoms. Finally, we construct a MM force field based on the DDEC charges for three proteins and compare the results of our MM simulations with experimentally measured NMR dynamic observables and a standard biomolecular force field.
2. Computational Methodology
2.1. Density Derived Electrostatic and Chemical Charges
The DDEC method is based upon two recently developed extensions to the original Hirshfeld AIM scheme.15 In the original formulation, an electronic density n(r) is divided into overlapping atomic basins nA(r) for each atom A according to the weighting formula:
| 1 |
where nA0(r) is the atomic reference density, whose overlapping sum over all atoms in the system ∑BnB(r) is termed the promolecular density. This form of stockholder partitioning, where the electronic density at each point r is distributed based on the proportional contribution from the reference densities of each atom at that point, has been shown to minimize the information distance FAIM (Kullback–Liebler entropy) between the real and promolecular density,29 maximizing the information retained in the reference atomic states nA0(r) when transferring to the molecular environment:
| 2 |
subject to the constraint that ∑AnA(r) = n(r); that is, the electronic density is completely partitioned. In other words, the stockholder partitioning exhaustively divides the real electronic density into a set of overlapping atomic densities nA(r) in such a way as to maximize the density distribution similarity to their respective reference density counterparts nA0(r).
Shortcomings of the original Hirshfeld method included an arbitrariness in the choice of reference atomic densities nA0(r). Neutral, gas-phase atomic densities were often chosen as references, although these commonly led to atomic populations that were too close to zero.17 Such problems are addressed in recently proposed iterative extensions to the Hirshfeld method,16,17 in which reference densities are successively improved until self-consistency is achieved. In the iterative Hirshfeld (IH) scheme proposed by Bultinck et al.,17 the IH reference densities nA(i,r) are derived from the partitioned atomic density at iteration i, nA(i,r), by the following procedure. First, the (noninteger) electronic populations of each atom QA(i) are computed in the usual way from the partitioned atomic densities:
| 3 |
Instead of choosing neutral reference states as in the original Hirshfeld method, new reference states are generated by linear interpolation between densities of free atoms or ions with the next lowest integer (τ = lint(QA(i)) and the next highest integer (τ + 1) number of electrons:
| 4 |
The purpose of the interpolation is to obtain a suitable gas-phase reference density for a hypothetical ion comprising QA(i) electrons. The partitioned atomic densities for the next iteration i + 1 are then derived from the reference states generated at iteration i:
| 5 |
The procedure is iterated until the changes in the set of IH charges fall below a specified threshold. The resulting charges have been shown to reproduce ab initio electrostatic properties of small polypeptides and to be relatively insensitive to small conformational changes.14
An alternative approach by Lillestolen and Wheatley,16 meanwhile, named iterated stockholder atoms (ISA), takes the spherical average of the partitioned atomic density nA(i,r) at iteration i as the (ISA) reference density that enters into eq 5, where ⟨···⟩A denotes spherical averaging about the center of atom A:
| 6 |
In practice, the averaging is performed on a set of discrete radial shells up to a maximum radius rmax. The ISA scheme is argued to be less empirical than IH, as the latter still relies on a library of externally generated ionic densities. ISA also produces a better fit to the ESP due to the low-order multipoles possessed by the converged nA(r) resulting from the spherical-averaging procedure used to generate the reference densities.18
The DDEC scheme by Manz and Sholl18,19 combines the IH and ISA methods by minimizing a combined information entropy functional (eq 2):
| 7 |
where FIH/ISA are constructed with IH/ISA reference densities and weighted by an adjustable parameter χ. Minimizing eq 7 with respect to nA(r) with the same constraint as eq 2 leads to a partitioning of the form:
| 8 |
where nAIH/ISA(i,r) are the respective reference densities given by eqs 4 and 6. By allowing a fraction of FIH to contribute toward curvature in regions that otherwise have shallow optimization landscapes, for example, buried atoms, this technique alleviates the slow convergence of the ISA method for such regions while retaining the appealing attributes of the ISA scheme. An important addition to the DDEC scheme is the employment of charge-compensated reference IH densities, referred to as the DDEC/c2 scheme.18 These densities are generated from DFT ground-state ionic calculations in the presence of a charge compensation sphere, akin to a conductor-like polarizable continuum model (CPCM) treatment with a solvent of infinite dielectric constant.18 The justification for using such compensated densities instead of free ionic states, as in the original IH scheme, stems from the dielectric screening experienced by an ion embedded within a molecule, whereby its density profile can be modified by the effective dielectric constant. The charge compensation sphere acts to expand (contract) the reference density in the case of cations (anions).
2.2. ONETEP
ONETEP30 is a linear-scaling DFT package based on a reformulation of conventional Kohn–Sham DFT in terms of the single-particle density matrix:
| 9 |
where {ϕα(r)}
are nonorthogonal generalized Wannier functions (NGWFs) that are
localized in real space,31 and Kαβ is a representation of the density
matrix in the biorthogonal duals of the NGWFs. ONETEP achieves linear-scaling
by exploiting the “nearsightedness” of the single-particle
density matrix in nonmetallic systems.32 In practice, linear-scaling arises from enforcing strict localization
of the NGWFs onto atomic regions and through the optimization of the
density kernel and NGWFs, subject to localization constraints. Optimizing
the NGWFs in situ allows for a minimal number of
atom-centered orbitals to be used while maintaining plane-wave accuracy.
The NGWFs are represented in a basis of highly localized periodic
cardinal sine (psinc) functions (otherwise known as Fourier–Lagrange
mesh functions).33 The psinc functions
are related to plane waves via a Fourier transform, meaning that systematic
improvement is possible through adjustment of the psinc grid spacing,
analogous to converging the kinetic energy cutoff in traditional  (N3) plane-wave
DFT codes. In order to expedite optimization, the NGWFs can be initialized
closer to their ground states by using an in-built pseudoatomic solver,
which self-consistently solves the DFT Kohn–Sham equations
for isolated atoms using the same pseudopotentials and exchange-correlation
functional as the full calculation.34 Implicit
solvation, whose inclusion is essential both for an accurate description
of the protein’s aqueous environment and to aid optimization
of the density kernel,35 is implemented
within ONETEP. This is a minimal parameter, self-consistent model
based on direct solution of the inhomogeneous Poisson equation for
a solute cavity defined by the isosurface of the electron density.36,37
2.3. DDEC Implementation in ONETEP
We have implemented the DDEC method18,19 within ONETEP as a postprocessing module to take advantage of its parallel and efficient algorithms for sparse matrix algebra and operations with localized orbitals and electron distributions. A single DFT calculation is performed on the system to obtain the ground-state electronic density, which is then processed to extract the DDEC net atomic charges. Reference densities for the IH part of the calculation are generated internally at run time using the same exchange-correlation functional, pseudopotentials, and NGWF cutoff radius as the full DFT calculation, with the c2 charge compensation scheme.18 Specifically, using the pseudoatomic solver module,34 as described in section 2.2, the Kohn–Sham equations for a set of atomic orbitals of an isolated atom are solved self-consistently on a radial grid with an additional spherical surface of compensation charge.18 The effect of this charged surface is expressed equivalently via Gauss’ Law as an additional radial electrostatic potential term Vcomp in the Hamiltonian:
| 10 |
where the first three operators are the kinetic energy, local and nonlocal potentials, and Vcomp = Qcomp/|r| for |r| > Rcomp, with Qcomp and Rcomp the charge and radius of the compensation sphere.
Following Manz and Sholl,18 for cations, the magnitude of the compensation charge (Qcomp) is chosen to neutralize the ion, with the compensation sphere radius (Rcomp) set to the average of ⟨ψnlm|r̂|ψnlm⟩ expectation values of all occupied orbitals {|ψnlm⟩} in the neutral species that are vacant in the cation. For anions, the compensation charge is chosen to make the electrostatic potential at an infinitesimal distance outside the compensation sphere zero. The radius of the compensation sphere is incrementally adjusted in 0.1 Bohr steps until the total energy of the system is minimized.
Whole-molecule densities (total and promolecular) are stored on regular Cartesian grids, while spherically averaged promolecular density profiles for individual atoms are computed and stored on atom-centered sets of equally spaced radial shells up to a predefined maximum cutoff radius. Linear-scaling computation with respect to the number of atoms (for each iteration) is achieved at a modest cost of computational memory by computing and storing the total promolecular density (∑BnB0(i,r)) once per DDEC iteration, on the same grid as the molecular density. Figure 1a shows the computational scaling of our DDEC implementation for periodic supercells of bulk water of increasing size, up to around 2500 atoms (Supporting Information). Even for the largest system, the computation time of the DDEC analysis is under 20 min. The DFT calculation itself requires around 12 h on 160 cores, making the calculation of DDEC charges for systems comprising thousands of atoms feasible on a near-routine basis.
Figure 1.
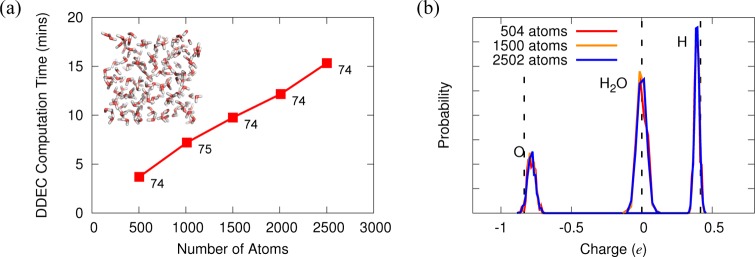
(a) Computation time required for DDEC postprocessing calculations of bulk water. Simulations were executed on 160 Intel Sandy Bridge cores. Numbers beside points indicate the number of DDEC iterations required for convergence. (b) DDEC atomic and molecular charge distributions of bulk water for three system sizes. Vertical dashed lines indicate MM TIP3P water charges.
Importantly, the number of iterations required for charge convergence remains virtually constant for increasing numbers of atoms, ensuring that the total computational effort remains linear-scaling with respect to system size. Figure 1b reveals that the distribution of charges obtained for bulk water is independent of system size. The atomic charges distributions are centered on values close to those typically used in MM force fields (TIP3P),38 while they show some spread as one might expect for atoms in a liquid with differing local environments.
Recently, Manz and Sholl introduced an update to the DDEC method, named DDEC/c3.19 The DDEC/c3 method improves convergence of charges for nonporous solids with short bond lengths between diffuse atoms by enforcing exponential decay of atomic electron densities and conditioning the reference IH densities nAIH(i,r) that enter eq 8 to the material of interest. In our implementation, we use the conditioned reference densities but do not enforce radial decay of the partitioned atomic densities nA(r). Our reasoning is that our studies are aimed at biomolecular systems, which are porous materials lacking compacted regions, and we anticipate that the partial weighting by IH reference densities during optimization will be sufficient to ensure the stability of atomic charges for embedded atoms. In addition, in our implementation, core charge handling has been completely excluded, as we employ norm-conserving pseudopotentials. Literature studies have found little dependence of IH charges on the treatment of core electrons.39 Nevertheless, in the following section, we test both of these assumptions by validating ONETEP-calculated DDEC charges against the full DDEC/c3 method employing the all-electron code Gaussian09.28
2.4. Validation
The validity of our DDEC implementation was tested using a set of 25 diverse, neutral, small, organic molecules.40 Benchmarking was performed against the standard DDEC method as implemented in the CHARGEMOL package (version 2.1 beta, obtained from http://ddec.sourceforge.net/), employing 100 radial shells (NRad) up to a maximum cutoff radius (rmax) of 5 Å, together with the supplied c3 charge-compensated reference density library (DDEC/CHARGEMOL).18,19 Molecular geometries were optimized in vacuo with a 6-311G(d,p) basis set, and electronic densities were generated with an aug-cc-pVQZ all-electron basis set in Gaussian09.28 The PBE exchange-correlation functional41 was used throughout. For all DDEC analysis, the mixing parameter χ was set to 3/14, which has been shown to give the optimal balance between minimizing the atomic multipoles and maximizing chemical accuracy.19 The set of net atomic charges was considered converged when the maximum absolute change for any atom for three successive iterations was less than 2 × 10⁻⁵e.
ONETEP calculations were performed in vacuum using a cubic simulation cell of 30 Å, with the spherical cutoff Coulomb approach to avoid electrostatic interactions between molecules and their periodic images.42 Interactions between electrons and nuclei were described by norm-conserving pseudopotentials. NGWFs were initialized as orbitals obtained from solving the Kohn–Sham equation for free atoms,34 with a 1s configuration for H, a 2s2p configuration for C, N, O, and F, and a 3s3p configuration for S and Cl. The NGWFs were expanded in a psinc basis with an energy cutoff of 1000 eV, corresponding to a grid spacing of 0.45 Bohr, and were localized in real space with radii of 10 Bohr. Convergence of the atomic charges generated by our implementation of the DDEC method in ONETEP (referred to as DDEC/ONETEP) with respect to the ONETEP psinc grid spacing and NGWF cutoff radii, as well as the DDEC parameters rmax and NRad was investigated for nitroethane and discussed in Supporting Information Figure S1.
Figure 2 shows the correlation between the DDEC/ONETEP and DDEC/CHARGEMOL charges for every atom in the benchmark set. Despite the different approaches used in obtaining the ground-state electronic densities and the subsequent charge analysis, the difference between the two charge sets is very small with a mean absolute deviation (MAD) of less than 0.02 e.
Figure 2.
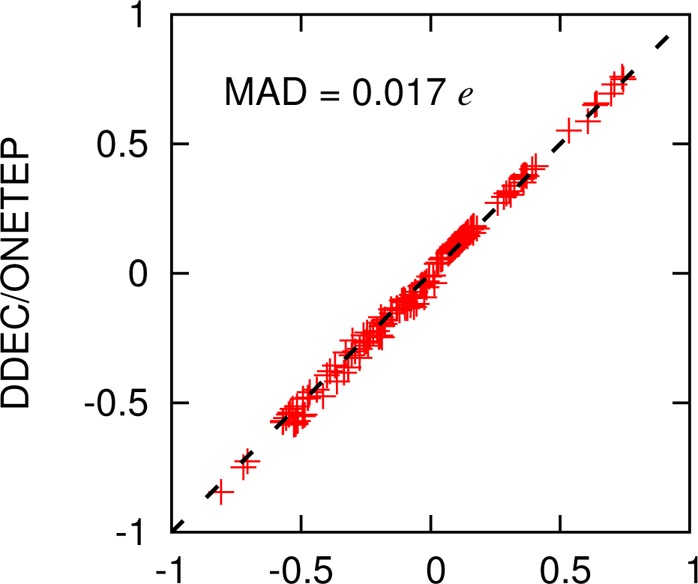
Correlation between DDEC/CHARGEMOL and DDEC/ONETEP charges for all atoms in the 25 molecule benchmark set. Also shown is the mean absolute deviation (MAD) between the two sets.
Atomic charges for use in force fields should approximately reproduce the ab initio electrostatic potential outside the molecule’s electron density. We can measure the error ΔV in the Coulombic potential of the DDEC charges, compared with DFT, as19
 |
11 |
where the sum is performed for all points i lying within 1.4 and 2.0 times the van der Waals radii of the nuclei,43 on the same grid mesh used to calculate the electron density. In order to remove the arbitrary vacuum level of the DFT potential VDFT(r), the potentials are displaced by the averaged difference over the included grid points. Our calculations of ΔV are performed for a test charge of 1 e in vacuum. Typical errors in, for example, interaction energies of neutral ligands with proteins in solution will tend to be lower than this error estimate.12 Nevertheless, it is a good indicator of the ability of a method to reproduce the ab initio ESP.
Figure 3 (bottom) shows that DDEC charges reliably reproduce the electrostatic potential around the molecule, with ΔV errors of approximately 1 kcal/mol for both DDEC/CHARGEMOL and DDEC/ONETEP. For neutral molecules, the dipole is the leading order term in the multipole expansion and, thus, is the most significant in determining intermolecular electrostatic interactions. In Figure 3 (top), we compare the DDEC vector dipole moments with those computed directly from their respective ab initio electronic densities. Again, ONETEP performs as well as CHARGEMOL. For comparison, we have also plotted the error in the dipole moment and ΔV (eq 11) for ESP charges. In agreement with previous charge comparisons,14,18,44 the ESP charges reproduce the ab initio electrostatic potential and dipole moment more closely. Despite this better performance of ESP charges for small molecule electrostatics, DDEC charges will be suitable for polarized protein-specific charges if, as we shall investigate in the next section, they are able to reproduce the electrostatic properties of much larger molecules containing buried atoms better than standard MM force fields.
Figure 3.
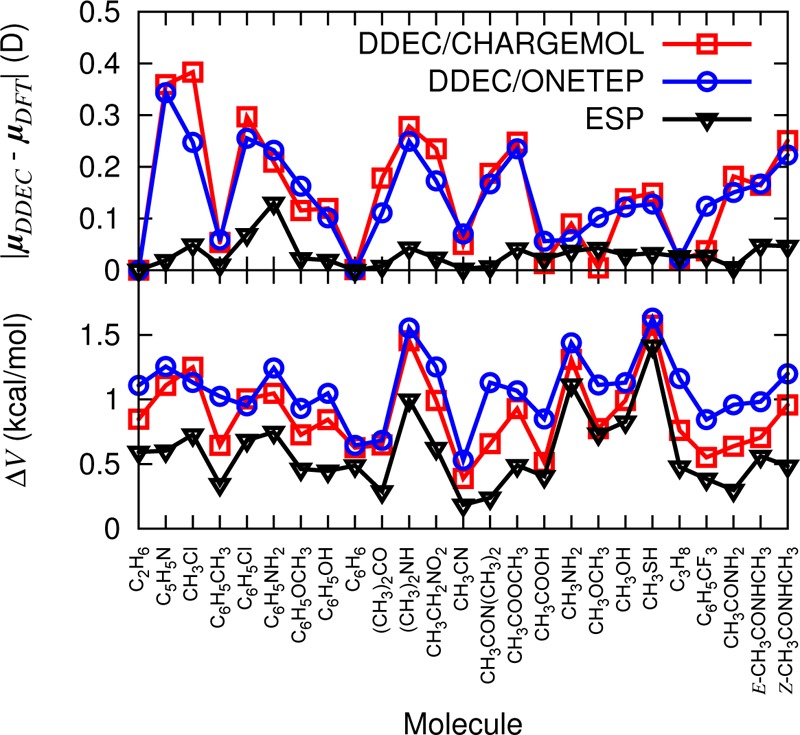
(top) Errors in the DDEC dipole moment vectors, |μDDEC – μDFT|, compared to ab initio dipole moments. (bottom) ΔV for the 25 molecule set. ESP refers to results from Merz–Kollman charges (calculated with Gaussian09).
We conclude that, at least for organic systems comprising light atoms, our use of DDEC charge analysis within the pseudopotential approximation and without enforcing radial decay of the partitioned atomic densities is valid. It should be emphasized that the DDEC analysis can only be as accurate as the electron density output by the underlying QM calculation. In the current paper, we have used the PBE exchange-correlation functional in our ONETEP calculations, although future advances will allow alternative treatments of electron–electron interactions, such as B3LYP45 and dynamical mean field theory.46 For comparison, Supporting Information Figure S2 compares Gaussian09 DDEC charges calculated using PBE and B3LYP exchange-correlation functionals. The MAD is less than 0.02 e, implying that the PBE functional gives a reliable electron density for the calculation of DDEC charges.
3. Properties of DDEC Charges
3.1. DDEC Charges Respond to their Environment
In order to aid in the interpretation of QM simulations, atomic point charges should respond in a chemically intuitive manner to their environment. As an example, Figure 4, b and c, shows ONETEP/DDEC charges for the phenol molecule in two different environments: first in water and, second, in a small model cluster representing the negatively charged binding pocket of the L99A/M102E mutant of T4 lysozyme47 (Supporting Information). The two environments are typical of those simulated in, for example, the optimization of small molecule inhibitors for drug design.1 For comparison, Figure 4a shows the RESP charges for phenol, calculated in vacuum at the HF/6-31G* level to approximate aqueous polarization,5 the same level of theory that has been used to parametrize the AMBER force field4 that we employ as a benchmark in later sections. The DDEC charges in water agree with the RESP charges with a root-mean-square (RMS) deviation of 0.04 e. Similar results are obtained by comparing with RESP charges derived using a polarizable continuum model (PCM) to model solvation (Supporting Information Figure S3). There are no large changes in the DDEC charges of the phenol molecule on moving to the protein binding pocket. Charges on the aromatic ring change by up to 0.05 e in the more hydrophobic environment, while the −OH group, which is hydrogen-bonded to residue E102, becomes more strongly polarized.
Figure 4.

(a) RESP charges for phenol calculated in vacuo at the HF/6-31G* level. (b) DDEC/ONETEP charges calculated in a 20 molecule water cluster using with identical simulation parameters as Section 2.4. (c) Same as in part b, but within a 86 atom cluster representing the T4 lysozyme L99A/M102E binding pocket. Charges for parts b and c have been averaged over five different conformations. Standard error of the mean is less than 0.01 e for the −OH group, and the maximum on any atom is 0.018 e.
We have utilized the linear-scaling nature of our DDEC implementation to calculate DDEC charges of three proteins: ubiquitin, the SMN Tudor Domain, and hen egg lysozyme (PDB: 1UBQ, 1MHN, 6LYT). Initial structures were prepared by protonation using the AMBER11 tleap module2 or by the MOLPROBITY software.48 DFT calculations were performed using the minimal parameter continuum solvation model of ONETEP with a relative dielectric permittivity of 80 to represent water solvent.36 A postprocessing calculation was performed on the converged electronic density to extract DDEC charges (Supporting Information). It should be emphasized that the entire charge set is derived from a single DFT calculation, on systems up to 1960 atoms, and thus naturally incorporates native state polarization.
As we found for the small test systems, DDEC charges for the proteins are similar to the mean field AMBER ff99SB charges,49 with a correlation coefficient of 0.96 (Figure 5a). However, the RMS deviation between the charge sets is 0.11 e, as expected since the AIMs were optimized based on the ab initio electronic density for atoms embedded in their local environment. Comparisons with the AMBER ff033 force field charges yield similar conclusions (Supporting Information Figure S4). For chemically identical atoms that share the same charges in AMBER, the DDEC charges span a wider range, which is indicated by the vertical spread of points. For example, DDEC charges for backbone O atoms of leucine vary between −0.72 and −0.56 e, with an average of −0.63 e, compared to the constant AMBER value of −0.57 e. The prominent outliers in Figure 5a (with absolute charge disagreement larger than 0.25 e) are mostly nonbackbone sp3 carbon atoms, most of which are close to neutral in AMBER, but adopt a range of values in DDEC, depending on the residue type and their particular local environments. For example, the Cγ atom in glutamine has a charge of −0.06 e in AMBER, but ranges from −0.41 to −0.37 e in DDEC. Similar deviations in C charges from AMBER values have been observed in conformationally averaged ESP charges derived from dipeptide fragments.13 The largest discrepancy between the two charge sets is in the terminal nitrogen atom, which is positively charged in AMBER (0.16 e) but negatively charged in DDEC (−0.52 e). Several ESP studies3,13 have indicated that our DDEC value is more appropriate for the charge of the N-terminus.
Figure 5.
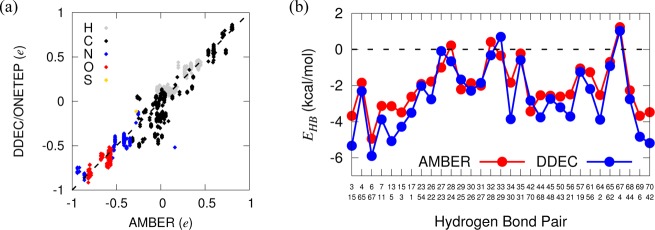
(a) Correlation between DDEC partial atomic charges and the AMBER ff99SB force field for ubiquitin. (b) Electrostatic contribution to the backbone hydrogen bond energies in the X-ray crystal structure of ubiquitin. The x-axis denotes the protein donor/acceptor residues involved. DDEC charges give slightly more negative hydrogen bond energies, indicating enhanced stabilization.
Of particular interest is the observation that the charges of backbone–backbone hydrogen bonds calculated by DDEC/ONETEP are more polarized than in the AMBER force field. Following Ji et al.,50 we define the electrostatic contribution to the hydrogen bond between backbone NH and CO groups as the Coulombic interaction between atoms carrying point charges q:
| 12 |
Figure 5b reveals that the resulting dipole–dipole interaction is stronger for DDEC charges than AMBER. It is possible that the enhancement of the interaction is a systematic bias in the potential of the DDEC charges, though it does support previous hypotheses that proteins are stabilized in their native environment via electronic polarization.10 We investigate this effect further in Section 4 by comparing the dynamics of backbone hydrogen bonds with experimental NMR observables.
3.2. DDEC Charges Reproduce Ab Initio Electrostatic Potentials
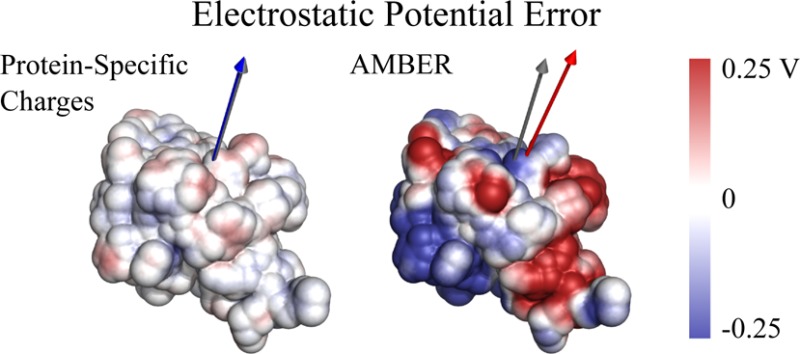
The correct treatment of electrostatics is vital in the accurate determination of molecular interactions in biological systems. In particular, if DDEC charges are to be useful as polarized protein-specific charges, they should reproduce ab initio electrostatics for large molecules better than standard force fields that are based on ESP charges. We have calculated the electrostatic potential and the dipole moments of the three proteins studied in the previous section with full DFT, the derived DDEC charges, and with a standard AMBER force field (Supporting Information Figure S4 gives the same information for the AMBER ff03 force field). For all charge distributions, the electrostatic potential was computed in vacuum, in order to better observe the discrepancy between ab initio and point charge values that would otherwise be dampened by dielectric screening. We note, however, that the ab initio, DDEC and AMBER charge distributions have already incorporated solvation effects in their calculation, and the electrostatic comparisons are, therefore, equivalent. Table 1 shows that DDEC/ONETEP AIMs reproduce the total ab initio potential and dipole moments μDFT for all three proteins, vastly outperforming the standard MM charges. Figure 6 shows the difference in electrostatic potential between the two charge sets and the DFT calculation. Although the standard MM charges are fit to closely reproduce the ESP of small molecules, they neglect large-scale electronic polarization that is present in protein-specific charges, and hence, the error in the computed ESP is large. The computed errors in the MM electrostatic potential are consistent with literature studies of errors in interaction energies between charged biotin ligands and the avidin protein in vacuum (11 kcal/mol on average).12 For more realistic simulations, the same study found that the error was reduced to approximately 2 kcal/mol for neutral ligands and to 0.7 kcal/mol if solvent screening is also included.
Table 1. RMS Error (ΔV) between the Ab Initio DFT Potential and Coulombic Point Charge Potentials Derived from DDEC/ONETEP and AMBER ff99SB Charges for Three Proteins Calculated using Equation 11a.
| ΔV (kcal/mol) |
|μDFT – μ| (D) |
||||
|---|---|---|---|---|---|
| protein | total charge (e) | DDEC/ONETEP | AMBER | DDEC/ONETEP | AMBER |
| 1UBQ | 0 | 1.30 | 7.56 | 2.2 | 34.2 |
| 1MHN | –4 | 1.54 | 5.49 | 3.6 | 11.8 |
| 6LYT | +8 | 1.35 | 6.99 | 0.9 | 32.2 |
Also shown are errors in the protein dipole moment vectors, which have been calculated relative to the center of mass of each protein to remove ambiguity for charged systems. The DDEC charges reproduce electrostatic properties of large molecules much better than do the mean field classical point charges.
Figure 6.
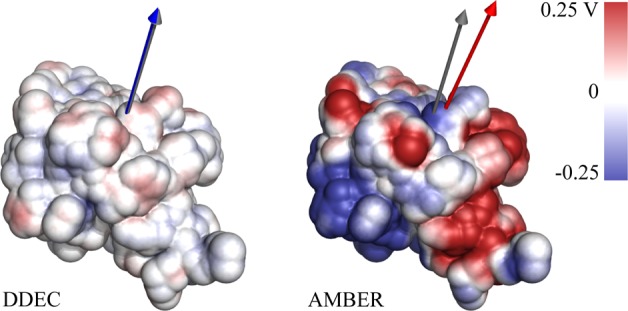
Difference in calculated electrostatic potential between point charges and DFT for ubiquitin. The ESP difference is calculated at the solvent-accessible surface of the protein. Also shown as gray, blue, and red arrows are the calculated DFT, DDEC, and AMBER dipole moments, respectively.
We noted earlier that ISA charges are particularly good at reproducing the ESP, since the electron density is divided into spherically symmetric partitions. This point is reinforced by Figure 7, which reveals that the deviation from the ab initio dipole moment of ubiquitin decreases with decreasing χ (increasing ISA fraction). However, one of the motivations for including IH reference densities in the DDEC information entropy functional (eq 8) was to alleviate problematic convergence for AIM charges of embedded atoms due to the shallow optimization landscapes experienced in such regions.18 We find that the DDEC method with χ = 3/14, as recommended for all systems by Manz and Sholl,19 is a good compromise between reproducing accurately the ESP of the system, reducing the number of self-consistency iterations required for convergence (Figure 7) and, as we shall see in the next section, improving the transferability of the charges. Further comparisons between DDEC, IH, and ISA charges are presented in Supporting Information Figure S5.
Figure 7.
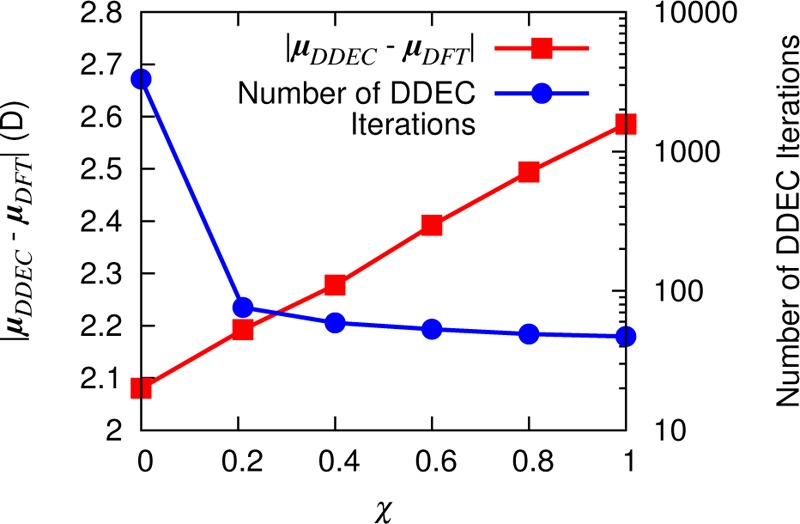
Dependence of the DDEC dipole moment error on the mixing parameter χ. Increasing the ISA content reduces the dipole error but also increases the number of iterations required for charge convergence and, hence, the computational time.
3.3. DDEC Charges are Transferable
In order to be of use in parametrizing flexible force fields, atomic charges, even those of buried atoms, must not be overly sensitive to small conformational changes. To study conformational dependencies of the DDEC charges for large systems, we have performed DDEC analysis of nine experimental NMR conformers of bovine pancreatic trypsin inhibitor (BPTI, PDB: 1PIT) in implicit solvent (892 atoms). Each residue in Figure 8 is colored by the average of the standard deviation in the calculated atomic charges over the nine conformations. The first point to note is that the DDEC charges are much more stable to conformational change than the ISA charges. While some fluctuation due to the changing environment is expected, the protein conformers are all close to the native state and the DDEC charges reflect this. This is in stark contrast to RESP charges, for which a recent review of atomic charge models found strong fluctuations in partial charges for an ensemble of polypeptide chain conformations.14 Second, there is no discernible difference between charge fluctuations in buried and exposed residues, as would be observed for shallow optimization landscapes. Finally, the width of the protein chains in Figure 8 reflects the average positional fluctuation of each residue. It is noticeable that DDEC charges vary more strongly in residues with a high degree of flexibility, especially when they form intramolecular contacts (between β-sheets, within α-helices, and in sections linked by disulfide bridges), as one might expect.
Figure 8.
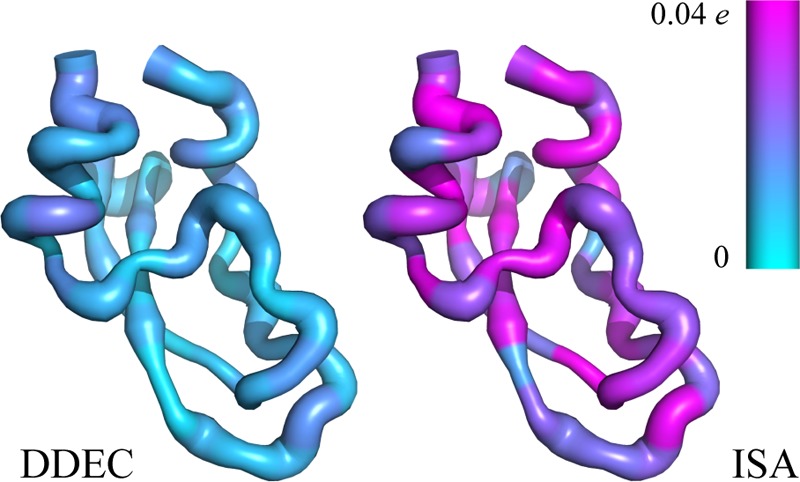
DDEC/ONETEP charge and conformation fluctuations for nine NMR models of BPTI. Average positional fluctuation per residue is represented by its putty width and average charge fluctuation (standard deviation) per residue by its color. ISA charge fluctuations have been clipped at 0.04 e for visual clarity (ten residues in the ISA method have values greater than 0.04 e, with a maximum of 0.06 e). ISA charges are DDEC/ONETEP charges derived with χ = 0 (eq 7).
We showed in the previous section that DDEC charges are able to accurately reproduce the ESP around the structure that they are fit to. Here, we investigate whether average charges derived for an ensemble of native state conformations are able to accurately describe the electrostatic properties of each conformation close to that native state. Such a test is vital if the charges are to be used in the construction of force fields for simulating the dynamics of proteins. Figure 9 shows the discrepancy between dipole moments calculated via atomic point charges and DFT. To obtain the best agreement with the DFT dipole moment of a particular structure, it is preferable to fit the DDEC atomic point charges to that particular structure. However, encouragingly, there is very little degradation in performance if DDEC charges that have been averaged over the full ensemble are used instead. This reflects the transferability of DDEC charges between conformations close to the native state. The force field charges perform relatively well for this structure but not as well as the polarized protein-specific charges. This behavior is in agreement with previous work showing that ESP charges give the best fit to ab initio electrostatics for a given structure, but that DDEC charges are generally more transferable to different, similar structures.19
Figure 9.
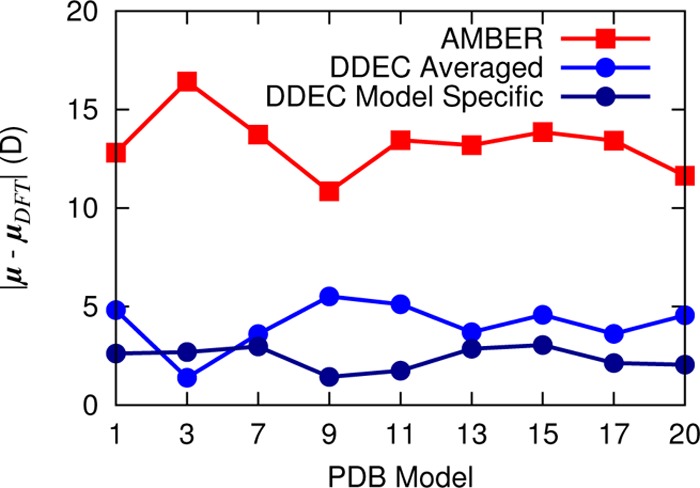
Deviation between charge model and ab initio dipole moment vectors for nine NMR conformers of BPTI. DDEC/ONETEP charges have been calculated separately for each structure (dark blue) and averaged over all structures (light blue). AMBER ff99SB charges are included for comparison. The net charge of the system is +6 e.
4. Protein Dynamics
As we have demonstrated in the previous section, DDEC charges derived from the DFT electron density of entire proteins have properties that make them desirable for use in flexible force fields. We now put this into practice by performing molecular dynamics (MD) simulations of the three proteins described previously (PDB: 1UBQ, 1MHN, 6LYT) using force fields based on our calculated DDEC charges. We have followed the procedure of Tong et al.9 by taking the bonded and Lennard-Jones parameters directly from the AMBER ff99SB force field but replacing the atom-centered point charges by the DDEC/ONETEP charges. It should be emphasized that torsional and Lennard-Jones parameters are as important as the charges in determining protein dynamics and a large number of alternative force fields exist, many of which outperform the ff99SB force field in comparison with experiment.51 Nevertheless, here we concentrate on demonstrating the feasibility of using AIM approaches to supplement an existing, commonly used force field.
Figure 10 shows the backbone RMS deviations of the three proteins from their X-ray crystal structures over the course of 10 ns simulations, performed at 300 K in explicit water (Supporting Information). For both force fields, the experimental structure is stable over the course of the simulation.
Figure 10.
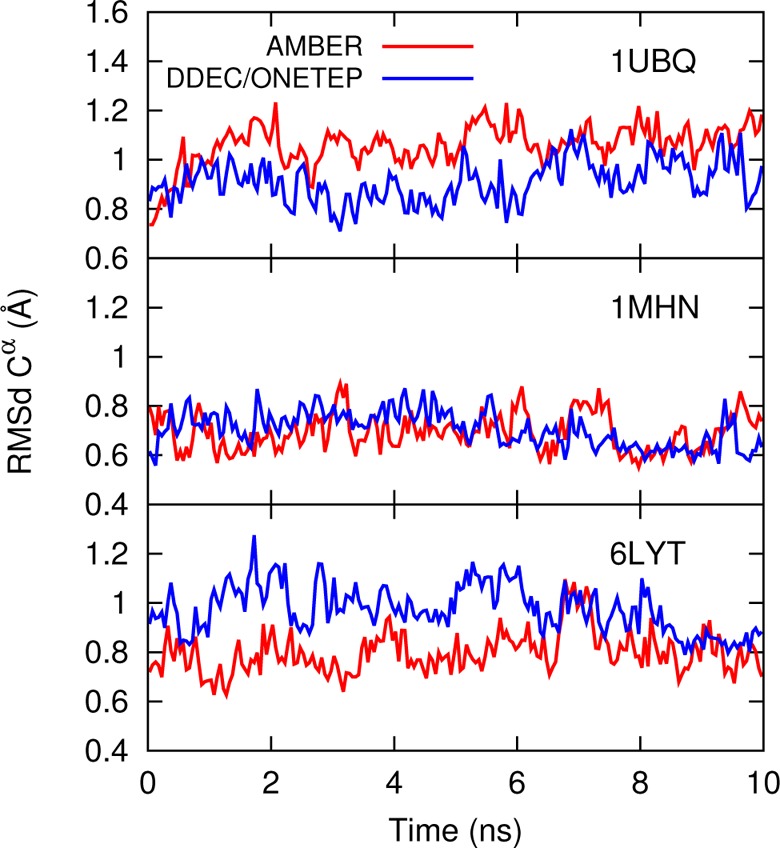
Backbone Cα root-mean-square deviation (RMSd) with respect to the initial experimental PDB structure for 1UBQ, 1MHN, and 6LYT, with running averages taken over 50 ps windows. The first and last four residues have been excluded due to their high flexibility.
To assess the quality of simulated MM dynamics, it is common to use, as metrics, experimental NMR-derived quantities. The square of the generalized order parameter S2, based on the Lipari–Szabo model-free approach to analyzing nuclear spin-relaxation measurements,52 is the plateau value of the time-correlation function C2(t) of the second-order Legrendre polynomial of backbone N–H bond unit vectors e(t):
| 13 |
where C2(t) is time-averaged over a trajectory τ.53S2 represents the spatial restriction of the motion of N–H bond vectors, and a lower S2 value corresponds to a more flexible residue. S2 values were calculated from our 10 ns MD simulations using the iRED method54 as implemented in the AMBER11 ptraj module. In this method, a covariance matrix M is constructed from the N–H unit bond vector pairs ei,j in a fixed reference frame and averaged over the entire trajectory:
| 14 |
S2 of residue i is then obtained from solving the eigenvalue equation Mm = λmm as
| 15 |
where the sum is taken over N – 5 eigenvectors excluding five with the largest eigenvalues, and mi is the ith component of eigenvector m.53,55
Figure 11 compares simulated and experimental56−58S2 profiles for the standard AMBER ff99SB force field and the same force field supplemented by DDEC/ONETEP atomic charges. The only difference between the simulation protocols is in the point charges and so any improvement in the calculated order parameters is due to the inclusion of native state polarization in their calculation. Table 2 compares the agreement between simulated and experimental S2 data (for all residues where experimental data is available). It indicates that DDEC AIM charges perform better than mean field force field charges in providing a suitable electrostatic environment that maintains protein stability throughout the 10 ns trajectory while remaining dynamically consistent with experimental observations.
Figure 11.
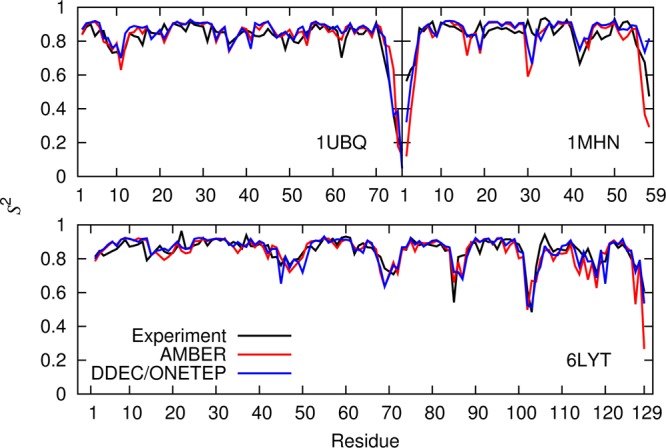
Comparison between the experimental and calculated backbone N–H order parameter S2 for 1UBQ, 1MHN, and 6LYT using AMBER ff99SB and DDEC atomic charges. Quantitative comparisons are given in Table 2.
Table 2. RMS Difference, MAD, and Average S2 Ratio ⟨SMM2/SNMR⟩ between MM and experimental order parameters in Figure 11a.
| RMS S2 |
MAD S2 |
⟨SMM2/SNMR⟩ |
||||
|---|---|---|---|---|---|---|
| protein | AMBER | DDEC/ONETEP | AMBER | DDEC/ONETEP | AMBER | DDEC/ONETEP |
| 1UBQ | 0.060 | 0.053 | 0.040 | 0.040 | 1.03 ± 0.11 | 1.03 ± 0.13 |
| 1MHN | 0.118 | 0.087 | 0.074 | 0.060 | 0.95 ± 0.17 | 1.01 ± 0.14 |
| 6LYT | 0.065 | 0.047 | 0.043 | 0.034 | 0.99 ± 0.09 | 1.00 ± 0.06 |
The agreement of the generalized order parameter with experiment is improved by using the DDEC/ONETEP protein-specific charges.
In addition to backbone rigidity, we also compared the NMR scalar coupling h3JNC′ of the N—H···O=C backbone–backbone hydrogen bonds, which provides a measure of hydrogen bond dynamics within a protein. It was shown by Barfield59 that h3JNC′ values, being dependent on the wave function overlap across the hydrogen bond, are strongly geometry dependent and can be parametrized as such by several formulas, with the simplest based on only the H···O distance rOH and H···O=C angle θ:60
| 16 |
Equation 16 was used to compute the time-averaged h3JNC′ of backbone–backbone hydrogen bonds60,61 using the AMBER ff99SB and DDEC/ONETEP MM snapshots over the 10 ns trajectories. The results are correlated with experimental measurements61,62 in Figure 12. The RMS deviations between simulation and experiment (Figure 12, in brackets) once again indicate that DDEC/ONETEP charges perform at least as well as AMBER charges, illustrating that backbone N–H and C=O bond polarization is also suitably described by the electron density partitioning approach to charge derivation.
Figure 12.
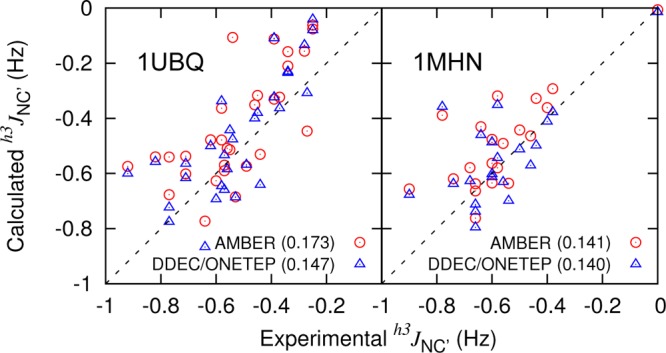
h3JNC′ comparison between simulation and experiment61,62 for 1UBQ and 1MHN. RMS differences from experiment are given in brackets beside labels.
5. Conclusions
The DDEC atoms-in-molecule scheme for the assignment of atomic charges through partitioning of the ab initio electron density has a number of features that makes it desirable for charge derivation for flexible force fields.18,19 However, its use in the analysis of realistic biomolecular systems has, until now, been limited by the computational expense of the underlying QM calculation. In this paper, we have implemented the DDEC scheme in the linear-scaling DFT code ONETEP. Strict localization of the NGWF basis in ONETEP onto atomic regions allows derivation of the electronic density of systems comprising thousands of atoms with affordable computational expense. Optimizing the NGWFs in situ allows for a minimal number of atom-centered orbitals to be used while maintaining near-complete basis set accuracy. Systematic improvement in accuracy is achievable via tuning of a very small number of parameters and, along with a minimal parameter solvation model, allows the user to derive charges for any molecular system with no prior knowledge of its chemical characteristics. The DDEC method is also suitable for implementation in other DFT codes, as well as for example fragment molecular orbital approaches to generating the electron density of large systems, for which we hope our implementation will provide an accuracy benchmark.
We have validated our implementation of the DDEC method in ONETEP against the standard CHARGEMOL package with quantum chemistry calculations in Gaussian09. In agreement with previous observations, DDEC charges perform less well than ESP charges in reproducing the ab initio potential of small molecules.18 Nevertheless, our interest here is in the calculation of polarized charges for entire proteins. Indeed, we have found that the errors in the electrostatic potential at the surfaces of three proteins are very similar to those for small molecules (errors of 1.3–1.5 kcal/mol). Furthermore, the system-specific DDEC charges outperform standard AMBER charges for these molecules (errors of 5–7 kcal/mol). We would expect similar performances for other force fields that have been fit to small molecules without incorporating large-scale polarization.
Although the ESP method is unsuited to the direct calculation of atomic charges from a single QM calculation due to the sensitivity of the charges to buried atoms and small conformational changes,14 a number of studies have determined protein-specific charges based on this method. By separating the system into a large number of dipeptide fragments, fitting ESP charges to the resulting structures and averaging them over several conformations of the protein, stable and transferable charges have been obtained.12,13 By also including the effects of the environment, represented by point charges, in an iterative ESP fit, it should be possible to further derive polarized protein-specific charges that are stable with respect to small changes in conformation.8 Although the ESP charges are preferable to DDEC for reproducing the ab initio potential of small molecules, it is not obvious that these conformation-averaged ESP charges are the optimum choice for large molecules. In fact, Manz and Sholl have shown that DDEC and conformation-averaged ESP charges give essentially the same agreement with the ab initio electrostatic potential of small molecules.19 It would be interesting, in future work, to make this comparison for larger molecules.
Further advantages of the DDEC charges are that, since they are derived from a single DFT calculation of entire biomolecules, environmental polarization is naturally included. Moreover, no prior, system-specific chemical knowledge or specialized treatment is required to ensure proper charge derivation, rendering the method extremely versatile. In agreement with previous observations of smaller systems, the charges are insensitive to small conformational changes and buried atoms require no special treatment. In this paper, we are interested in the application of DDEC charges to standard MM force fields. Therefore, we have restricted the DDEC expansion to monopole order in our electrostatic potential comparisons. As discussed by Manz and Sholl,18 the electrostatic potential description of DDEC charges can be trivially improved by including higher order multipole terms in the partitioned AIM densities, without requiring a new fitting procedure.
We have incorporated the DDEC charges of three proteins into a classical force field and run molecular mechanics simulations to compute NMR order parameters and scalar couplings. Our observations indicate that the DDEC AIM charges perform at least as well, if not better than AMBER ff99SB in replicating protein dynamics. The charges of backbone–backbone hydrogen bonds are more polarized in DDEC/ONETEP than in the standard AMBER force field. Nevertheless, they are able to replicate dynamics consistent with experiments when used in MM force fields. Our results are therefore consistent with previous hypotheses that electronic polarization is important in stabilization of a protein’s native state.9 It should be noted that these DDEC AIMs were obtained without explicit fitting to replicate electrostatic effects nor parametrization to experimental properties.
The potential applications of linear-scaling DDEC analysis span a wide range of problems in which accurate determination of electrostatics via atomic point charges is important. DDEC charges have already been used to study molecular adsorption inside metal–organic frameworks.21,22 In the biomolecular sciences, the optimization of protein-inhibitor interactions for drug design, pKa calculation, study of ion channel conductivity and elucidation of enzymatic reaction mechanisms all depend critically on an accurate description of the electrostatic potential, for which DDEC perform markedly better than standard classical force field charges.
Acknowledgments
We are grateful to Nicholas Hine for ONETEP-related technical consultations and to Greg Lever for bulk water simulations. Computational resources were provided by the Cambridge HPC Service, funded by EPSRC Grant No. EP/F032773/1, and by the IRIDIS3 supercomputer of the University of Southampton. L.P.L. thanks the Cambridge Commonwealth Trust for financial support. C.K.S. thanks the Royal Society for a University Research Fellowship. Gratitude is expressed to the National Institutes of Health (GM32136) for support of the work at Yale.
Supporting Information Available
Additional computational methods, convergence tests of DDEC charges, RESP charges for phenol using B3LYP/6-31G* with PCM solvation, comparison between PBE and B3LYP exchange-correlation functionals, comparison between DDEC charges and the AMBER ff03 force field, and comparison of DDEC, IH, and ISA charges. This material is available free of charge via the Internet at http://pubs.acs.org/.
The authors declare no competing financial interest.
Funding Statement
National Institutes of Health, United States
Supplementary Material
References
- Jorgensen W. L. Acc. Chem. Res. 2009, 42, 724–733. [DOI] [PMC free article] [PubMed] [Google Scholar]
- Case D.A.; Darden T.A.; Cheatham T.E. III, Simmerling C.L.; Wang J.; Duke R.E.; Luo R., Walker R.C.; Zhang W.; Merz K.M.; Roberts B.; Wang B.; Hayik S.; Roitberg A.; Seabra G.; Kolossváry I., Wong K.F.; Paesani F.; Vanicek J.; Liu J.; Wu X.; Brozell S.R.; Steinbrecher T.; Gohlke H.; Cai Q.; Ye X.; Wang J.; Hsieh M.-J.; Cui G.; Roe D.R.; Mathews D. H., Seetin M.G.; Sagui C.; Babin V.; Luchko T.; Gusarov S.; Kovalenko A.; Kollman P.A.. AMBER 11; University of California: San Francisco, 2010. [Google Scholar]
- Duan Y.; Wu C.; Chowdhury S.; Lee M. C.; Xiong G.; Zhang W.; Yang R.; Cieplak P.; Luo R.; Lee T.; Caldwell J.; Wang J.; Kollman P. J. Comput. Chem. 2003, 24, 1999–2012. [DOI] [PubMed] [Google Scholar]
- Cornell W. D.; Cieplak P.; Bayly C. I.; Gould I. R.; Merz K. M.; Ferguson D. M.; Spellmeyer D. C.; Fox T.; Caldwell J. W.; Kollman P. A. J. Am. Chem. Soc. 1995, 117, 5179–5197. [Google Scholar]
- Bayly C. I.; Cieplak P.; Cornell W.; Kollman P. A. J. Phys. Chem. 1993, 97, 10269–10280. [Google Scholar]
- Lee L. P.; Cole D. J.; Payne M. C.; Skylaris C.-K. J. Comput. Chem. 2013, 34, 429–444. [DOI] [PubMed] [Google Scholar]
- Tong Y.; Mei Y.; Li Y. L.; Ji C. G.; Zhang J. Z. H. J. Am. Chem. Soc. 2010, 132, 5137–5142. [DOI] [PubMed] [Google Scholar]
- Ji C.; Mei Y.; Zhang J. Z. Biophys. J. 2008, 95, 1080–1088. [DOI] [PMC free article] [PubMed] [Google Scholar]
- Tong Y.; Ji C. G.; Mei Y.; Zhang J. Z. H. J. Am. Chem. Soc. 2009, 131, 8636–8641. [DOI] [PubMed] [Google Scholar]
- Ji C. G.; Zhang J. Z. H. J. Phys. Chem. B 2009, 113, 13898–13900. [DOI] [PubMed] [Google Scholar]
- Zeng J.; Duan L.; Zhang J. Z. H.; Mei Y. J. Comput. Chem. 2013, 34, 847–853. [DOI] [PubMed] [Google Scholar]
- Söderhjelm P.; Ryde U. J. Comput. Chem. 2009, 30, 750–760. [DOI] [PubMed] [Google Scholar]
- Genheden S.; Söderhjelm P.; Ryde U. Int. J. Quantum Chem. 2012, 112, 1768–1785. [Google Scholar]
- Verstraelen T.; Pauwels E.; De Proft F.; Van Speybroeck V.; Geerlings P.; Waroquier M. J. Chem. Theory Comput. 2012, 8, 661–676. [DOI] [PubMed] [Google Scholar]
- Hirshfeld F. Theor. Chim. Acta 1977, 44, 129–138. [Google Scholar]
- Lillestolen T. C.; Wheatley R. J. J. Chem. Phys. 2009, 131, 144101. [DOI] [PubMed] [Google Scholar]
- Bultinck P.; Alsenoy C. V.; Ayers P. W.; Carbó-Dorca R. J. Chem. Phys. 2007, 126, 144111. [DOI] [PubMed] [Google Scholar]
- Manz T. A.; Sholl D. S. J. Chem. Theory Comput. 2010, 6, 2455–2468. [DOI] [PubMed] [Google Scholar]
- Manz T. A.; Sholl D. S. J. Chem. Theory Comput. 2012, 8, 2844–2867. [DOI] [PubMed] [Google Scholar]
- Li L.; Morrill M. R.; Shou H.; Barton D. G.; Ferrari D.; Davis R. J.; Agrawal P. K.; Jones C. W.; Sholl D. S. J. Phys. Chem. C 2013, 117, 2769–2773. [Google Scholar]
- Haldoupis E.; Nair S.; Sholl D. S. J. Am. Chem. Soc. 2012, 134, 4313–4323. [DOI] [PubMed] [Google Scholar]
- Fang H.; Kamakoti P.; Zang J.; Cundy S.; Paur C.; Ravikovitch P. I.; Sholl D. S. J. Phys. Chem. C 2012, 116, 10692–10701. [Google Scholar]
- Hine N. D. M.; Haynes P. D.; Mostofi A. A.; Skylaris C.-K.; Payne M. C. Comput. Phys. Commun. 2009, 180, 1041–1053. [Google Scholar]
- Heiss M.; Fontana Y.; Gustafsson A.; Wust G.; Magen C.; O’Regan D. D.; Luo J. W.; Ketterer B.; Conesa-Boj S.; Kuhlmann A. V.; Houel J.; Russo-Averchi E.; Morante J. R.; Cantoni M.; Marzari N.; et al. Nat. Mater. 2013, 12, 439–444. [DOI] [PubMed] [Google Scholar]
- Cole D. J.; O’Regan D. D.; Payne M. C. J. Phys. Chem. Lett. 2012, 3, 1448–1452. [DOI] [PubMed] [Google Scholar]
- Cole D. J.; Rajendra E.; Roberts-Thomson M.; Hardwick B.; McKenzie G. J.; Payne M. C.; Venkitaraman A. R.; Skylaris C.-K. PLoS Comput. Biol. 2011, 7, e1002096. [DOI] [PMC free article] [PubMed] [Google Scholar]
- Cole D. J.; Skylaris C.-K.; Rajendra E.; Venkitaraman A.; Payne M. C. Europhys. Lett. 2010, 91, 37004. [Google Scholar]
- Frisch M. J.; Trucks G. W.; Schlegel H. B.; Scuseria G. E.; Robb M. A.; Cheeseman J. R.; Scalmani G.; Barone V.; Mennucci B.; Petersson G. A.; Nakatsuji H.; Caricato M.; Li X.; Hratchian H. P.; Izmaylov A. F.. et al. Gaussian 09, Revision A.1; Gaussian Inc.: Wallingford, CT, 2009. [Google Scholar]
- Nalewajski R. F.; Parr R. G. Proc. Natl. Acad. Sci. U.S.A. 2000, 97, 8879–8882. [DOI] [PMC free article] [PubMed] [Google Scholar]
- Skylaris C.-K.; Haynes P. D.; Mostofi A. A.; Payne M. C. J. Chem. Phys. 2005, 122, 084119. [DOI] [PubMed] [Google Scholar]
- Skylaris C.-K.; Mostofi A. A.; Haynes P. D.; Dieguez O.; Payne M. C. Phys. Rev. B 2002, 66, 035119. [Google Scholar]
- Prodan E.; Kohn W. Proc. Natl. Acad. Sci. U.S.A. 2005, 102, 11635–11638. [DOI] [PMC free article] [PubMed] [Google Scholar]
- Mostofi A. A.; Haynes P. D.; Skylaris C.-K.; Payne M. C. J. Chem. Phys. 2003, 119, 8842. [Google Scholar]
- Ruiz-Serrano A.; Hine N. D. M.; Skylaris C.-K. J. Chem. Phys. 2012, 136, 234101. [DOI] [PubMed] [Google Scholar]
- Lever G.; Cole D. J.; Hine N. D. M.; Haynes P. D.; Payne M. C. J. Phys.: Cond. Matt. 2013, 25, 152101. [DOI] [PubMed] [Google Scholar]
- Dziedzic J.; Helal H. H.; Skylaris C.-K.; Mostofi A. A.; Payne M. C. Europhys. Lett. 2011, 95, 43001. [Google Scholar]
- Dziedzic J.; Fox S. J.; Fox T.; Tautermann C. S.; Skylaris C.-K. Int. J. Quantum Chem. 2013, 113, 771–785. [Google Scholar]
- Jorgensen W. L.; Chandrasekhar J.; Madura J. D.; Impey R. W.; Klein M. L. J. Chem. Phys. 1983, 79, 926. [Google Scholar]
- Vanpoucke D. E. P.; Bultinck P.; Van Driessche I. J. Comput. Chem. 2013, 34, 405–417. [DOI] [PubMed] [Google Scholar]
- Udier-Blagović M.; Morales De Tirado P.; Pearlman S. A.; Jorgensen W. L. J. Comput. Chem. 2004, 25, 1322–1332. [DOI] [PubMed] [Google Scholar]
- Perdew J. P.; Burke K.; Ernzerhof M. Phys. Rev. Lett. 1996, 77, 3865. [DOI] [PubMed] [Google Scholar]
- Hine N. D. M.; Dziedzic J.; Haynes P. D.; Skylaris C.-K. J. Chem. Phys. 2011, 135, 204103. [DOI] [PubMed] [Google Scholar]
- Watanabe T.; Manz T. A.; Sholl D. S. J. Phys. Chem. C 2011, 115, 4824–4836. [Google Scholar]
- Van Damme S.; Bultinck P.; Fias S. J. Chem. Theory Comput. 2009, 5, 334–340. [DOI] [PubMed] [Google Scholar]
- Dziedzic J.; Hill Q.; Skylaris C.-K. Submitted.
- Weber C.; O’Regan D. D.; Hine N. D. M.; Littlewood P. B.; Kotliar G.; Payne M. C. Phys. Rev. Lett. 2013, 110, 106402. [DOI] [PubMed] [Google Scholar]
- Liu L.; Baase W. A.; Michael M. M.; Matthews B. W. Biochemistry 2009, 48, 8842–8851. [DOI] [PubMed] [Google Scholar]
- Chen V. B.; Arendall W. B. III; Headd J. J.; Keedy D. A.; Immormino R. M.; Kapral G. J.; Murray L. W.; Richardson J. S.; Richardson D. C. Acta Crystallogr. 2010, D66, 12–21. [DOI] [PMC free article] [PubMed] [Google Scholar]
- Hornak V.; Abel R.; Okur A.; Strockbine B.; Roitberg A.; Simmerling C. Proteins 2006, 65, 712. [DOI] [PMC free article] [PubMed] [Google Scholar]
- Ji C. G.; Xiao X.; Zhang J. Z. H. J. Chem. Theory Comput. 2012, 8, 2157–2164. [DOI] [PubMed] [Google Scholar]
- Beauchamp K. A.; Lin Y.-S.; Das R.; Pande V. S. J. Chem. Theory Comput. 2012, 8, 1409–1414. [DOI] [PMC free article] [PubMed] [Google Scholar]
- Lipari G.; Szabo A. J. Am. Chem. Soc. 1982, 104, 4546–4559. [Google Scholar]
- Genheden S.; Diehl C.; Akke M.; Ryde U. J. Chem. Theory Comput. 2010, 6, 2176–2190. [DOI] [PubMed] [Google Scholar]
- Prompers J. J.; Brüschweiler R. J. Am. Chem. Soc. 2002, 124, 4522–4534. [DOI] [PubMed] [Google Scholar]
- Showalter S. A.; Brüschweiler R. J. Chem. Theory Comput. 2007, 3, 961–975. [DOI] [PubMed] [Google Scholar]
- Tjandra N.; Szabo A.; Bax A. J. Am. Chem. Soc. 1996, 118, 6986–6991. [Google Scholar]
- Sprangers R.; Groves M. R.; Sinning I.; Sattler M. J. Mol. Biol. 2003, 327, 507–520. [DOI] [PubMed] [Google Scholar]
- Buck M.; Bouguet-Bonnet S.; Pastor R. W. Jr.; A. D. M. Biophys. J. 2006, 90, L36–L38. [DOI] [PMC free article] [PubMed] [Google Scholar]
- Barfield M. J. Am. Chem. Soc. 2002, 124, 4158–4168. [DOI] [PubMed] [Google Scholar]
- Sass H.-J.; Schmid F. F.-F.; Grzesiek S. J. Am. Chem. Soc. 2007, 129, 5898–5903. [DOI] [PubMed] [Google Scholar]
- Markwick P. R. L.; Sprangers R.; Sattler M. J. Am. Chem. Soc. 2003, 125, 644–645. [DOI] [PubMed] [Google Scholar]
- Cordier F.; Grzesiek S. J. Am. Chem. Soc. 1999, 121, 1601–1602. [Google Scholar]
Associated Data
This section collects any data citations, data availability statements, or supplementary materials included in this article.


