

Abstract
Purpose
To characterize a canine model of autosomal recessive RP due to a PDE6A gene mutation.
Methods
Affected and breed- and age-matched control puppies were studied by electroretinography (ERG), light and electron microscopy, immunohistochemistry and by assay for retinal PDE6 levels and enzymatic activity.
Results
The mutant puppies failed to develop normal rod-mediated ERG responses and had reduced light-adapted a-wave amplitudes from an early age. The residual ERG waveforms originated primarily from cone-driven responses. Development of photoreceptor outer segments was halted and rod cells were lost by apoptosis. Immunohistochemistry demonstrated a marked reduction in rod-opsin immunostaining outer segments and relative preservation of cones early in the disease process. With exception of rod bipolar cells that appeared to be reduced in number relatively early in the disease process other inner retinal cells were preserved in the early stages of the disease although there was marked and early activation of Müller glia. Western blotting showed that the PDE6A mutation not only resulted in a lack of PDE6A protein but the affected retinas also lacked the other PDE6 subunits, suggesting expression of PDE6A is required for normal expression of PDE6B and PDE6G. Affected retinas lacked PDE6 enzymatic activity.
Conclusions
This represents the first characterization of a PDE6A model of autosomal recessive retinitis pigmentosa and the PDE6A mutant dog shows promise as a large animal model for investigation of therapies to rescue mutant rod photoreceptors and to preserve cone photoreceptors in the face a rapid loss of rod cells.
INTRODUCTION
Progressive retinal atrophy (PRA) is the canine equivalent of retinitis pigmentosa (RP) in people. Typically RP and PRA cause a rod-led retinal degeneration leading to significant visual impairment. The age of onset and rate of retinal degeneration varies between the different forms of the conditions. Both PRA and RP show genetic heterogeneity with autosomal recessive, autosomal dominant and X-linked forms being recognized in both species. Currently there are 21 genes that have been shown to be mutated in autosomal recessive RP and an additional 5 mapped loci identified (RetNet. http://www.sph.uth.tmc.edu/retnet/). In dog breeds with autosomal recessive PRA mutations have been identified in PDE6B (2 breeds with different mutations), 1–3 PDE6A 4 and a newly identified gene on canine chromosome 9 (progressive rod cone degeneration - PRCD).5 PRA in the Irish Setter breed of dog with a nonsense mutation in PDE6B has been studied in some detail 6–8 and the model utilized in several therapy trials.9–11 We have shown that the Cardigan Welsh Corgi with autosomal recessive PRA has a one-base pair deletion in codon 616 of PDE6A with a resultant frame-shift that is predicted to result in a string of 28 altered amino acids followed by a premature stop codon.4 If translated the altered protein would be missing part of its catalytic domain and its membrane binding site. Mutations in PDE6A account for 3 to 4% of families with recessive RP in North America12 and have been reported in consanguineous families in Pakistan.13 Patients with PDE6A mutations are reported to have a history of night blindness from early childhood and as children have marked reduction in ERG responses. 14
The purpose of this study was to record in detail the phenotype of dogs with autosomal recessive PRA due to a one-base pair deletion in codon 616 of PDE6A.
MATERIALS AND METHODS
Animals
A breeding colony of dogs with a mutation of PDE6A4 was maintained at the vivarium of the College of Veterinary Medicine, Michigan State University. Breedings were performed to produce affected (PDE6A−/−), carrier (PDE6A+/−) and normal (PDE6A+/+) puppies to allow the characterization of the PDE6A mutant phenotype and to provide age and breed matched controls. The dogs were maintained under 12 hours light/dark cycles. Genotyping for the PDE6A mutation was performed as previously described. 15 All procedures were performed in compliance with the ARVO statement for the Use of Animals in Ophthalmic and Vision Research and were approved by the Institution Animal Use Committee.
The functional disease phenotype was assessed by electroretinography. Retinal morphological changes were assessed by histological, morphometric and ultrastructural examination and by immunohistochemical and TUNEL staining. Retinal samples were also assayed for cGMP activity and PDE6 protein investigated by Western blotting.
To follow the development and subsequent deterioration of ERG responses in the mutant puppies ERG studies were carried out in 4 affected, 4 breed-matched homozygous normal and 5 carrier puppies from shortly after eyelid opening (approximately 2 weeks of age) to 12 weeks of age.
A total of 37 PDE6A−/−, 21 PDE6A+/− and 19 PDE6A+/+ puppies ranging from 6 days to 16 weeks of age were used for the histological, immunohistochemical and biochemical (cGMP activity assay and Western blotting for PDE6 proteins) – see Table 1 Supplementary Information for details (<INSERT URL>). Histological assessment was performed using plastic-embedded-sections or paraffin-embedded sections, and the former utilized for morphometric measurements. Immunohistochemistry was performed on paraffin-embedded sections or frozen OCT-embedded sections. Morphometric analysis (measurement of retinal layer thicknesses and counting of photoreceptor nuclei numbers) was performed using plastic embedded retinal sections from 3 affected and 3 homozygous normal puppies at each age point.
Preparation for electroretinography (ERG)
The puppies were kept in the dark on the day of the ERG and prepared under a dim red light. Puppies under 9 weeks of age were induced and maintained with halothane delivered in oxygen. Puppies 9 weeks and older were premedicated with acepromazine maleate intramuscularly (0.1–0.3 mg/kg), induced with thiopental sodium intravenously (6–12 mg/kg) and maintained with halothane delivered in oxygen. A pulse-oximeter (Vet/Ox 4400, Heska Corporation, Fort Collins, CO) was used to monitor pulse rate and oxygen saturation for the duration of the procedure. Body temperature was maintained using a heating pad. The anesthetized animals were positioned in sternal recumbency. The left eye was used for ERG recording, the right eye was taped close. The left pupil was maximally dilated using 1% tropicamide (Mydriacyl®, Alcon Laboratories, Honolulu, HI) and 10% phenylephrine hydrochloride (AK-Dilate®, Akorn Inc, Buffalo Grove, IL). The globe was positioned in primary gaze using stay sutures of 4-0 silk (Ethicon, Inc, Piscataway, NJ) placed in the conjunctiva adjacent to the limbus. A drop of 2.5% hydroxypropyl methylcellulose solution (Goniosol®, Iolab Pharmaceutical Inc, Claremont, CA) was applied to keep the cornea moist. Burian-Allen bipolar contact lens electrodes (Hansen Ophthalmic Development Laboratory, Coralville, IA) were used. A platinum needle placed subcutaneously in the cervical region served as a ground electrode.
ERG protocols
An UTAS-E 3000 electrophysiology unit (LKC Technologies Inc; Gaithersburg, MD) with a ganzfeld bowl was used. The band pass was set at 1 to 500 Hz; gain setting varied from 2×10³ to 4×10⁴.
ERG protocols included a dark-adapted intensity series, rod flicker responses, a light-adapted intensity series and cone flicker responses.
After 60 minutes of dark adaptation, an intensity series in response to 16 different intensities of white flash (ranging from −3.18 to 2.82 log cds/m2) were recorded. Inter-stimulus intervals (between the signal averaged flashes and between different intensities) were increased from one second at low intensities to 360 seconds at the highest intensity to avoid light adapting the rods. Preliminary studies showed that at these inter-stimulus intervals rod adaptation did not develop in normal dogs (data not shown). Dependent on the response amplitude from 2 to 50 (with the larger numbers of responses being averaged for the very low amplitude responses) flashes were averaged at each intensity. Rod flicker ERG responses at 5Hz were recorded in response to white flashes −1.6 log cds/m2 in intensity, and 15 tracings averaged.
The puppies were then light-adapted for 10 minutes to a rod suppressing white light of 30 cd/m2. ERG responses were recorded from a series of 10 white flash intensities (ranging from −0.39 to 2.82 log cds/m2), superimposed on the same background white light. Inter-stimulus intervals were one second for intensities between −0.39 to 1.36 log cds/m2 and 5, 10, and 15 seconds for 1.9, 2.38, and 2.82 log cds/m2, respectively. Between 5 and 50 flashes were averaged at each intensity, again dependent on the amplitude of response.
Cone flicker ERG was recorded using white flash stimulus at 0.39 log cds/m2 intensity at 33 Hz, and 15 tracings averaged.
ERG Data Analysis
The a- and b-wave amplitude (micro volt; μV) and implicit time (millisecond; msec) were measured for each averaged response as previously described.16 Flicker amplitude and implicit time were measured for the entire recording period and averaged. Amplitude was measured from trough to peak of each wave, implicit time was duration of time measured from flash onset to the peak of each wave.
For statistical analysis logarithmic transformation was applied to attain normality. Experiments involving repeated measures data were analyzed using Proc Mixed, SAS version 9.1 (SAS Institute Inc., Cary, NC). Fixed effects of age, genotype and their interaction, were included in the model. Additionally, an arbitrary covariance structure for the residuals was fit to account for correlation between repeated measures. Interaction between age and genotype was tested at each flash intensity used. Significant tests of interaction were followed by additional tests of genotype effect at each given age. Data were considered significant at a level of significance less than 0.05 (P<0.05).
Retinal Histology
Retinal histology was assessed on sections from either plastic-embedded or paraffin-embedded posterior eyecups. Selected plastic-embedded sections were used for morphometric measurements. For plastic embedding the globes were fixed in 3% glutaraldehyde, 2% paraformaldehyde, and 0.1M Sodium-cacodylate buffer (pH 7.2) and for paraffin embedding they were fixed with 4% paraformaldehyde in 0.1M phosphate buffered saline. In both instances after two hours at 4°C the anterior segment was removed and the eyecup returned to the same fixative for 20 hours at 4°C. The eyecups for paraffin-embedding were routinely processed and sections stained with hematoxylin and eosin (H&E). Some paraffin-embedded sections were utilized for immunohistochemistry (see below).
For plastic embedding the eyecups were dehydrated in a graded series of ethanol solutions and infiltrated with Immuno-Bed solution (Electron Microscopy Sciences, Ft. Washington, PA). After polymerization the block was cut from the superior ora ciliaris retinae through the optic nerve head to the inferior ora ciliaris retinae (Fig. 1) and 3 μm sections were cut and stained with H&E or toluidine blue for light microscopic analysis.
Figure 1.
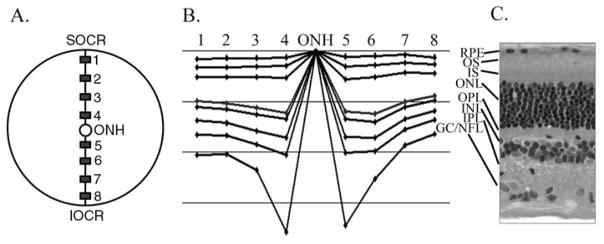
Measurement of retinal layer thicknesses. Plastic embedded vertical sections were taken through the eyecup extending from superior ora ciliaris retinae (SOCR), through the optic nerve head (ONH) to the inferior ora ciliaris retinae (IOCR). The thickness of retinal layers was measured at regions 1–8 (as described in the text and shown in A). The thickness of the retinal layers at the 8 regions were demonstrated graphically as shown in B. The horizontal lines are 50μm apart. C shows a cross section through the retina at the same scale as B. Key: RPE – retinal pigmented epithelium; OS – photoreceptor outer segments; IS – photoreceptor inner segments; ONL – outer nuclear layer; OPL – outer plexiform layer; INL – inner nuclear layer; IPL – inner plexiform layer; GC/NFL – combined ganglion cell and nerve fiber layer.
The retinal morphology was assessed over the full length of the plastic embedded retinal section from dorsal ora ciliaris retinae to ventral ora ciliaris retinae. The retinal sections were assessed to ensure they were transverse and if necessary the block was repositioned and additional sections made. To allow for measurements of the thickness of retinal layers, images were captured using a Nikon microphot-FXA microscope (Nikon Inc, Garden City, NY) and NeuroExplorer software (MicroBrightField Inc, VT) and measured using NeuroLucida software; version 3 (MicroBrightField Inc, VT). The thickness of the various retinal layers was measured at the sites shown in Fig. 1. Sites 1 and 8 and sites 4 and 5 were 500 μm from the edge of the ora ciliaris retinae or the optic nerve head respectively and sites 2 and 3 were evenly spaced between sites 1 and 4 dorsally and sites 6 and 7 between sites 5 and 8 ventrally. At each of the sites three separate measurements were performed over adjacent 100 μm lengths of retina and the mean of each retinal layer thickness calculated. Additionally, at each site the number of rows of photoreceptor nuclei in the ONL and the number of rod and cone cell bodies, identified by morphological features of their nuclei, were counted. In plastic-embedded sections cone and rod nuclei are readily differentiated. Cone nuclei are slightly larger and more ovoid in shape and are typically positioned adjacent to the outer limiting membrane. They have less dense and smaller condensations of heterochromatin than rod nuclei (rod nuclei typically have 2–3 dense heterochromatin clumps) and have lighter staining euchromatin.
Analysis of morphological data
The thickness of the retinal layers and number of photoreceptor nuclei per unit length were compared between affected dogs and age-matched controls using ANOVA. Independent analyses for each region and retinal layer were performed. The fixed effects included in the model were age and disease genotype. For measurement of retinal thickness, a random effect of dog was included to account for repeated measures (triplicates) within dog and age. For measurement of the number of cells, no random effects were considered and consequently a linear model of fixed effects was used. No covariance among ages was modeled as the measures at different ages corresponded to independent dogs. No variable transformation was done because the residual analyses revealed fulfillment of model assumptions (normality, heteroskedasticity) (data not shown). Data were deemed significant when P<0.05. All analyses were performed using SAS Proc Mixed software; SAS version 9.1 (SAS Institute Inc., Cary, NC).
Transmission Electron Microscopy
For TEM the eyecup was fixed as for plastic embedding and then post-fixed in osmium tetroxide, and embedded in resin consisting of Poly/Bed, Araldite, DDSA, and DMP-30 accelerator. Semi-thin sections (0.7 to 1 μm) were cut and stained with toluidine blue to check for integrity. Ultra-thin sections (0.5 μm) were cut with a diamond knife and stained with uranyl acetate and lead acetate and were examined with a Philips 301 transmission electron microscope.
Immunohistochemistry
Immunohistochemistry was performed on either paraffin-embedded sections or frozen sections mounted in OCT (see Table 1 Supplementary Information <INSERT URL>). For frozen sections they were fixed in 4% paraformaldehyde plus 3% sucrose in 0.1M phosphate buffer (PBS; pH 7.4) for 15 minutes at 4°C. The anterior segment removed and the posterior eyecup returned to the same fixative for 20 minutes, then washed three times in phosphate buffered saline (0.05M sodium phosphate, 195mM NaCl; pH 7.4). The eyecup was placed in PBS plus 30% sucrose for 24 hours then immersed in embedding medium (OCT-compound; Tissue-Tek).
Processing of paraffin-embedded sections
5μm sections were cut, air-dried overnight, de-paraffinized in xylene (twice) and gradually rehydrated. They were then incubated in a preheat antigen retrieval buffer (Citrate buffer, DakoCytomation, Carpinteria, CA) for 20 minutes at 97°C, cooled to 50°C and incubated in 50 mM TRIS-buffered saline (pH 7.6) for 5 minutes, followed by 10 minutes incubation with a protein-blocking agent (DakoCytomation, Carpinteria, CA) prior to application of the primary antibodies (see Table 1. for a list of antibodies used). The appropriate secondary antibody from the Labeled Streptavidin-Biotin 2 System, Horseradish Peroxidase (LSAB2 System-HRP, DakoCytomation, Carpinteria, CA) was used. Immunoreaction was visualized with 3,3′-diaminobenzidine substrate (Liquid DAB substrate chromogen system, DakoCytomation, Carpinteria, CA), and the sections were counterstained with hematoxylin (Gill III formula™, Surgipath Medical Industries Inc, Richmond, IL) and blued with 0.04% lithium carbonate. Images were captured using a Nikon Eclipse 80i Microscope equipped with Evolution MP 5.1 (Micropublisher 5.1) Megapixel Color digital camera (MediaCybernetics Inc., Bethesda MD). Images were optimized for color, brightness and contrast using Photoshop™ CS2.
Table 1.
Details of primary antibodies used for IHC.
| Antigen | Host | Target | Used on Paraffin (P) or Frozen (F) sections | Working concentration | Source |
|---|---|---|---|---|---|
| Bovine rhodopsin | Mouse monoclonal | Rod outer segments | P | 1:50 | R2-12N. A gift: Dr P Hargrave; U of Florida |
| Rat retina membrane preparation | Mouse monoclonal | Rod photoreceptors | P | 1:2 | RET-P1. Lab vision; Fremont, CA |
| Red/Green Opsin | Rabbit polyclonal | Red-green cone outer segments | F | 1:600 | Chemicon; Pittsburge, PA |
| GCAP-1 | Rabbit polyclonal | Cone photoreceptors | F | 1:800 | A Gift: Dr K Palczewski; U of Washington |
| Human cone arrestin | Rabbit polyclonal | Cone photoreceptors | P | 1:2000 | A gift: Drs C Craft & X Zhu, Mary D Allen Lab, Doheny Eye Institute, U of Southern California |
| Human PKC alpha | Mouse monoclonal | Rod bipolar cells | P & F | 1:50 | BD Bioscience; Rockville, MD |
| Human Hu-C/D | Mouse monoclonal | Horizontal, amacrine cells and subpopulation of ganglion cells | F | 1:200 | The Monoclonal Antibody Facility; U of Oregon |
| Rat calbindin | Rabbit polyclonal | Horizontal and some amacrine cells | P | 1:100 | Sigma Aldrich; St. Louis, Mo |
| Bovine Calbindin | Mouse monoclonal | Horizontal and some amacrine cells | F | 1:800 | Sigma Aldrich; St. Louis, MO |
| Human Calretinin | Rabbit polyclonal | Horizontal, amacrine cells and subpopulation of ganglion cells | F | 1:1000 | Swant; Bellinzona, Switzerland |
| Bovine GFAP | Rabbit polyclonal | Astrocytes and Muller cells (reactive) | P | 1:1600 | Dakocytomatio; Carpinteria, CA |
| Human Caspase 3 | Rabbit polyclonal | Caspase 3 expressing cells | P & F | 1:100 (P) 1:800 (F) |
Research Diagnostics Inc, Flanders, NJ |
Key: GFAP; Glial Fibrillary Acidic Protein, PKC; Protein Kinase C. GCAP; Guanylate Cyclase-Activating Protein.
Processing of frozen sections
From the OCT blocks 14 μm sections were cut in a vertical plane through the optic nerve head and thaw-mounted onto Super-Frost™ slides (Fisher Scientific Ltd, Leicestershire, UK), air-dried and stored at −20°C until use.
Primary antibodies used are listed in table 1. Sections were incubated for 24 hours at 20°C in a humidified chamber. The slides were washed in PBS, covered with secondary antibody solution, and incubated for 1 hour at 20°C in a humidified chamber. Secondary antibodies included goat-anti-rabbit-Alexa488, goat-anti-mouse Alexa488/568 and goat-anti-mouse-IgM Alexa568 (Molecular Probes Inc., Eugene, OR).
Photomicrographs were taken by using a Leica DM5000B microscope equipped with epifluorescence and a 12 megapixel Leica DC500 digital camera. Images were optimized for color, brightness and contrast, and double-labeled images overlaid by using Photoshop™ 6.0.
Caspase 3 staining
To increase the range of ages and number of retinae assessed for caspase 3 immunoreactivity both paraffin-embedded and OCT embedded frozen sections were processed for caspase 3 immunohistochemistry and positive controls of hyperplastic canine lymph node and a canine lymph node with B-cell lymphoma were used.
TUNEL Assay
Direct TUNEL labeling assay was performed on OCT-embedded frozen sections using In Situ cell death detection kit, rhodamine (Roche Diagnostics Corporation, Indianapolis, IN) to detect DNA strand breaks in apoptotic cells by using an optimized terminal transferase (TdT) to label free 3′OH ends in genomic DNA with rhodamine-dUTP. Samples were incubated with TUNEL reaction mixture (TdT and fluorescein-dUTP solution) at 37°C for 1 hour and incorporated rhodamine/fluorescein was visualized by fluorescence microscopy. Adjacent sections from the OCT blocks were stained for caspase 3 immunoreactivity.
cGMP PDE6 Assay
Retinas were dissected and immediately frozen in liquid nitrogen. Approximately 1/3 of each retina was homogenized in 160 μl of 10 mM Tris, pH 7.5, 0.5% Triton X-100. Membrane debris was pelleted at 15 K rpm for 15 minutes in a microcentrifuge. Protein content in each homogenate was determined with a protein assay kit (Biorad, Hercules, CA) and 30 μg of protein was used for each assay. PDE6 activity was assayed as previously described.17
Western Blot Analysis
Protein homogenates were prepared as described for PDE6 assays and approximately 30 μg of protein from each homogenates was separated in a 15.08% (C=0.5) low crosslinker SDS-PAGE 18 and transferred to PVDF membrane (BioRad, Hercules, CA). Immunoreactivity to PDE6 was detected by a commercially available rabbit PDE6 polyclonal antibody (MOE, CytoSignal Research, Irvine, CA) that recognizes mammalian rod PDE6 catalytic subunits strongly and the γ-subunit more weakly and shows no cross-reactivity with cone PDE6. Proteins were visualized using an ECF fluorescence detection kit (Amersham Pharmacia Biotech, Buckinghamshire, England).
RESULTS
Electroretinography
PDE6A mutant puppies have markedly reduced dark-adapted ERG amplitudes from the earliest ages measured (Figures 2A–D compares a normal and affected puppy ERG at 17 days of age). The normal dark-adapted canine ERG can be measured after eyelid opening (eyelids open at about day 14) and at this age is a predominantly a-wave response. When the ERG of PDE6A mutant puppies was measured shortly after eyelid opening the dark-adapted a-wave is significantly reduced (p<0.05) and the response threshold elevated (compare Fig. 2A and 2B; control and mutant puppies at 17 days of age). The light-adapted ERG just after eyelid opening was comparable between the affected and control puppies (Figures 2C and 2D). The b-wave in the normal control puppies was well developed by 3 weeks of age (data not shown) and by 4 weeks of age the ERG waveform resembled that of the adult in shape (Figure 2E and 2G). The PDE6A mutant puppies showed some increase in dark-adapted ERG amplitudes from the earliest time point but they were always markedly smaller and of delayed threshold compared to the normal controls (compare Figure 2E and 2F). Notable features of the dark-adapted ERG of the PDE6A mutant puppies (seen at 4 weeks of age in Figure 2F) were the markedly elevated response thresholds, a very small amplitude a-wave and a very reduced b-wave. The light-adapted responses of the mutant puppies are also altered with an obvious reduction in a-wave amplitude but a b-wave that was comparable in amplitude to control puppies (compare Figure 2G with 2H). The light-adapted b-wave of control and mutant puppies showed a photopic hill (a phenomenon whereby the b-wave intensity:response curve reaches a maximum and then decreases with increasing flash intensity).
Figure 2.

Representative dark-adapted (A, B, E, F, I & J) and light-adapted (to 30 cd/m2 white light for 10 minutes) (C, D, G, H, K & L) ERG intensity series of a control (A, C, E, G, I & K) and PDE6A mutant (B, D, F, H, J & L) puppy at 17 days (A–D), and 4 (E–H) and 6 (I–L) weeks of age. Key: Arrowheads indicate flash onset. Horizontal bar = 50 mSec, Vertical calibration bars are in microVolts. Flash intensities for dark-adapted were: −3.18, −2.98, −2.79, −2.6, −2.0, −1.6, −1.19, −0.79, −0.39, 0.0, 0.39, 0.85, 1.36, 1.9, 2.38, 2.82 log cdS/m2. Flash intensities for light-adapted were −0.39, −0.22, 0.0, 0.16, 0.39, 0.85, 1.36, 1.9, 2.38, 2.82 log cdS/m2. Note that in the 17 day old puppies (A–D) and the mutant puppies at 4 and 6 weeks of age (F, H, J and L) the tracings from the lower flash intensities are not shown.
By 6 weeks of age, the dark-adapted ERG of normal puppies had further matured showing larger oscillatory potentials (compare Figure 2E – normal at 4 weeks of age; with 2I – normal at 6 weeks of age). The abnormalities in the PDE6A mutant puppy ERG at 6 weeks of age were similar to those seen at 4 weeks of age.
At all ages examined it was notable that the dark-adapted and light-adapted waveforms of the mutant puppies were similar in amplitude and shape, both showing a relative lack of a-wave response and having a similar b-wave amplitude.
To further assess rod and cone photoreceptor responses we examined a dim white light flicker response at 5Hz to assess rod flicker responses and a 33Hz brighter white light flicker to assess cone flicker responses. Representative responses at different ages are shown in Figure 3. A rod flicker response could be recorded from normal control puppies from 3 weeks of age. However, rod-mediated flicker responses could not be recorded from PDE6A mutant puppies at any age. In both mutants and controls the cone flicker amplitude increased over the period of retinal maturation to peak at ~6 weeks of age, although from 4 weeks of age onwards the mean amplitudes of the cone flicker responses of the PDE6A mutant puppies was significantly reduced (data not shown). There was a difference in the shape of the cone 33Hz flicker responses between the control and PDE6A mutant puppies (for example compare the 7 week control and mutant puppies in Figure 3B).
Figure 3.
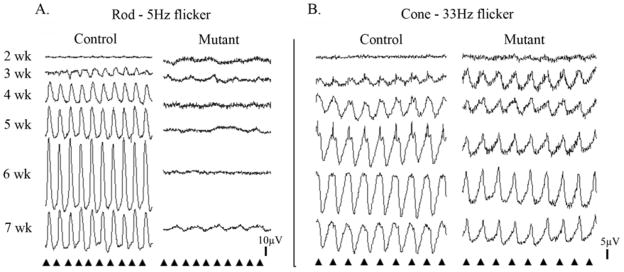
Representative rod and cone flicker responses of control and mutant puppies. A. Representative rod flicker responses (frequency 5Hz; intensity −1.6 log cdS/m2). First column = normal control, second column = PDE6A mutant puppies. B. Representative cone flicker responses (frequency 33 Hz; intensity 0.39 log cdS/m2). First column = normal control, second column = PDE6A mutant puppies. For both A and B the tracings from top to bottom are from 2, 3, 4, 5, 6 and 7 week old puppies. Arrowheads indicate the timing of the flashes.
To further compare the ERG responses of the PDE6A mutant puppies with those of normal controls we examined a- and b-wave intensity:response plots from 2 to 12 weeks of age (Figure 4 shows mean intensity:response plots at 3 and 7 weeks of age). The dark-adapted a- and b-wave curves of the mutant puppies were shifted to the right by 2 to 3 log units (reflecting the raised thresholds as shown in the raw ERG waveforms in Figure 2) and the amplitudes were reduced by at least one log unit. The mean dark-adapted a- and b-wave amplitudes from the mutant dogs reached peak levels at approximately 3 weeks of age (shown in Figure 4), at which time they were significantly smaller (P<0.05) than those of normal controls. The mean light-adapted a-wave amplitude of affected dogs was lower than that of controls at 3 weeks of age and with increasing age it further decreased; particularly at the higher flash intensities. The mean light-adapted b-wave of the mutant puppies, remained similar to that of controls up to 7 weeks of age (see Figure 4), however by 9 weeks of age it was significantly lower (P<0.05) than that of controls in response to the brighter flash intensities (data not shown). There was a continual slow deterioration in light-adapted b-wave responses with increasing age until the ERG was extinguished (data not shown).
Figure 4.

Log – log graphs of mean (+/− SEM) dark-adapted and light-adapted a- and b-wave intensity:response curves for normal (dashed line) and mutant (solid lines) 3 and 7 week old puppies. The x-axes are log cdS/m2 and the y-axes microVolts.
The same ERG criteria were recorded from 5 puppies heterozygous for the PDE6A mutation. There were no significant differences in the criteria examined here between the carriers and the homozygous normal controls (data not shown).
Retinal morphology (Figures 5–8)
Figure 5.

Progression of outer retinal degeneration in PDE6A mutant puppies. Control (A, C, E, G and I) and mutant (B, D, F, H and J) retinal sections at 2 (A and B), 4 (C and D), 7 (E and F) and 9 (G and H) weeks of age from the central retina (region 4 - Figure 1). I and J; EM at 31 days of age. Sections from normal and mutant are comparable at 2 weeks of age (A and B). By 4 weeks of age there is gross distortion of developing photoreceptor outer segments (D) and dying and pyknotic photoreceptor nuclei are present (arrowheads and arrows respectively). At 7 weeks of age (F) the changes are more severe with further loss of outer segments and thickening of the remaining inner segments, the outer nuclear layer is further thinned. At 9 weeks of age (H) only a few thin outer segments are visible and the outer nuclear layer is thinner and several pyknotic nuclei are present. Note that the remaining photoreceptor inner and outer segments are predominantly of cones and that the inner segments appear abnormally thickened. I and J are EM images of the outer segments in a normal and mutant retina at 31 days of age. The normal regular arrangement of photoreceptor outer segments is lost in the mutant retina with distortion of outer segment discs. A relatively well preserved outer segment (most likely cone) is indicated by an asterix. Arrows indicate remaining outer segments with distorted disc material. The arrowhead indicates part of a thickened inner segment. A–H size bar = 25 μm. I and J size bars = 2 μm.
Figure 8.
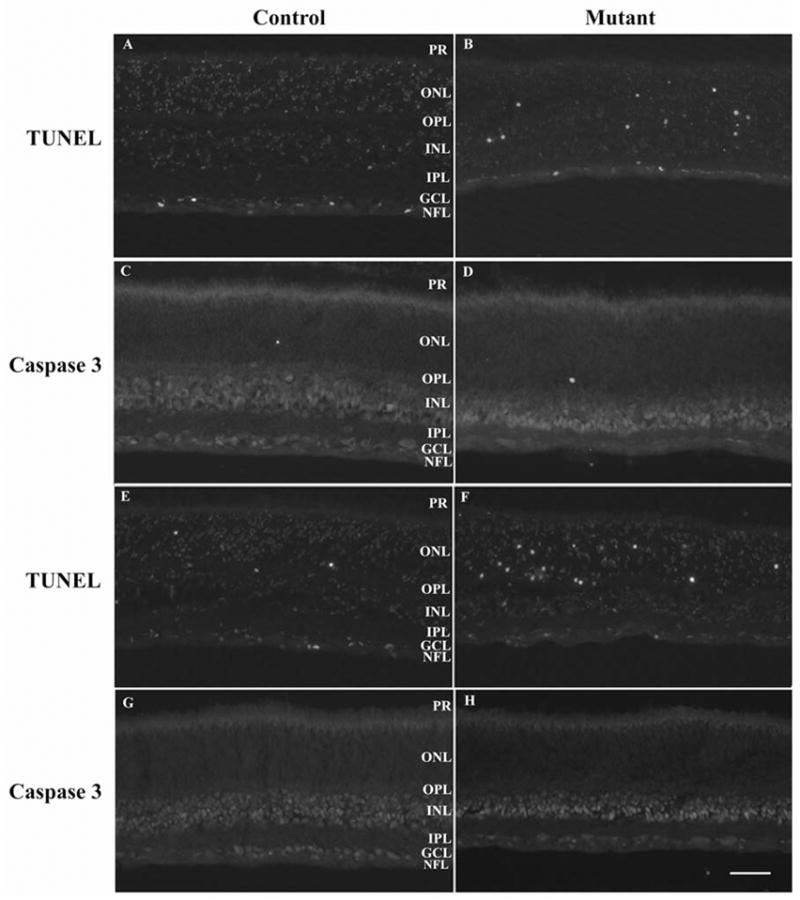
TUNEL and caspase 3 staining. A–D 25 day old control (A and C – sections from same eye) and mutant (B and D – sections from same eye). E–F 28 day old control (E and G – sections from same eye) and mutant (F and H – sections from same eye). TUNEL stained (A, B, E & F) or caspase 3 stained (C, D, G & H). Size bar = 50μm
Representative photomicrographs allowing comparison of the morphology of the outer retina from the posterior pole of the eye (region 4, see Figure 1) at 2, 4, 7 and 9 weeks of age are shown in Figure 5, and a comparison of different regions of the retina at 5 and 16 weeks of age is made in Figure 6.
Figure 6.
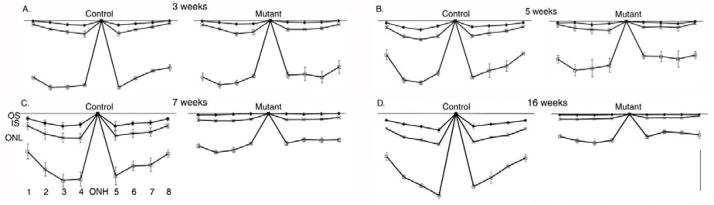
Changes of thickness of outer retinal layers across the retina with age. Mean thickness (+/− SEM) of outer segment layer (OS), inner segment layer (IS) and outer nuclear layer ONL in control and mutant puppies at 3 (A), 5 (B), 7 (C) and 16 (D) weeks of age. The thicknesses are from regions 1–8 (labeled on C) as described in Figure 1. ONH = optic nerve head. Size bar = 20 μm. For clarity the thickness of the inner retinal layers are not shown.
At 10 days of age the morphological features of the normal and mutant retinas were similar. In the central retina photoreceptor inner segments could be seen budding through the outer limiting membrane (not shown). At 2 weeks of age inner segments were well formed in the central retina of both controls and mutant puppies (Figure 5A & B). At this age the photoreceptor nuclei are elongated in shape. Some dying nuclei were evident in the controls (normal apoptotic death seen in the developing retina) as well as in the sections from affected dogs (compare Figures 5A and 5B). With further development of the retina (shown in Figure 5C–H at 4, 7 and 9 weeks of age) the normal control puppies developed elongated, regularly arranged outer segments, whereas outer segments in the mutant puppies did not mature normally. At 4 weeks of age they were obviously stunted and distorted (Figure 5D). With increasing age the outer segments of the mutant puppies appeared more distorted and less obvious and the inner segments appeared swollen (Figures 5F & H). In the mutant puppies by 9 weeks of age, the remaining photoreceptor outer and inner segments had morphological features suggesting they were predominantly cones (Figure 5H). The remaining inner segments appeared thickened and club shaped (Figures 5J and 5H). Immunohistochemistry was performed to investigate the survival of rods and cones (described below). TEM showed there was distortion of outer segments and disc disorganization in the mutant puppies with both rods and cones affected (compare Figure 5I – control, with Figure 5J – mutant, both at 31 days of age). An obvious reduction in the number of photoreceptor nuclei rows developed in the mutant retinas. By 9 weeks of age the number of rows was reduced from the typical 10 or 11 rows in the normal central retina to 5 or 6 rows (Figure 5G and H) and this was obvious across the length of the retina (Figure 6 M–P). The thinning of retinal layers and loss of photoreceptor nuclei was quantified (see below). Numerous photoreceptor nuclei showing evidence of cell death with rounding of nuclei and altered chromatin staining and some with pyknosis were apparent in the sections at 4 and 5 weeks of age (Figure 5D white arrows, Figure 6 E–H). Similar appearing nuclei were also present in the sections from mutant puppies at 7 and 9 weeks of age (Figures 5F and H) and involved all retinal regions examined (see Figure 6 E–H). Photoreceptor cell death was further investigated with TUNEL and caspase 3 staining (see below).
Similar features of outer retinal degeneration developed across all retinal regions (Supplemental Information Figure 1 <INSERT URL>).
Measurement of retinal layer thickness and number of photoreceptor nuclei
To further investigate the degeneration of the retina measurements of retinal layers at 8 different regions (as shown in Figure 1) was performed on mutant and control puppies at 3, 5, 7 and 16 weeks of age (n=3 at each age). Over this time period only the outer segment, inner segment and outer nuclear layer thicknesses of the mutant puppies became significantly reduced compared to the controls (for simplicity only outer segment, inner segment and outer nuclear layer thicknesses are shown in Figure 6). Although the inner retinal layers were relatively preserved during the earlier stages of the retinal degeneration eventually all retinal layers became thinned (data not shown). The decrease in mean outer nuclear layer thickness at 7 (Figure 6C) and 9 (data not shown) weeks of age was not as marked as would have been anticipated considering the reduction in the number of rows of photoreceptor nuclei counted in the histological sections. This may be because of a reduction in nuclei stacking density in the outer nuclear layer as gaps appeared due to photoreceptor cell loss (for a histological example see Figure 5F). To obtain a more accurate quantification of photoreceptor nuclei loss the mean number of rod and cone nuclei per 100 μm length of retina was counted for each retinal region (a scatter plot of the results for the central retina are shown in Figure 7). There was a progressive decrease in the numbers of rod photoreceptor nuclei over the first 80 days of life for all retinal regions assessed (as shown in Figure 7 for the central retina). Whereas the number of cone photoreceptor nuclei per unit length showed no statistically significant changes over the first 80 days of life, although there was a trend towards decreasing numbers per unit length of retina.
Figure 7.
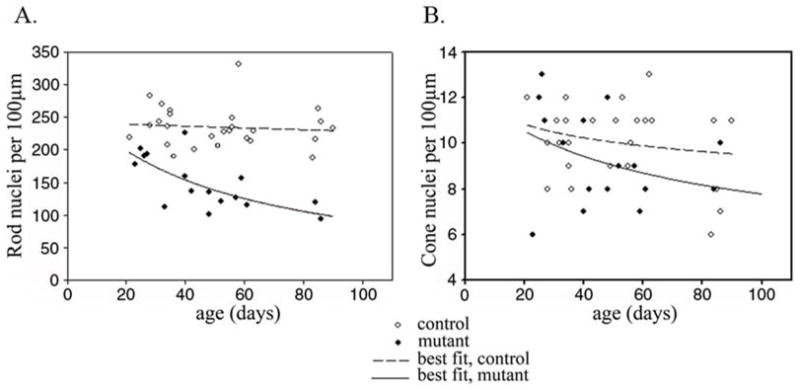
The number of rod and cone nuclei with age per unit length of retina. A. A scatter plot of number of rod and B. Cone nuclei per 100μm length of retina (central retina – region 4 – see Figure 1) plotted against age. Filled symbols represent mutant dogs and hollow symbols controls. A line of best fit to the data was calculated.
TUNEL and Caspase 3 Labeling
Examination of retinal sections by light microscopy, measurements of retinal layer thickness and counts of photoreceptor nuclei showed affected dogs had a progressive loss of rod photoreceptors and a much more gradual loss of cone photoreceptors. Light microscopy showed the presence of dying photoreceptor nuclei from 3 to 4 weeks of age (shown in Figure 5D at 4 weeks of age). To investigate the mechanism of cell death TUNEL and caspase 3 staining was performed (examples at 25 and 28 days of age are shown in Figure 8) and the ONL examined by TEM (data not shown). TUNEL staining showed that there was a low frequency of TUNEL positive cells in the retina of young normal puppies. Some TUNEL positive cells were present in the retinas from mutant dogs at all ages tested but occurred in greatest numbers in the ONL between 25 and 28 days of age (Figures 8B & F). Caspase 3 staining of adjacent sections from the same eyes did not show significant amounts of caspase 3 immunoreactivity. Caspase 3 staining of sections from paraffin-embedded retinas of various ages (see Table 1 Supplementary Information <INSERT URL>) was also negative (data not shown). TEM examination of the ONL showed that there were nuclei with features indicative of various stages of apoptosis in sections from 21 days of age with a peak in numbers of affected nuclei at around 27 days of age. In the early stages of cell death the nuclei were swollen and spherical in shape (at 3 to 4 weeks of age the photoreceptor nuclei of normal dogs in histological sections have an elongated shape prior to maturing to the adult approximately circular shape) with densely fragmented heterochromatin and pale euchromatin. In the later stages of cell death the fragmented heterochromatin became clustered adjacent to the nuclear membrane. The dying nuclei then became pyknotic with a smaller and denser nucleus. Dead cells in the process of being removed were pale staining and without distinct detail of organelles.
Immunohistochemistry (Figure 9)
Figure 9.
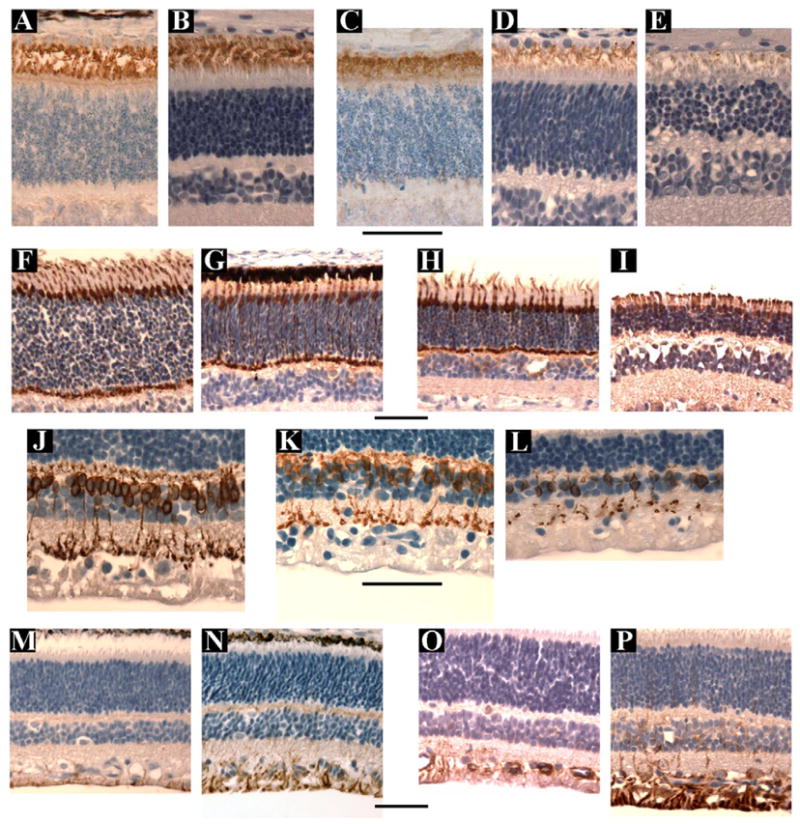
A–E. Anti- rod opsin staining using the R2-12N antibody from control retinae (A & B) at 18 days (A) & 8 weeks (B) of age and mutant retinae (C–E) at 3weeks (C), 4 weeks (D) and 8 weeks (E) of age. Note that in the affected retinae by 4 weeks of age (D) the amount of rod opsin positive outer segment material is reduced and this is further reduced by 8 weeks of age (E).
F–I. Anti-cone arrestin antibody staining from control retinae at 5 (F) and 7 (H) weeks of age and mutant retinae at 5 (G) and 7 (I) weeks of age. The antibody stains the cone inner and outer segments, nuclei and pedicles. The number of cones are preserved over this time period, although as shown by regular light microscopy the outer segments became stunted and the inner segments thickened (Figure 5H).
J – L. Anti-protein kinase C alpha antibody staining from a control retina at 7 weeks (J) and mutant retinae at 5 (K) and 12 (L) weeks of age. The affected retinae has a decreasing number of PKCα immunoreactive soma with increasing age.
M-P. Anti-GFAP antibody staining from control retinae at 3 (M) and 5 (O) weeks of age and from mutant retinae at 3 (N) and 5 (P) weeks of age Normal retina shows immunoreactivity to this antibody in the ganglion cell and nerve fiber layers. The mutant retina show marked Müller cell activation with increased GFAP immunoreactivity apparent at 3 weeks of age (N) and further increased by 5 weeks of age (P).
Size bars = 50μm
Immunohistochemistry (IHC) was performed to monitor changes in cell populations within the retina of affected dogs.
Two different antibodies against rhodopsin were used. A mouse monoclonal against bovine rod opsin (R2-12N - a gift from P Hargrave, University of Florida) stained rod outer segments in the normal and affected dog. The second was a mouse monoclonal antibody raised against a cell membrane preparation from adult rat retina (RET-P1, LabVision) that reacts to the N terminus of rhodopsin.19 This antibody stained the entire rod photoreceptor from outer segment to spherule. Figure 9A–D shows the results using the R2-12N anti-opsin antibody at 5 and 9 weeks of age. The rod opsin staining of the mutant retinas confirmed the reduction in the rod outer segment lengths compared to normal. At 5 weeks of age there was a marked reduction in the amount of rod opsin immunoreactive outer segment material present and at 9 weeks of age only scant, stunted IR outer segment material remained. Evidence of opsin mislocalization was not seen in the sections examined. The anti-cone arrestin (gift from Drs Cheryl Craft and Xuemei Zhu, Mary D. Allen Lab, Doheny Eye Institute, University of Southern California) stained cone cell bodies, inner and outer segments and cone pedicles. The relative preservation of cone photoreceptors early in the course of the disease was confirmed by the anti-cone arrestin immunoreactivity. Cone inner and outer segments were preserved (Figure 9H) although the inner segments were swollen and the outer segments stunted.
Staining for rod bipolar cells with anti-PKCα antibody showed a reduction in the number of rod bipolar cells in the mutant retinas from as early as 5 weeks of age (representative sections in Figure 9K) compared to normal controls. This was the only indication of changes in the inner retinal cells neurons early in the disease process. Staining with other antibodies including calretinin, calbindin, Hu C/D did not reveal any notable differences in staining patterns between mutant and control retinas during the first 16 weeks of age (data not shown).
Müller glial reactivity, as evidenced by increased immunoreactivity (IR) to anti-GFAP antibody, developed early in the disease process. At 3 weeks of age the degree of anti-GFAP IR was similar to controls (Figure 9L) but by 5 weeks of age there was a marked increase in IR (Figure 9N).
Western Blot and Cyclic GMP PDE6 assay
Expression of PDE6 in retinal homogenates of normal and mutant retinas was examined by Western analysis. As shown in Figure 10A analysis of mutant retina homogenates from 10–84 day old retinas failed to show significant amounts of the catalytic subunits. In contrast a single band representing both catalytic subunits of molecular weight similar to bovine PDE6 was readily identifiable in PDE6A mutant heterozygotes (carriers) and in homozygous normal dog retinas. As expected the levels of expression were highest when the retina was fully mature (see days 56 and 84 in carrier and normal – Figure 10A) and no expression was detectable during early photoreceptor development (see day 6 in the carrier – Figure 10A). These results are consistent with the absence of PDE6A and at least marked reduction of the beta-subunit in the mutant retina. To establish the absence of PDE6 activity in the mutant dogs, PDE6 assays were performed on retinal homogenates. Consistent with the Western results minimal cGMP hydrolyzing activity was observed in retinal homogenates from mutant puppies at any age examined (Figure 10B). Heterozygotes and homozygous normal control dogs showed an increase in activity with increase in age that parallels photoreceptor development and maturation.
Figure 10.
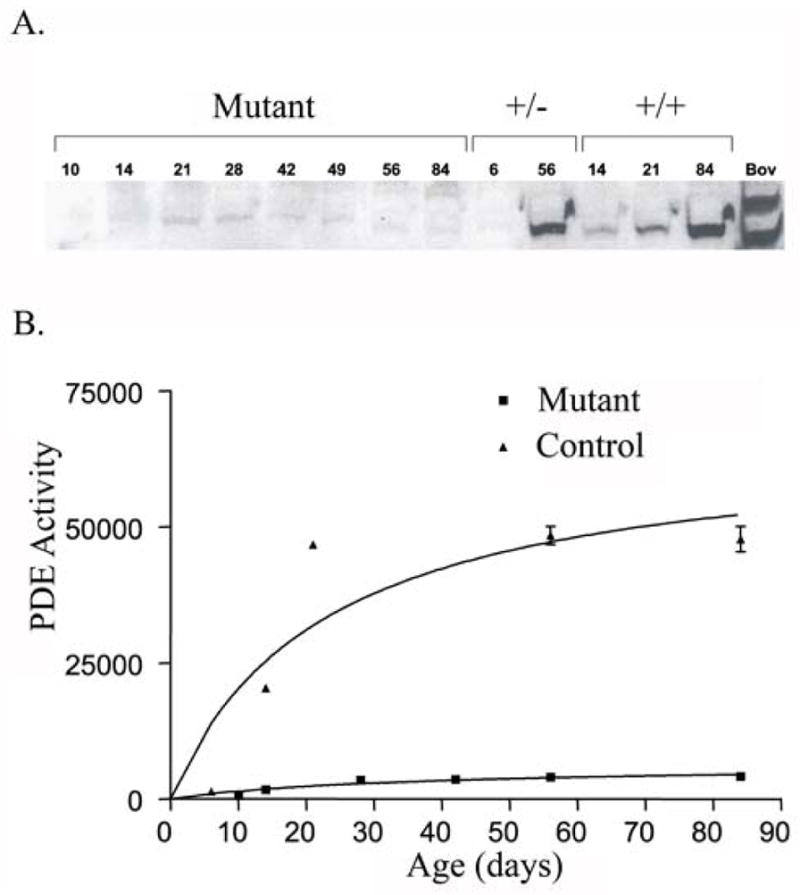
PDE6 protein levels and activity in mutant and control retinas. A. Western blot detection of PDE6 catalytic subunits. Due to the similarity in molecular weight, canine PDE6 α and β subunits were not resolved like the bovine subunits. PDE6 is only detectable in normal dogs and heterozygote carriers.
B. PDE6 activity assays of PDE6A mutant and control dog retinas. Only minimal activity near background was observed in retinas from the PDE6A mutant dog retina.
Key: +/− = retinal extract from dogs heterozygous for the PDE6A mutation.
+/+ = retinal extract from homozygous normal controls
DISCUSSION
PDE6A mutant dogs failed to develop normal rod photoreceptor function as assessed by electroretinography, most likely due to the lack of rod PDE6 enzymatic activity resulting in a failure of rod phototransduction. Dark-adapted ERG responses of the mutant dogs had very reduced a- and b-wave amplitudes and delayed threshold of responses and there was an absence in rod flicker response at all ages. The single flash dark-adapted ERG amplitudes were similar to those of the light-adapted (cone-mediated) ERG, reflecting the severe reduction or lack of rod ERG responses. Slight differences in threshold and waveform shape between dark-adapted and light-adapted ERGs were noted in the mutant puppies. These may be due to the difference in response between dark- and light-adapted cones rather than the presence of some residual rod activity. Differences in dark- and light-adapted cone ERGs thresholds have previously been shown in an ERG study of the rhodopsin knockout mouse, a model that does not develop rod outer segments and has a lack of rod function. The threshold of the dark-adapted cone response in the rhodopsin knockout mouse was 1.27 log units below that of light-adapted cones.20
PDE6A mutant puppies start to develop rod outer segments but this becomes halted, leaving the outer segments shortened and with disorganized and distorted disc material. Rhodopsin is present in the rod outer segments of mutant puppies at 3 weeks of age but from then on outer segments are lost and there is loss of rhodopsin-positive outer segment material. This occurs during the time period that the outer segments elongate in the normal dog with retinal maturation (the outer segments reach peak length in normal puppies at approximately 7 weeks of age). Following the arrest of photoreceptor outer segment development rod cells start to die and by 4 weeks of age many rod photoreceptor nuclei exhibiting various stages of cell death are visible in the outer nuclear layer. Loss of rod nuclei resulted in thinning of the outer nuclear layer so that by approximately 9 weeks of age the number of rows of photoreceptor nuclei was about 50% that of normal controls. There was an initial phase of rapid loss of rod photoreceptors that was followed by a period of slower loss of the remaining rods and a more gradual loss of cones. These dynamics of cell loss are similar to the exponentially decreasing curve described for neuronal loss, where there is a constant or declining risk of cell loss.21, 22 It was noted that the thickness of the ONL did not initially reflect the decrease in photoreceptor cell bodies detectable by direct counting. This was because as photoreceptors died they left spaces in the outer nuclear layer so it had a lower density of photoreceptor nuclei, although it later condensed down and became narrowed. A similar finding was also reported in a dog model of X-linked retinitis pigmentosa due to a frame-shift mutation in RPGR.23 This suggests that the counting of photoreceptor nuclei provides a more accurate estimation of photoreceptor loss compared to measuring the thickness of the outer nuclear layer. TUNEL staining indicated that, similar to other photoreceptor degeneration models, rod cell death occurred by apoptosis.24 The lack of caspase 3 immunoreactivity in sections from puppies of several different ages suggests that the majority of apoptosis occurred via a pathway independent of caspase 3. The role of caspase 3 in apoptosis in the rd1 mouse has been studied in some detail. An initial study by Jomary et al using immunohistochemistry suggested that caspase 3 activation occurred.25 This result was directly contradicted by a study by Doonan et al using Western blotting and an assay for caspase 3 that relies on cleavage of a substrate, concluding that photoreceptor apoptosis was independent of caspase 3.26 Further support for the importance of caspase-independent apoptosis in the rd1 mouse was provided by a study that demonstrated that apoptosis still occurred in mice that were double homozygotes for caspase 3 knockout and rd1,27 although some role for caspase 3 was suggested because the double knockout mice had a delay in retinal degeneration compared to rd1 mice. Further studies are required to elucidate the precise pathways responsible for photoreceptor cell death in the PDE6A mutant dog.
Previous studies utilizing heterologous expression of PDE6 indicated that the presence of all of the PDE6 subunits were required for functional expression of the enzyme.17, 28, 29 In the mutant puppies, PDE activity assays showed near background levels of cGMP hydrolysis in retinal homogenates obtained from affected dogs at ages ranging from 10 days to 12 weeks (Figure 10B). Residual activity is likely due to the presence of minor amounts of other cGMP hydrolyzing PDEs in the photoreceptor inner segments and other cells of the retina. However, we cannot rule out the possibility that some of the residual activity is due to remaining cone outer segment PDE6 activity. The reduction in PDE activity correlates with the marked reduction or absence of catalytic subunits in the same retina samples as judged by Western analysis (Figure 11A). The faint bands apparent in some of the lanes loaded with homogenate from mutant retinas are unlikely to represent PDE6 subunit, because only in the lanes containing carrier and unaffected sample where signal was apparent was the low molecular weight PDE6G subunit also detected (data not shown). Thus, it appears that the presence of PDE6A may be required for normal formation of the beta and gamma subunits. This is in contrast with the situation in models with a lack of formation of either the beta or gamma PDE6 (for example the rcd1 Irish Setter and rd1 mouse both with null mutations of PDE6B and the PDE6G knockout mouse) where the remaining PDE6 subunits are present prior to photoreceptor loss.30, 31 However the situation is complex as studies of mice engineered with a PDE6G missing the last seven amino acids had a marked reduction in the protein levels of both PDE6A and PDE6B32 whereas in mice with a complete absence of PDE6G the PDE6A/PDE6B dimer still formed, although protein levels were decreased by about one fourth from wild type levels possibly due to the arrest in development of photoreceptors. Also recent work has shown that chaperone proteins are also required for PDE6 assembly.33 AIPL1, which functions as part of a chaperone heterocomplex,34 is also implicated in processing farnesylated proteins such as PDE6A.35–37 It is conceivable that in the absence of PDE6A the chaperone system does not support the other PDE6 subunits leading to their degradation, this could be an explanation of why the other PDE6 subunits are not detected in PDE6A mutant retinas prior to photoreceptor degeneration while they are present in both PDE6B and PDE6G mutant retinas.
The studies reported here do not specifically address how loss of PDE6 activity triggers apoptosis, however it is reasonable to speculate that the mechanism of degeneration involves elevated cGMP levels analogous to that observed in rd1 mice,38 which would include this disorder in the group of disorders characterized as metabolic overload.39
Similarly to other models resulting from mutations in rod-specific genes the loss of rod photoreceptors is followed by a slower loss of cones. It is of note that the cone a-wave is reduced in amplitude very early in the disease process in this model prior to any detectable decrease in cone photoreceptor numbers. The a-wave reduction may be due to the stunting of cone outer segments that is detectable early in the course of the disease. In addition to outer segment stunting the effect of the altered environment on the cone photoreceptors was reflected by marked inner segment thickening, a feature also described in the rcd1 Irish setter dog.30
During the stages of degeneration examined in the current study there were no significant changes in inner retinal layer thicknesses, although in older mutant dogs thinning of all retinal layers occurs (data not shown). Immunostaining of inner retinal neurons using calretinin, calbindin, and HuC/D did not show any differences between affected and control retinas at the ages reported here. It is anticipated that changes would be present when later disease stages are examined. Staining for rod bipolar cells with PKCalpha showed some differences as the disease progressed, with sections from affected retinas showing reduced numbers of rod bipolar cells compared to control retinas. Detailed quantification of PKCalpha staining cells and additional time points are required to follow the changes in bipolar cell numbers. Other studies have shown that rod bipolar cells required the input from rods to maintain their normal morphology and function and when that is lost develop changes such as dendritic sprouting.40, 41 In view of the importance of rod input to rod bipolar cells it would not be surprising if they prove to be the first class of inner retinal neuron to show abnormalities in this model with its early loss of rod photoreceptors. Activation of Müller glial cells, reflected by increased GFAP immunoreactivity, is an early feature of the degeneration. This is a common occurrence in degenerating retinas 23, 42–44 and is likely to be secondary to photoreceptor loss; a recent study indicated that damaged photoreceptors release endothelin 2, which in turn stimulates the reactivity of Müller glia.45
The ERG changes and progression of histopathological changes in the PDE6A mutant dog are very similar to those previously described in the rcd1 Irish setter.6–8 The diminution of the cone a-wave prior to a reduction in cone b-wave, which is a feature of the PDE6A mutant puppy phenotype, was not reported in the Irish setter model, although the published studies of that model only show results from a limited ERG study making a direct comparison difficult. The main difference that we detected between the two models is the lack of the other PDE6 protein subunits in the PDE6A mutant dog in contrast to the situation in the rcd1 dog. Further studies to investigate how PDE6 subunits are chaperoned may shed further light on to this difference and makes PDE6A mutant models important for further study.
Supplementary Material
Acknowledgments
Supported by National Eye Institute Grant EY14160, MidWest Eye Banks, Michigan State University Companion Animal Funds and PureBred Dog Endowment Fund.
Ralph Common for expertise preparing plastic and resin embedded sections. Janice Forcier for veterinary technician expertise in all aspects of handling and caring for the dogs. Dr Cheri Johnson for expertise in canine reproduction and Dr Bryden Stanley for expertise in delivering puppies.
References
- 1.Suber ML, Pittler SJ, Qin N, et al. Irish setter dogs affected with rod-cone dysplasia contain a nonsense mutation in the rod cGMP phosphodiesterase beta-subunit gene. Proc Natl Acad Sci U S A. 1993;90:3968–3972. doi: 10.1073/pnas.90.9.3968. [DOI] [PMC free article] [PubMed] [Google Scholar]
- 2.Clements PJ, Gregory CY, Peterson-Jones SM, Sargan DR, Bhattacharya SS. Confirmation of the rod cGMP phosphodiesterase beta subunit (PDE beta) nonsense mutation in affected rcd-1 Irish setters in the UK and development of a diagnostic test. Curr Eye Res. 1993;12:861–866. doi: 10.3109/02713689309020391. [DOI] [PubMed] [Google Scholar]
- 3.Dekomien G, Runte M, Godde R, Epplen JT. Generalized progressive retinal atrophy of Sloughi dogs is due to an 8-bp insertion in exon 21 of the PDE6B gene. Cytogenet Cell Genet. 2000;90:261–267. doi: 10.1159/000056785. [DOI] [PubMed] [Google Scholar]
- 4.Petersen-Jones SM, Entz DD, Sargan DR. cGMP phosphodiesterase-α mutation causes progressive retinal atrophy in the Cardigan Welsh corgi dog. Invest Ophthalmol Vis Sci. 1999;40:1637–1644. [PubMed] [Google Scholar]
- 5.Zangerl B, Goldstein O, Lindauer SJP, et al. Novel Retinal Gene (PRCD) Causes Progressive Rod-Cone Degeneration in Canines and Humans. Invest Ophthalmol Vis Sci. 2006;47:2972. [Google Scholar]
- 6.Aguirre GD, Rubin LF. Rod-cone dysplasia (progressive retinal atrophy) in Irish setters. J Am Vet Med Assoc. 1975;166:157–164. [PubMed] [Google Scholar]
- 7.Aguirre GD, Farber D, Lolley R, et al. Retinal degeneration in the dog. III. Abnormal cyclic nucleotide metabolism in rod-cone dysplasia. Exp Eye Res. 1982;35:625–642. doi: 10.1016/s0014-4835(82)80075-4. [DOI] [PubMed] [Google Scholar]
- 8.Barbehean E, Gagnon C, Noelken D, et al. Inherited rod-cone dysplasia: Abnormal distribution of cyclic GMP in visual cells of affected Irish setters. Exp Eye Res. 1988;46:149–159. doi: 10.1016/s0014-4835(88)80073-3. [DOI] [PubMed] [Google Scholar]
- 9.Pearce-Kelling SE, Aleman TS, Nickle A, et al. Calcium channel blocker D-cis-diltiazem does not slow retinal degeneration in the PDE6B mutant rcd1 canine model of retinitis pigmentosa. Mol Vis. 2001;7:42–47. [PubMed] [Google Scholar]
- 10.Tao W, Wen R, Goddard MB, et al. Encapsulated cell-based delivery of CNTF reduces photoreceptor degeneration in animal models of retinitis pigmentosa. Invest Ophthalmol Vis Sci. 2002;43:3292–3298. [PubMed] [Google Scholar]
- 11.Guven D, Weiland JD, Fujii G, et al. Long-term stimulation by active epiretinal implants in normal and RCD1 dogs. J Neural Eng. 2005;2:S65–S73. doi: 10.1088/1741-2560/2/1/009. [DOI] [PubMed] [Google Scholar]
- 12.Dryja TP, Rucinski DE, Chen SH, Berson EL. Frequency of mutations in the gene encoding the alpha subunit of rod cGMP-phosphodiesterase in autosomal recessive retinitis pigmentosa. Invest Ophthalmol Vis Sci. 1999;40:1859–1865. [PubMed] [Google Scholar]
- 13.Riazuddin SA, Zulfiqar F, Zhang Q, et al. Mutations in the gene encoding the alpha-subunit of rod phosphodiesterase in consanguineous Pakistani families. Mol Vis. 2006;12:1283–1291. [PubMed] [Google Scholar]
- 14.Huang SH, Pittler SJ, Huang X, Oliveira L, Berson EL, Dryja TP. Autosomal recessive retinitis pigmentosa caused by mutations in the α subunit of rod cGMP phosphodiesterase. Nat Genet. 1995;11:468–471. doi: 10.1038/ng1295-468. [DOI] [PubMed] [Google Scholar]
- 15.Petersen-Jones SM, Entz DD. An improved DNA-based test for detection of the codon 616 mutation in the alpha cyclic GMP phosphodiesterase gene that causes progressive retinal atrophy in the Cardigan Welsh Corgi. Vet Ophthalmol. 2002;5:103–106. doi: 10.1046/j.1463-5224.2002.00223.x. [DOI] [PubMed] [Google Scholar]
- 16.Mentzer AL, Eifler D, Montiani-Ferreira F, Tuntivanich N, Forcier JQ, Petersen-Jones SM. Influence of recording electrode type and reference electrode position on the canine electroretinogram. Doc Ophthalmol. 2005;111:95–106. doi: 10.1007/s10633-005-4517-7. [DOI] [PubMed] [Google Scholar]
- 17.White JB, Thompson WJ, Pittler SJ. Characterization of 3′,5′ cyclic nucleotide phosphodiesterase activity in Y79 retinoblastoma cells: absence of functional PDE6. Mol Vis. 2004;10:738–749. [PubMed] [Google Scholar]
- 18.Baehr W, Devlin MJ, Applebury ML. Isolation and characterization of cGMP phosphodiesterase from bovine rod outer segments. J Biol Chem. 1979;254:11669–11677. [PubMed] [Google Scholar]
- 19.Hargrave PA, Adamus G, Arendt A, et al. Rhodopsin’s amino terminus is a principal antigenic site. Exp Eye Res. 1986;42:363–373. doi: 10.1016/0014-4835(86)90030-8. [DOI] [PubMed] [Google Scholar]
- 20.Toda K, Bush RA, Humphries P, Sieving PA. The electroretinogram of the rhodopsin knockout mouse. Vis Neurosci. 1999;16:391–398. doi: 10.1017/s0952523899162187. [DOI] [PubMed] [Google Scholar]
- 21.Clarke G, Collins RA, Leavitt BR, et al. A one-hit model of cell death in inherited neuronal degenerations. Nature. 2000;406:195–199. doi: 10.1038/35018098. [DOI] [PubMed] [Google Scholar]
- 22.Clarke G, Lumsden CJ, McInnes RR. Inherited neurodegenerative diseases: the one-hit model of neurodegeneration. Hum Mol Genet. 2001;10:2269–2275. doi: 10.1093/hmg/10.20.2269. [DOI] [PubMed] [Google Scholar]
- 23.Beltran WA, Hammond P, Acland GM, Aguirre GD. A Frameshift Mutation in RPGR Exon ORF15 Causes Photoreceptor Degeneration and Inner Retina Remodeling in a Model of X-Linked Retinitis Pigmentosa. Invest Ophthalmol Vis Sci. 2006;47:1669–1681. doi: 10.1167/iovs.05-0845. [DOI] [PubMed] [Google Scholar]
- 24.Chang G-Q, Hao Y, Wong F. Apoptosis: Final common pathway of photoreceptor death in rd, rds and rhodopsin mutant mice. Neuron. 1993;11:595–605. doi: 10.1016/0896-6273(93)90072-y. [DOI] [PubMed] [Google Scholar]
- 25.Jomary C, Neal MJ, Jones SE. Characterization of cell death pathways in murine retinal neurodegeneration implicates cytochrome c release, caspase activation, and bid cleavage. Mol Cell Neurosci. 2001;18:335–346. doi: 10.1006/mcne.2001.1036. [DOI] [PubMed] [Google Scholar]
- 26.Doonan F, Donovan M, Cotter TG. Caspase-independent photoreceptor apoptosis in mouse models of retinal degeneration. J Neurosci. 2003;23:5723–5731. doi: 10.1523/JNEUROSCI.23-13-05723.2003. [DOI] [PMC free article] [PubMed] [Google Scholar]
- 27.Zeiss CJ, Neal J, Johnson EA. Caspase-3 in postnatal retinal development and degeneration. Invest Ophthalmol Vis Sci. 2004;45:964–970. doi: 10.1167/iovs.03-0439. [DOI] [PubMed] [Google Scholar]
- 28.Qin N, Pittler SJ, Baehr W. In vitro isoprenylation and membrane association of mouse rod photoreceptor cGMP phosphodiesterase alpha and beta subunits expressed in bacteria. J Biol Chem. 1992;267:8458–8463. [PubMed] [Google Scholar]
- 29.Piriev NI, Yamashita C, Samuel G, Farber DB. Rod photoreceptor cGMP-phosphodiesterase: analysis of alpha and beta subunits expressed in human kidney cells. Proc Natl Acad Sci U S A. 1993;90:9340–9344. doi: 10.1073/pnas.90.20.9340. [DOI] [PMC free article] [PubMed] [Google Scholar]
- 30.Buyukmihci N, Aguirre GD, Marshall J. Retinal degenerations in the dog II. Development of the retina in rod-cone dysplasia. Exp Eye Res. 1980;30:575–591. doi: 10.1016/0014-4835(80)90041-x. [DOI] [PubMed] [Google Scholar]
- 31.Tsang SH, Gouras P, Yamashita CK, et al. Retinal degneration in mice lacking the γ subunit of the rod cGMP phosphodiesterase. Science. 1996;272:1026–1029. doi: 10.1126/science.272.5264.1026. [DOI] [PMC free article] [PubMed] [Google Scholar]
- 32.Tsang SH, Yamashita CK, Lee WH, et al. The positive role of the carboxyl terminus of the gamma subunit of retinal cGMP-phosphodiesterase in maintaining phosphodiesterase activity in vivo. Vision Res. 2002;42:439–445. doi: 10.1016/s0042-6989(01)00213-9. [DOI] [PubMed] [Google Scholar]
- 33.Liu X, Bulgakov OV, Wen XH, et al. AIPL1, the protein that is defective in Leber congenital amaurosis, is essential for the biosynthesis of retinal rod cGMP phosphodiesterase. Proc Natl Acad Sci U S A. 2004;101:13903–13908. doi: 10.1073/pnas.0405160101. [DOI] [PMC free article] [PubMed] [Google Scholar]
- 34.Hidalgo-de-Quintana J, Evans RJ, Cheetham ME, van der SJ. The Leber congenital amaurosis protein AIPL1 functions as part of a chaperone heterocomplex. Invest Ophthalmol Vis Sci. 2008;49:2878–2887. doi: 10.1167/iovs.07-1576. [DOI] [PMC free article] [PubMed] [Google Scholar]
- 35.Liu X, Bulgakov OV, Wen XH, et al. AIPL1, the protein that is defective in Leber congenital amaurosis, is essential for the biosynthesis of retinal rod cGMP phosphodiesterase. Proc Natl Acad Sci U S A. 2004;101:13903–13908. doi: 10.1073/pnas.0405160101. [DOI] [PMC free article] [PubMed] [Google Scholar]
- 36.Ramamurthy V, Roberts M, van den AF, Niemi G, Reh TA, Hurley JB. AIPL1, a protein implicated in Leber’s congenital amaurosis, interacts with and aids in processing of farnesylated proteins. Proc Natl Acad Sci U S A. 2003;100:12630–12635. doi: 10.1073/pnas.2134194100. [DOI] [PMC free article] [PubMed] [Google Scholar]
- 37.Ramamurthy V, Niemi GA, Reh TA, Hurley JB. Leber congenital amaurosis linked to AIPL1: a mouse model reveals destabilization of cGMP phosphodiesterase. Proc Natl Acad Sci U S A. 2004;101:13897–13902. doi: 10.1073/pnas.0404197101. [DOI] [PMC free article] [PubMed] [Google Scholar]
- 38.Farber DB, Lolley RN. Cyclic guanosine monophosphate: Elevations in degenerating photoreceptor cells of the C3H mouse retina. Science. 1974;186:449–451. doi: 10.1126/science.186.4162.449. [DOI] [PubMed] [Google Scholar]
- 39.Pierce EA. Pathways to photoreceptor cell death in inherited retinal degenerations. Bioessays. 2001;23:605–618. doi: 10.1002/bies.1086. [DOI] [PubMed] [Google Scholar]
- 40.Strettoi E, Pignatelli V. Modifications of retinal neurons in a mouse model of retinitis pigmentosa. Proc Natl Acad Sci U S A. 2000;97:11020–11025. doi: 10.1073/pnas.190291097. [DOI] [PMC free article] [PubMed] [Google Scholar]
- 41.Varela C, Igartua I, De la Rosa EJ, De la Villa P. Functional modifications in rod bipolar cells in a mouse model of retinitis pigmentosa. Vision Res. 2003;43:879–885. doi: 10.1016/s0042-6989(02)00493-5. [DOI] [PubMed] [Google Scholar]
- 42.Linberg KA, Fariss RN, Heckenlively JR, Farber DB, Fisher SK. Morphological characterization of the retinal degeneration in three strains of mice carrying the rd-3 mutation. Vis Neurosci. 2005;22:721–734. doi: 10.1017/S0952523805226044. [DOI] [PubMed] [Google Scholar]
- 43.Sarthy PV, Fu M. Transcriptional activation of an intermediate filament protein gene in mice with retinal dystrophy. DNA. 1989;8:437–446. doi: 10.1089/dna.1.1989.8.437. [DOI] [PubMed] [Google Scholar]
- 44.Ekstrom P, Sanyal S, Narfstrom K, Chader GJ, van Veen T. Accumulation of glial fibrillary acidic protein in Muller radial glia during retinal degeneration. Invest Ophthalmol Vis Sci. 1988;29:1363–1371. [PubMed] [Google Scholar]
- 45.Rattner A, Nathans J. The genomic response to retinal disease and injury: evidence for endothelin signaling from photoreceptors to glia. J Neurosci. 2005;25:4540–4549. doi: 10.1523/JNEUROSCI.0492-05.2005. [DOI] [PMC free article] [PubMed] [Google Scholar]
Associated Data
This section collects any data citations, data availability statements, or supplementary materials included in this article.