

Abstract
Recent studies showing that single taste bud cells express multiple bitter taste receptors have reignited a long-standing controversy over whether single gustatory receptor cells respond selectively or broadly to tastants. We examined calcium responses of rat taste receptor cells in situ to a panel of bitter compounds to determine whether individual cells distinguish between bitter stimuli. Most bitter-responsive taste cells were activated by only one out of five compounds tested. In taste cells that responded to multiple stimuli, there were no significant associations between any two stimuli. Bitter sensation does not appear to occur through the activation of a homogeneous population of broadly tuned bitter-sensitive taste cells. Instead, different bitter stimuli may activate different subpopulations of bitter-sensitive taste cells.
Recently, a large family of bitter taste receptors was identified in humans and rodents (1, 2). Although individual receptors were shown to respond selectively to a particular compound (3), taste cells expressed mRNAs for several receptors (1, 2). The findings were interpreted as showing that individual taste cells respond to several different compounds (1). However, behavioral and physiological studies in humans, monkeys, and rats indicate that bitter stimuli can be discriminated (4–8). Whether taste cells respond specifically to certain bitter stimuli is an unresolved issue. Unfortunately, our understanding of whether taste cells respond to multiple bitter compounds has depended on inferences from indirect studies [expression patterns of receptor mRNA (1, 2) and recordings from the afferent nerve (7) and cortical neurons (8)]. Here, we used Ca2+ imaging to measure direct activation of taste cells in situ to investigate how bitter taste stimuli are detected in taste buds (9). With this method, it is possible to view single taste cells in foliate slices in situ with a confocal microscope and record Ca2+ changes in intact taste buds (9–11) (Fig. 1). A series of representative compounds widely used in studies of bitter taste was selected for this study at concentrations that elicit behavioral responses in rats (12–20).
Fig. 1.
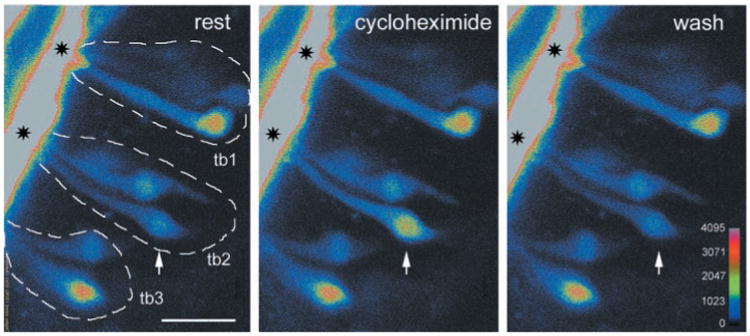
Ca2+ response to the bitter compound cycloheximide (10 μM). Three sequential confocal images of a lingual slice showing individual taste cells loaded with CaGD in adjacent foliate taste buds (outlined, tb1 to tb3). Only one cell (arrow) responds to the stimulus. Apical processes extend to and converge at the taste pore (asterisks). Scale bar, 20 μm. Color palette shows the intensity mapping (range, 0 to 4095; 12-bit data).
Cycloheximide (10 μM) induced large transient intracellular Ca2+ increases in foliate taste cells that showed little if any adaptation or desensitization [mean peak amplitude of the relative fluorescence change ΔF/F, 46.6 ± 6.5% (Fig. 2)]. This contrasts with the pronounced adaptation reported for the expressed murine cycloheximide receptor (3). Lowering extracellular Ca2+ concentration did not reduce cycloheximide responses in the cell bodies (Fig. 2D) (21) or apical processes. None of the cells that responded to cycloheximide (n = 16) responded to depolarization with 50 mM KCl, although neighboring cells did (9). Thus, cycloheximide-induced Ca2+ signals did not appear to depend on Ca2+ influx through voltage-gated Ca2+ channels (22). Our results are consistent with studies showing that other bitter stimuli raise inositol trisphosphate levels and release Ca2+ from intracellular stores (23–26).
Fig. 2.
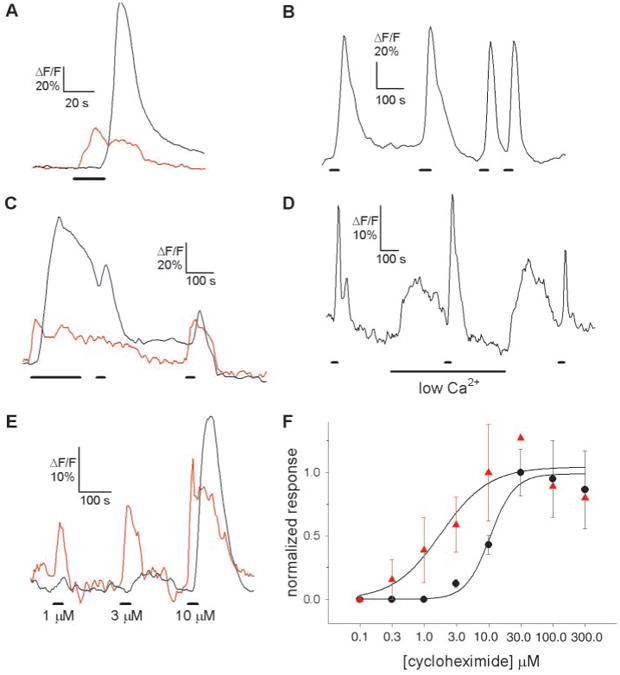
Cycloheximide-induced Ca2+ responses in single taste cells. (A) The Ca2+ response to cycloheximide (10 μM) appears 20 s earlier in the apical tip (red trace) than in the cell body (black trace) of the same taste cell. There is a secondary Ca2+ increase in the apical process that is coincident with the larger Ca2+ transient in the cell body. This may represent diffusion of Ca2+ from the cell body (i.e., backflow). Bars under traces denote the application of taste stimuli in (A) through (E). (B) Repetitive stimulation with cycloheximide did not decrease the amplitude of the response. (C) Prolonged application of cycloheximide (10 μM) resulted in only a small decline in response (adaptation) in the apical tip (red trace) and cell body (black trace), which may be due to depletion of the intracellular Ca2+ stores. (D) Cycloheximide responses were not abolished by lowering the Ca2+ concentration in the bath solution to a nominal 0 mM. Changing the Ca2+ concentration in the bath solution induced changes in intracellular Ca2+ (21). (E) Concentration dependency of cycloheximide-induced Ca2+ responses in the apical tip (red trace) and the cell body (black trace). The apical tip was more sensitive than the cell body. The differences in sensitivity and time course of the responses between the apical process and the cell body suggest that these regions constitute distinct physiological compartments, as reported for olfactory receptor neurons (30). (F) Concentration-response relations for peak responses to cycloheximide in the apical process (red triangles) (n = 5 taste cells) and the cell body (black circles) (n = 9). Not all concentrations could be tested in every cell. Responses were normalized to the average response at 10 μM (apical process) and 30 μM (cell bodies). Data were curve-fitted with SigmaPlot 5.0 (SPSS, Chicago, Illinois). Error bars indicate SEM.
The other bitter stimuli that we tested induced smaller Ca2+ responses [mean peak amplitudes from 5.1 to 12.5% (Fig. 3A)]. In contrast to cycloheximide, denatonium, and quinine, sucrose octaacetate (SOA) and phenylthiocarbamide (PTC) responses were prolonged [up to several minutes (Fig. 3B)]. Responses to the five compounds tested showed concentration dependency and had different activation thresholds (Fig. 3C). The response thresholds for all five stimuli were strikingly similar to the behavioral thresholds in rats (27).
Fig. 3.

Ca2+ responses elicited by five representative bitter compounds in cell bodies of single taste cells. (A) Averaged responses (mean ± SEM, shown by error bars) evoked by cycloheximide (10 μM; n = 10 cells) (black), quinine (300 μM; n = 7) (red), denatonium (100 μM; n = 9) (gray), PTC (300 μM; n = 7) (blue), and SOA (500 μM; n = 6) (green). (B) Responses as in (A), but with normalized amplitudes. (C) Concentration-response relations show different sensitivities for the five stimuli. Responses are from at least three taste cells. Responses were normalized to the means of the largest responses. Data were curve-fitted as described in Fig. 2F. Error bars indicate SEM. Bars under traces in (A) and (B) denote application of taste stimuli.
Only 18% of all cells tested (69 out of 374) showed responses to one or more of the test compounds when applied at or slightly above midrange concentrations (Fig. 3C). Responses to the compounds were observed in the percentage of taste cells as follows: cycloheximide (10 μM), 14% of the taste cells (51 out of 374); quinine (300 μM), 4.5% (17 out of 374); denatonium (100 μM), 3.7% (14 out of 374); PTC (300 μM), 2.4% (9 out of 374); and SOA (500 μM), 1.6% (6 out of 374). The low incidence of the denatonium responses corresponds well with previous observations on rat taste buds (25, 28). The proportion of bitter-responsive cells per taste bud (average, 17.6 ± 2.8%) was similar to the proportion of bitter-sensitive cells within the entire taste cell population that we tested (18%). Thus, there was no clustering of responses in particular taste buds. The proportion (18%) and spatial pattern of the bitter-sensitive taste cells that we observed within the foliate papillae were similar to those reported for bitter receptor mRNAs [15 to 20% (1)].
We next asked whether individual taste receptor cells could discriminate among the five bitter stimuli tested. Stimuli were applied consecutively, in random order that varied from experiment to experiment. Most bitter-sensitive cells (65%, 45 out of 69) responded to only one compound of the five tested, even though neighboring cells responded to other test stimuli (Fig. 4). Twenty-six percent (18 out of 69) of the cells responded to two stimuli, and only 7% (5 out of 69) responded to more than two stimuli. Multiple pairwise comparisons (Fisher's exact test, P < 0.005 to keep the overall risk of type I error equal to 0.05) showed that all responses were independent of each other; i.e., there was no association between any two stimuli in taste cells. Applying higher concentrations of denatonium (1 mM) and quinine (1 mM) did not recruit more taste cells (n = 134 taste cells; 5.2 versus 3.7% for denatonium responses at 1 mM and 100 μM, respectively; 4.5 versus 4.5% for quinine responses at 1 mM and 300 μM, respectively). Furthermore, higher concentrations of bitter stimuli did not increase the overlap of responses.
Fig. 4.
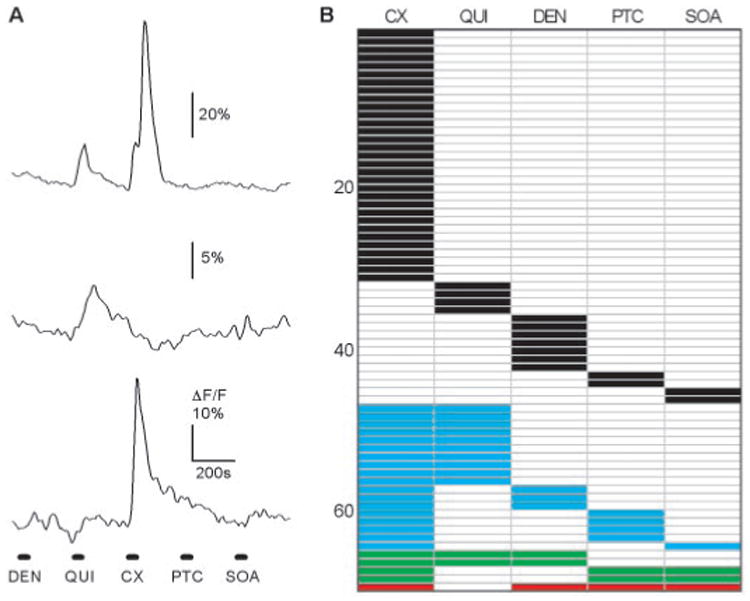
Chemical specificity of taste cells. (A) Sequential stimulation with five bitter stimuli induced different responses in three different taste cells in one taste bud. One cell responded to quinine (300 μM) and cycloheximide (10 μM) (top), one cell responded only to quinine (middle), and one cell responded only to cycloheximide (bottom). (B) Summary of the response profiles of 69 bitter-sensitive taste cells (out of 374 imaged cells) as shown in (A). Each column indicates responses to a different bitter compound. Each row represents data from an individual taste cell. The number of cells is indicated on the left. Most taste cells responded to only one stimulus of the five tested (black). Other taste cells responded to two (blue), three (green), and four stimuli (red).
Our results argue against the suggestion that bitter-sensitive taste cells respond to a wide range of bitter stimuli. Instead, our findings indicate that most taste cells may be activated by a limited number of bitter compounds; i.e., individual taste cells can discriminate among bitter stimuli. The specificity of taste cells to bitter stimuli shown in the present study may give rise to the reported segregation of bitter responses into different gustatory nerve fibers (7). The existence and nature of any grouping of taste cells were not evident in the present study, but the number of test stimuli (n = 5) was small. Finally, it has yet to be established rigorously whether bitter compounds can be discriminated behaviorally. Human studies (29) suggest that there are different categories of bitterness, but the mechanism for this discrimination is not known. Results from nerve recordings and our findings on taste cells support the notion that bitter sensation does not occur through the activation of a single, homogeneous population of bitter-sensitive taste cells, but occurs through the activation of multiple, heterogeneous taste cells.
Acknowledgments
This work was supported by NIH grants DC00374 (S.D.R.) and DC04525-01 (A.C.) from the National Institute on Deafness and Other Communication Disorders.
References and Notes
- 1.Adler E, et al. Cell. 2000;100:693. doi: 10.1016/s0092-8674(00)80705-9. [DOI] [PubMed] [Google Scholar]
- 2.Matsunami H, Montmayeur JP, Buck LB. Nature. 2000;404:601. doi: 10.1038/35007072. [DOI] [PubMed] [Google Scholar]
- 3.Chandrashekar J, et al. Cell. 2000;100:703. doi: 10.1016/s0092-8674(00)80706-0. [DOI] [PubMed] [Google Scholar]
- 4.Pfaffmann C. In: Handbook of Physiology, Section 1, Neurophysiology. Field J, editor. Vol. 1. American Physiological Society; Washington, DC: 1959. pp. 507–533. [Google Scholar]
- 5.McBurney DH, Smith DV, Shick TR. Percept Psychophys. 1972;11:228. [Google Scholar]
- 6.Bartoshuk LM, Cleveland CT. Sens Processes. 1977;1:177. [PubMed] [Google Scholar]
- 7.Dahl M, Erickson RP, Simon SA. Brain Res. 1997;756:22. doi: 10.1016/s0006-8993(97)00131-5. [DOI] [PubMed] [Google Scholar]
- 8.Scott TR, Giza BA, Yan J. J Neurophysiol. 1999;81:60. doi: 10.1152/jn.1999.81.1.60. [DOI] [PubMed] [Google Scholar]
- 9.Caicedo A, Jafri MS, Roper SD. J Neurosci. 2000;20:7978. doi: 10.1523/JNEUROSCI.20-21-07978.2000. Tongues were removed from 46 Sprague-Dawley rats (150 to 200 g) and immersed in cold Tyrode's solution [135 mM NaCl, 5 mM KCl, 8 mM CaCl2, 1 mM MgCl2, 10 mM Hepes, 10 mM glucose, 10 mM Na pyruvate, and 5 mM NaHCO3 (pH 7.4, 320 to 330 milliosmol)]. Calcium Green-1 dextran (CaGD) [MW 3000, dissociation constant Kd = 259 nM Molecular Probes, Eugene, OR] was injected iontophoretically (5 mM in H2O; −3.5 μA; 10 min) through a glass micropipette (20-μm tip) into the foliate papillae. Next, the tongues were sliced (100 μm) on a Vibroslicer (Campden Instruments, Leicester, UK). CaGD-loaded cells were excited at 488 nm by using an argon laser attached to an Olympus Fluoview scanning confocal microscope. Confocal images were collected at 5-s intervals, and changes in CaGD fluorescence over time were then analyzed with Fluoview software. We expressed the fluoro-metric signals as relative fluorescence change, ΔF/F = F − F0/F0, where F0 is the resting fluorescence level. All chemicals were applied in a bath at room temperature. [DOI] [PMC free article] [PubMed] [Google Scholar]
- 10.Data are most likely recorded from mature receptor cells (9). Similar procedures labeled afferent innervation to taste bud cells [R. F. Krimm, D. L. Hill, J. Comp. Neurol. 398, 13 (1998); M. C. Whitehead, J. R. Ganchrow, D. Ganchrow, B. Yao, Neuroscience 93, 931 (1998)]. This also supports the idea that iontophoretically labeled cells are mature innervated receptor cells. Furthermore, the incidence of bitter-responsive dye-labeled cells (18%) is remarkably close to the incidence of cells expressing candidate bitter receptors [15 to 20% (1)], suggesting that dye-labeled cells are representative taste receptor cells.
- 11.Ca2+ signals presumably indicate physiological activation and presage neurotransmitter release. However, the absence of Ca2+ signals does not necessarily indicate that the cell has not been affected (for example, if a stimulus inhibits the taste cell).
- 12.Richter CP, Clisby KH. Am J Physiol. 1941;134:157. [Google Scholar]
- 13.Patton HD, Ruch TC. J Comp Psychol. 1944;37:35. [Google Scholar]
- 14.Koh SD, Teitelbaum P. J Comp Physiol Psychol. 1961;54:223. doi: 10.1037/h0048474. [DOI] [PubMed] [Google Scholar]
- 15.Tobach E, Bellin JS, Das DK. Behav Genet. 1974;4:405. doi: 10.1007/BF01066160. [DOI] [PubMed] [Google Scholar]
- 16.Iwasaki K, Sato M. Chem Senses. 1981;6:119. [Google Scholar]
- 17.Glendinning JI. Physiol Behav. 1994;56:1217. doi: 10.1016/0031-9384(94)90369-7. [DOI] [PubMed] [Google Scholar]
- 18.Thaw AK. Chem Senses. 1996;21:189. doi: 10.1093/chemse/21.2.189. [DOI] [PubMed] [Google Scholar]
- 19.Dess NK. Physiol Behav. 2000;69:247. doi: 10.1016/s0031-9384(99)00246-2. [DOI] [PubMed] [Google Scholar]
- 20.Bath application of cycloheximide (0.1 to 300 μM), denatonium benzoate (3 to 3000 μM), quinine HCl (10 to 3000 μM), SOA (10 to 1000 μM), and PTC (10 to 1000 μM) induced transient Ca2+ responses in taste cells in 83% of foliate taste buds tested (43 out of 52 taste buds). At the concentrations used, none of the compounds interfered with fluorescence intensity.
- 21.Lowering extracellular Ca2+ appeared to increase intracellular Ca2+ transiently in many cells (Fig. 2D), consistent with previous findings in catfish taste cells [M. M. Zviman, D. Restrepo, J. H. Teeter, J. Membr. Biol. 149, 81 (1996)].
- 22.Quinine- and denatonium-responsive taste cells (n = 2 for each) also did not show Ca2+ increases when depolarized by 50 mM KCl [see also (25)].
- 23.Hwang PM, Verma A, Bredt DS, Snyder SH. Proc Natl Acad Sci U S A. 1990;87:7395. doi: 10.1073/pnas.87.19.7395. [DOI] [PMC free article] [PubMed] [Google Scholar]
- 24.Spielman AI, et al. Am J Physiol. 1996;270:926. doi: 10.1152/ajpcell.1996.270.3.C926. [DOI] [PubMed] [Google Scholar]
- 25.Akabas MH, Dodd J, Al-Awqati Q. Science. 1988;242:1047. doi: 10.1126/science.3194756. [DOI] [PubMed] [Google Scholar]
- 26.Ogura T, Mackay-Sim A, Kinnamon SC. J Neurosci. 1997;17:3580. doi: 10.1523/JNEUROSCI.17-10-03580.1997. [DOI] [PMC free article] [PubMed] [Google Scholar]
- 27.The response thresholds versus the behavioral thresholds, respectively, were as follows: 0.1 to 0.3 μM (Fig. 2F) versus 0.2 to 2 μM for cycloheximide (15); 10 to 30 μM (red circles, Fig. 3C) versus 8 to 20 μM for quinine (13, 14, 17, 18); 3 to 10 μM (gray triangles, Fig. 3C) versus ∼1 μM for denatonium (16, 17); 100 to 300 μM (blue triangles, Fig. 3C) versus 20 to 600 μM for PTC (12, 15); and 30 to 100 μM (green squares, Fig. 3C) versus 100 to 200 μM for SOA (19).
- 28.Bernhardt S, Naim M, Zehavi U, Lindemann B, Physiol J. 1996;490:325. doi: 10.1113/jphysiol.1996.sp021147. [DOI] [PMC free article] [PubMed] [Google Scholar]
- 29.Delwiche JF, Buletic Z, Breslin PAS. paper presented at the XII International Symposium on Olfaction and Taste/XIV Biennial Congress of the European Chemoreception Research Organisation; Brighton, UK. 20 to 24 July 2000. [Google Scholar]
- 30.Leinders-Zufall T, Shepherd GM, Greer CA, Zufall F. J Neurosci. 1998;18:5630. doi: 10.1523/JNEUROSCI.18-15-05630.1998. [DOI] [PMC free article] [PubMed] [Google Scholar]