

Abstract
Coronary disease risk increases inversely with high-density lipoprotein (HDL) level. The measurement of the biodistribution and clearance of HDL in vivo, however, has posed a technical challenge. This study presents an approach to the development of a lipoprotein MRI agent by linking gadolinium methanethiosulfonate (Gd[MTS-ADO3A]) to a selective cysteine mutation in position 55 of apo AI, the major protein of HDL. The contrast agent targets both liver and kidney, the sites of HDL catabolism, whereas the standard MRI contrast agent, gadolinium-diethylenetriaminepentaacetic acid-bismethylamide (GdDTPA-BMA, gadodiamide), enhances only the kidney image. Using a modified apolipoprotein AI to create an HDL contrast agent provides a new approach to investigate HDL biodistribution, metabolism and regulation in vivo.
Keywords: NMR, apolipoprotein, HDL, contrast agent, MRI, gadolinium, cardiovascular risk
INTRODUCTION
Coronary artery disease (CAD), a leading cause of morbidity, develops as lipoproteins accumulate in the vessel wall to form atherosclerotic plaques. These plaques impede blood flow and create the ischemia that can lead subsequently to angina, myocardial infarction and stroke (1-4). Epidemiologic studies indicate that the risk of development of CAD and atherosclerosis increases inversely with high-density lipoprotein (HDL) level (1). The HDL particles confer cardioprotection through their role in reverse cholesterol transport, where removal of cholesterol at the vascular wall decreases atherosclerotic plaque formation (2-4). As a consequence, HDL mimetic agents have presented pharmaceutical targets for the development of therapeutic interventions for CAD (5,6).
However, HDL can scavenge cholesterol only in the presence of its major constituent, apolipoprotein AI (apo AI), a 243-aminoacid residue (28 kDa) protein. Specifically, apo AI binds tightly to HDL, promotes cholesterol efflux from the cells and activates lecithin:cholesterol acyltransferase (LCAT) (2,7). In the interaction with LCAT, apo AI facilitates the maturation of HDL. A mouse model that overexpresses apo AI exhibits increased cholesterol clearance (8). A mutation (R173C) in apo AI Milano can improve the anti-atherogenic properties markedly (5,6,9). Yet, despite the critical role of apo AI and HDL, their biosynthesis, biodistribution, catabolism, clearance and interaction with atherosclerotic plaque formation in vivo remain open questions (10,11).
Recent studies have presented imaging strategies to monitor circulating lipoproteins. These include the assembly of reconstituted HDL (rHDL) from apo AI and phospholipids that contain Gd3+-labeled phospholipid (gadolinium 1,2-dimyristoyl-sn-glycero-3-phosphoethanolamine diethylenetriaminepentaacetic acid, GdDTPA-DMPE), which can serve as an MRI contrast agent to target macrophages in atheroma (12,13). Indeed, an rHDL image contrast agent with GdDTPA-DMPE-conjugated phospholipids has also been generated with an apo AI mimetic peptide representing only 37 amino acids of the protein (14). Image contrast agents have also been targeted to low-density lipoproteins (LDL) via conjugation to exposed lysine residues on apoB-100. Because apoB-100 recognizes LDL receptors, which are overexpressed by some tumors, the modified LDL particles can recognize and deliver therapeutic agent to the tumor site (15).
Apo AI proteins can exchange lipids with other lipoprotein species. As the HDL contrast agents based on Gd-modified lipids monitor only the biodistribution and metabolism of the modified lipids, linking gadolinium methanethiosulfonate (Gd[MTS-ADO3A]) to a single cysteine (Cys) mutation variant of apo AI provides a means to follow the metabolism of apo AI. As shown in previous reports, Gd[MTS-ADO3A] forms a stable disulfide bond with Cys in bovine serum albumin in vivo (16). Electron paramagnetic resonance studies have defined the spatial relationship and solvent exposure at multiple sites within lipid-bound apo AI, which provides a model for the protein arrangement on rHDL (17,18). The molecular model guides the selection of certain apo AI amino acids facing the aqueous environment for selective Cys mutations. Using this information, we have attached the thio-selective Gd[MTS-ADO3A] to sites in apo AI targeted by site-directed Cys substitution.
These apo AI modifications transform the labeled apo AI into an imaging agent which, on binding to HDL, forms an MRI nanoparticle. Indeed, on infusion with Gd[MTS-ADO3A] linked specifically to apo AI containing a serine-55 (Ser55) to Cys mutation (apoAI-S55C), both the mouse liver and kidney images show an intensity enhancement. In contradistinction, the introduction of the standard contrast agent gadolinium diethylenetriaminepentaacetic acid-bismethylamide (GdDTPA-BMA, gadodiamide) only enhances the kidney image.
This article describes an alternative imaging approach to detect vulnerable atherosclerotic plaques, to identify patients with HDL receptor deficiency and to monitor the efficacy of gene and cellular therapeutics that will restore normal HDL activity and biodistribution in vivo (19-21). Because the HDL nanoparticle can also serve as a vehicle to carry drug molecules, the creation of an image-visible HDL with modified apo AI also presents an opportunity to develop image-guided drug delivery systems, which, in turn, could have an impact on the treatment strategy for many clinical states, such as cancer, cardiovascular disease, diabetes, chronic kidney diseases, obesity and neurodegenerative diseases (22,23).
MATERIALS AND METHODS
Preparation of modified apo AI
A bacterial expression system consisting of pNFXex plasmid in Escherichia coli BL21 (DE3) pLysS cells was used in the preparation of the single-Cys apo AI (17,24). Cys mutations of residues 55 and 76 in the apo AI cDNA (apo AI-S55C and apo AI-Q76C) were created by oligonucleotide-directed polymerase chain reaction mutagenesis. The mutations were confirmed by dideoxy automated fluorescent sequencing. The pNFXex plasmid was transferred into E. coli strain BL21 (DE3) pLysS cells (Invitrogen, Carlsbad, CA, USA) and cultivated in Luria–Bertani medium (Miller, Fisher, Fair Lawn, NJ, USA) with 50 μg/mL of ampicillin. Mutant human apo AI proteins were extracted and purified by immobilized metal affinity chromatography using phosphate-buffered saline (20 mm phosphate, 500 mm NaCl), pH 7.4, and increasing concentrations of imidazole, as reported previously (17,24). The purified apo AI proteins were concentrated to approximately 5 mg/mL with 20-kDa molecular weight cut-off Vivaspin 2 CTA centrifugal filter devices (Vivascience AG, Hannover, Germany). Protein purity was confirmed by sodium dodecylsulfate-polyacrylamide gel electrophoresis (SDS-PAGE) with Coomassie blue staining, and concentrations were determined using the MicroBCA assay kit (Pierce, Rockford, IL, USA) employing bovine serum albumin as a standard.
Gd[MTS-ADO3A] was synthesized as reported previously and conjugated to apo AI to form the labeled proteins Gd[MTS-ADO3A]apo AI-S55C and Gd[MTS-ADO3A]apo AI-Q76C (16). For labeling, 1 mm of Gd[MTS-ADO3A] was incubated with purified apo AI-S55C or AI-Q76C for 30 min at room temperature, followed by running the sample through a Bio-spin 6Tris Column (Bio-Rad, Hercules, CA, USA) equilibrated in phosphate-buffered saline, pH 7.4, to remove any unreacted label. The protein was further concentrated using the Vivaspin centrifugal device to a final concentration of 45 mg/mL (or 1.5 mm). The yield was 10 mg of apo AI per liter of cell culture. To generate the final lipidated apo AI contrast agent, the labeled apo AI was combined 1 : 100 (mole protein : mole lipid) with small unilamellar liposomes of dimyristoyl phosphatidylcholine (DMPC) (Avanti, Alabaster, AL, USA) prepared by extrusion through 100-nm filters according to the manufacturer’s instructions (Avestin, Inc., Ottawa, ON, Canada).
The functional lipidation properties of both Gd[MTS-ADO3A]apo AI species were evaluated by a lipid clearance assay as described previously (25). Briefly, unilamellar DMPC vesicles were prepared as described above and placed in a cuvette, where lipid-free apo AI proteins were added at a 2 : 1 lipid to protein ratio (w/w). The spectral changes (at 600 nm) were monitored over time as phospholipid molecules were used in the formation of smaller protein–lipid complexes, with a consequent clearance of larger DPMC vesicles. Although the lipid binding of apolipoproteins is known to be a complex process involving several intermediate steps, this assay is accepted in the field as an approximate measure of the lipid-binding capability of an apolipoprotein (26). Clearance of unilamellar DMPC liposomes by protein labeled with Gd[MTS-ADO3A] exhibited lipidation times to half-completion (t1/2) at rates comparable with those of wild-type apo AI (Supporting information Fig. S1).
Tissue extracts
Western blotting and inductively coupled plasma mass spectrometry (ICPMS) were used to analyze the liver and kidney extracts from mice injected with Gd[MTS-ADO3A]apo AI-S55C or gadodiamide. The extracts were obtained from excised liver and kidney. The tissues were homogenized twice for 20 s at 4°C with a tissue tearor (Biospec Inc., Bruker, Billerica, MA, USA) in five volumes of phosphate-buffered saline. Centrifugation was then used to separate the solution from the solid material.
Western blotting
For Western blotting, the supernatant was mixed with sample buffer and separated by SDS-PAGE using a 12.5% gel (27,28). The proteins were transferred to a nitrocellulose membrane using an electroblotter (E&K, model 6000, Saratoga, CA, USA). Immunological detection of apo AI protein was carried out with apo AI mouse monoclonal IgG and horseradish peroxida-se-conjugated anti-mouse Ig antibody (Abcam, Cambridge, MA, USA) according to the manufacturer’s protocol. After 2 min of incubation with chemiluminescent substrates (Thermo Scientific, Waltham, MA, USA), the blot was exposed to film for 10 s.
Gd3+ determination by ICPMS
For measurement of Gd3+ by ICPMS, the apo AI protein bands from liver and kidney extracts were isolated by SDS-PAGE using 4–20% Criterion Tris-HCl gels (Bio-Rad). Samples were applied to multiple lanes of the gel to allow for protein staining and protein extraction. After SDS-PAGE, one part of the gel (samples, purified apo AI standard and molecular weight standard) was stained with Coomassie blue to visualize the proteins. On the remainder of the gel, the sample bands containing the apo AI protein (~ 25 kDa) were cut out with a razor blade, and each gel fragment was transferred to a polypropylene microtube. The gel fragment was crushed with a pipette tip and extracted with 50 μL of nitric acid by vortexing for 4 h at room temperature. After centrifugation, 20 μL of the supernatant was added to 1.88 mL of 3% nitric acid. The sample was filtered through a 0.22-μm syringe filter and analyzed by ICPMS.
The prepared samples were analyzed using an Agilent 7500CE ICP-MS (Agilent Technologies, Palo Alto, CA, USA) by the Interdisciplinary Center for Plasma Mass Spectrometry (University of California at Davis, CA, USA). The samples were introduced using a MicroMist Nebulizer (Glass Expansion, Pocasset, MA, USA) into a temperature-controlled spray chamber. Instrument standards diluted from Certiprep ME 1 (SPEX CertiPrep, Metuchen, NJ, USA) encompassed the range 0, 0.05, 0.25, 0.5, 1, 10, 50, 100 and 200 parts per billion (ppb) in 3% trace element grade HNO3 (Fisher Scientific, Fair Lawn, NJ, USA) in 18.2-MΩ water. A separate 10-ppb Certiprep ME 1 standard was analyzed as every 10th sample as a quality control. Sc, Y and Bi Certiprep standards (SPEX CertiPrep) were diluted to 100 ppb in 3% HNO3 and introduced by peripump as an internal standard. Based on the results from the analysis of the standards, the instrument determined a detection limit of 7.2 × 10⁻⁴ ppb.
Animal preparation
Two groups of male 18-24 B6 mice (n = 3) (Jackson Laboratories, Bar Harbor, ME, USA), weighing 18–24 g, were used, one set for control and the other for the Gd[MTS-ADO3A]apo AI-S55C infusion. The mice were anesthetized with 1.5% isoflurane in oxygen, and the right jugular vein was catheterized with a cannula that had an additional side injection portion and a dead volume of 6–8 μL. For the NMR experiments, the animal was then placed in a Lucite holder. Control group animals received 150 μL of 2 mm gadodiamide (Omniscan, Nycomed, Princeton, NJ, USA), whereas the other group received 150 μL of 2 mm Gd[MTS-ADO3A]apo AI-S55C. Given the approximately 2-mL dilution by the mouse blood volume, the infusion amount achieved a final concentration of about 0.2 mm (29). Both contrast agents were infused into the jugular catheter and chased with 20 μL of physiological saline solution. The imaging session lasted about 30 min. All animal preparation and handling followed the research protocol approved by the University of California at Davis Animal Welfare Committee.
NMR
A 400-MHz Bruker (Billerica, MA, USA) Avance spectrometer with a 5-mm probe was used to measure T1 of water in the presence and absence of gadodiamide and the Gd[MTS-ADO3A]apo AI derivatives. The probe was detuned by 5 MHz to reduce the interference from radiation damping. The 1H 90° pulse was calibrated against the H2O signal from a 0.15 m NaCl solution. A typical spectrum required eight scans and used the following signal acquisition parameters: spectral width, 8012 Hz; 16,384 data points; acquisition time, 1 s. The free induction decay was zero-filled with an exponential window function to improve the spectra, and the H2O line served as the spectral reference: 4.75 ppm at 25°C relative to sodium 3-(trimethylsilyl) propionate-2,2,3,3-d4 at 0 ppm. A three-parameter exponential fit mapped the T1 values of the samples.
Imaging experiments used a 25-mm birdcage resonator and a set of microimaging gradients that could output a maximum gradient of 95 G/cm. T1-weighted multi-slice spin-echo methods first measured the images in all three orthogonal directions. After obtaining the control image, the contrast agent was infused into the mouse. The pulse sequence employed a 2-ms three-lobed sinc pulse to select 1-mm slices, each separated by 1 mm. TR = 200 ms and TE = 6 ms produced the optimal image contrast between the liver and kidney from the rest of the tissue. The field of view focused on a 6 × 6-cm2 area. Signal acquisition utilized a 128 × 128 data point matrix. Each set of multi-slice scans required 100 s. T1-weighted multi-slice images followed in real time the gadodiamide and Gd[MTS-ADO3A]apo AI derivative biodistribution for 30 min.
A home-built MATLAB routine was used to analyze the image intensity of corresponding 22-mm3 voxels before and after contrast agent infusion. The selected regions of interest in the raw images were displayed initially with the intensity mapped to a gray scale. Over the kidney and liver, a red–green–blue colormap was applied only to the region of interest. The color code limit was set in the red–green–blue colorspace by linearly interpolating the red, green and blue intensity values within a total of 256 steps, as implemented in MATLAB.
Relaxivity
The image intensity induced by the contrast agent in an inversion recovery T1 pulse sequence follows the equation:
| [1] |
where τ is the inversion time, a is an empirically determined constant reflecting the magnetization after the inversion pulse and I0 is the image intensity in the absence of any contrast agent. The experimental condition assumes a repetition time much greater than the observed longitudinal relaxation time . depends on the relaxivity (r) induced by the presence of a relaxation agent, such as Gd3+:
| [2] |
where is the H2O relaxation rate without contrast agent. Because , the signal in the presence of a contrast agent will recover faster than in the absence of a contrast agent following a T1 pulse sequence. The relaxivity was determined from the water relaxation at a specific concentration of contrast agent, and then normalized to the relaxivity at a concentration of 1 mm.
Statistical analysis
Statistical analysis used the Sigma Plot/Sigma Stat program (Systat Software, Inc., Point Richmond, CA, USA) and expressed the data as the mean value ± standard error (SE). Statistical significance was determined by two-tailed Student’s t-test: p < 0.05.
RESULTS
Figure 1 shows the chemical structure of Gd[MTS-ADO3A] with the methanethiosulfonate group, which binds covalently to Cys of the single mutation variant of apo AI-S55C or apo AI-Q76C (16). At 8.9 T, water relaxes with a T1 rate of 0.4 s−1 at 25°C. With the gadolinium chelate Gd[MTS-ADO3A], the water relaxivity increases to 7.7 mm−1 s−1. With Gd[MTS-ADO3A] covalently linked to apo AI S55C to form Gd[MTS-ADO3A]apo AI-S55C, and in the absence of any lipid, water has a relaxivity of only 2.0 mm−1 s−1. After lipidation, Gd[MTS-ADO3A]apo AI-S55C forms Gd[MTS-ADO3A]apo AI-S55C-rHDL, which increases the water relaxivity to 11.7 mm−1 s−1. Attaching the Gd[MTS-ADO3A] to a glutamine (Gln) to Cys mutation in position 76 forms Gd[MTS-ADO3A]apo AI-Q76C, which exhibits a water relaxivity of 4.2 mm−1 s−1. However, lipidating Gd[MTS-ADO3A]apo AI-Q76C to form Gd[MTS-ADO3A]apo AI-Q76C-rHDL only increases the water relaxivity modestly to 5.1 mm−1 s−1. Table 1 summarizes these water relaxivity values.
Figure 1.
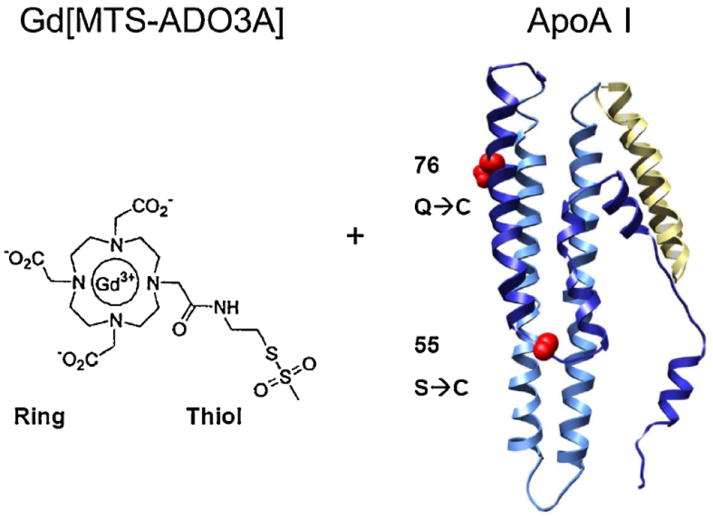
Molecular structure of gadolinium methanethiosulfonate (Gd[MTS-ADO3A]) and variants of apolipoprotein AI (apo AI). The structure of Gd[MTS-ADO3A] is shown on the left with the thioester linker. On the right is the ribbon diagram of the protein apo AI with cysteine (Cys) replacing serine at position 55 or glutamine at position 76.
Table 1.
Water relaxivity at a field of 9.4 T and at 25°C
| Contrast agent | Relaxivity (mm−1 s−1) |
|---|---|
| Gadodiamide (GdDTPA-BMA) (Omniscan) | 3.3 |
| Gd[MTS-ADO3A] | 7.7 |
| Gd[MTS-ADO3A]apo AI-S55C | 2.0 |
| Gd[MTS-ADO3A]apo AI-Q76C | 4.2 |
| Gd[MTS-ADO3A]apo AI-S55C-rHDL | 11.7 |
| Gd[MTS-ADO3A]apo AI-Q76C-rHDL | 5.1 |
Water T1 relaxation rate is 0.4 s−1 See abbreviations for contrast agent definitions.
With the infusion of gadodiamide, the MR mouse images show a pronounced enhancement in the kidney, consistent with a previous literature report (30). With the infusion of Gd[MTS-ADO3A]apo AI-S55C, however, the image intensity increases in both the liver and kidney. Figure 2A shows the control image (image prior to the injection of contrast agent); Fig. 2B shows the image 5 min after infusion with gadodiamide; Fig. 2C, D displays the corresponding control image and the image 5 min after infusion with Gd[MTS-ADO3A]apo AI-S55C, respectively.
Figure 2.
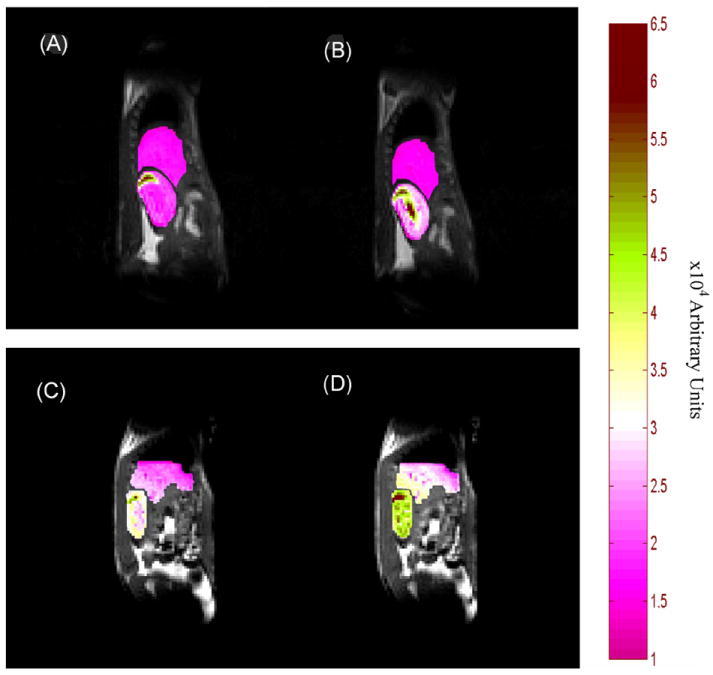
Sagittal views of mouse liver and kidney: (A) during control period (prior to the injection of contrast agent); (B) 5 min after infusion of gadodiamide; (C) during control period; (D) 5 min after infusion of Gd[MTS-ADO3A]apo AI-S55C.
Figure 3 displays histograms of the image intensity change in the kidney during the control period and 5, 10 and 30 min after infusion with gadodiamide and Gd[MTS-ADO3A]apo AI-S55C. Relative to the control image intensity as 100%, gadodiamide enhances the image by 231 ± 19% in the kidney within 5 min of infusion (p < 0.05). The image intensity remains significantly above the control value even after 30 min.
Figure 3.
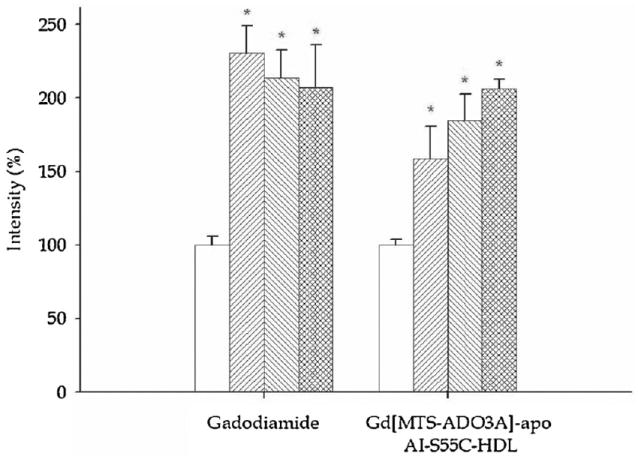
Bar graphs of image intensity in kidney medulla in the control period (prior to the injection of contrast agent) (□) and 5 min (▦), 10 min (▨) and 30 min (▥) after the infusion of gadodiamide and Gd[MTS-ADO3A]apo AI-S55C.
However, gadodiamide produces no significant image enhancement in the liver (Fig. 4). In contrast, Gd[MTS-ADO3A]apo AI-S55C enhances the image intensity in both the liver and kidney. In the kidney, the image intensity increases to 159 ± 22% (p < 0.05) (Fig. 3). After 30 min, the image intensity increases to 206 ± 6%. In the liver, the image intensity increases to 127 ± 2% within the first 5 min and to 151 ± 22% after 30 min of infusion. Table 2 summarizes the observed image enhancements.
Figure 4.
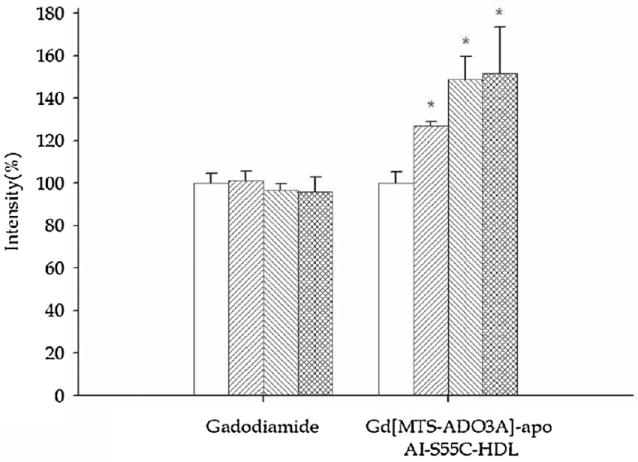
Bar graphs of image intensity in liver in the control period (prior to the injection of contrast agent) (□) and 5 min (▦), 10 min (▨) and 30 min (▥) after the infusion of gadodiamide and Gd[MTS-ADO3A]apo AI-S55C.
Table 2.
Image intensity change with GdDTPA-BMA (gadodiamide) and Gd[MTS-ADO3A]-apo AI-S55C infusion
| Kidney
|
Liver
|
|||||||
|---|---|---|---|---|---|---|---|---|
| Time (min) | GdDPTA-BMA | Gd[MTS-ADO3A]-apo AI-S55C | GdDPTA-BMA | Gd[MTS-ADO3A]-apo AI-S55C | ||||
| Avg | SE | Avg | SE | Avg | SE | Avg | SE | |
| Control | 100 | 6 | 100 | 4 | 100 | 5 | 100 | 5 |
| 5 | 231* | 19 | 159* | 22 | 101 | 4 | 127* | 2 |
| 10 | 214* | 19 | 184* | 18 | 97 | 3 | 149* | 11 |
| 30 | 207* | 29 | 206* | 6 | 96 | 7 | 151* | 22 |
See abbreviations for contrast agent definitions.
Statistically significant difference from control with p <0.05.
Figure 5 shows the Western blot of liver and kidney extracts after infusion with gadodiamide (lanes 03L and 03K, respectively) and Gd[MTS-ADO3A]apo AI-S55C (lanes A5L and A5K, respectively). The reaction of the samples withmouse monoclonal IgG directed against human apo AI reveals strong bands at 25 and 75 kDa in lanes A5L and A5K. These bands correspond to apo AI monomers and trimers, respectively (31). As expected with an antibody directed against human apo AI, no detectable band appears in liver and kidney extracts of mice infused only with the gadodiamide compound (lanes 03L and 03K, respectively).
Figure 5.
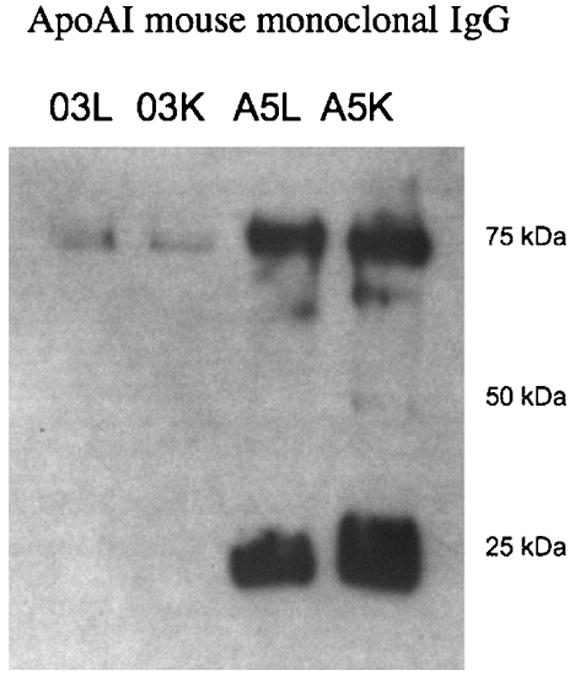
Western blot of extracts from the control period (prior to the injection of contrast agent) and from liver and kidney infused with gadodiamide (lanes 03L and 03K, respectively) and Gd[MTS-ADO3A]apo AI-S55C (lanes A5L and A5K, respectively). The 25- and 75-kDa bands in lanes A5L and A5K correspond to monomeric and oligomeric apolipoprotein AI.
ICPMS analysis of the 25-kDa bands from the SDS-PAGE gel of lanes 03L and 03K showed that these samples contained 3.4 × 10⁻³ and 3.7 × 10⁻³ ppb of Gd3+. In contrast, the 25-kDa bands from lanes A5L and A5K contained two to three times higher Gd3+ concentrations: 7.1 × 10⁻³ and 9.0 × 10⁻³ ppb, respectively. The liver and kidney extracts from animals receiving Gd[MTS-ADO3A]apo AI-S55C contained Gd3+ over 10 times above the detection threshold of 7.2 × 10⁻⁴ ppb. No Gd3+ was found in the samples taken from the running front of the SDS-PAGE gel, where low-molecular-weight compounds would appear.
DISCUSSION
Selective apo AI mutation
Several models for the association of apo AI with phospholipids in discoidal HDL have been suggested and evaluated (32,33). The picket fence model envisions two antiparallel and adjacent apo AI molecules fencing the lipid disk without any significant intermolecular interaction. In contrast, the belt model posits two antiparallel apo AI molecules paired at the C-termini and wrapped around the phospholipid-like belt. Significant intermolecular interaction stabilizes the belt configuration. Both models, however, propose that the apo AI N-terminal helix 44–65 and the C-terminal helix 210–241 initiate lipid association, that the central domain, helix 100–121 and, to a lesser extent, helix 122–143 play a role in lipid binding and HDL maturation, and that helix 144–165 activates LCAT (33). Unfortunately, the apo AI region affecting cholesterol efflux remains undetermined (33,34).
Electron paramagnetic resonance studies of site-directed nitroxide spin labels have been used previously to refine the apo AI HDL structure (17,18,25,35). These findings have secured distance constraints, as well as side-chain mobility and solvent accessibility, which have helped to model the apo AI structure that defines properties such as residues with surface or lipid exposure. Such accessibility information facilitates the design of Gd[MTS-ADO3A]-labeled apo AI, which will optimize MRI contrast enhancement. From a collection of sites that have been identified with exposure to the aqueous environment (17,35), two residues (Ser55 and Glu76), distant from the termini, appear to be promising sites for selective Cys mutation. These sites do not play any key role in HDL metabolism. Thus, Ser55 and Glu76 were mutated to Cys, expressed and purified, and reacted with Gd[MTS-ADO3A] to generate candidate MRI contrast agents. Although, in both cases, the probe is predicted to have aqueous exposure, the specific interactions differ. Attachment of Gd[MTS-ADO3A] at position 55 would place the probe at the apex of the hydrophilic surface, whereas attachment at position 76 would position the probe near the water–headgroup interface.
The specific (S55C and Q76C) mutations do not alter significantly any observed apo AI structure, function and stability. Apo AI appears to tolerate these mutations, and about 200 other single-Cys mutations, without any deleterious impairment of protein structure, function or stability. Indeed, apoAI S55C lipidates with t1/2 similar to that of wild-type apo AI (Supporting information Fig. S1) (25).
Relaxivity of Gd[MTS-ADO3A]apo AI
Free Gd[MTS-ADO3A], Gd[MTS-ADO3A]apo AI and Gd[MTS-ADO3A]apo AI in rHDL (Gd[MTS-ADO3A]apo AI-rHDL) induce different water relaxivity properties. Although the model shows a similar protein environment and solvent accessibility for positions 55 and 76, Gd[MTS-ADO3A] attached to the mutated Cys in position 55 vs 76 produces distinct relaxivity characteristics. Free Gd[MTS-ADO3A] also induces a higher relaxivity than gadodiamide (7.7 vs 3.3 mm−1 s−1).
The Gd[MTS-ADO3A]-induced water relaxivity of 7.7 mm−1 s−1 at 8.9 T in this study exceeds by 20–40% the values of 5.5–6.5 mm−1 s−1 observed at 0.5 T in a previous report (16). Based on the Solomon–Bloomberg–Morgan theory, no apparent field-dependent term would raise the relaxivity of a small molecule from 0.5 to 8.9 T (16). It appears that the higher relaxivity observed in the present study arises most probably from radiation damping, because the high-resolution probe used in the 8.9-T experiments has a better Q and filling factor for the inversion recovery experiments than the coil used in the 0.5-T experiments (36).
Attached to apo AI, Gd[MTS-ADO3A] induces a water relaxivity of 2 vs 4 mm−1 s−1 for apo AI S55C and Q76C, respectively. The Q76C mutation appears to have a slightly higher solvent exposure than S55C. However, on binding to reconstituted HDL, Gd[MTS-ADO3A] attached to position 55 induces a much higher water relaxivity (11.7 vs 5.1 mm−1 s−1). The observation suggests that Gd[MTS-ADO3A] linked to Cys at position 55 has a greater solvent exposure than Cys at 76 in the apoAI–rHDL complex.
The mechanism underlying the shifting relaxivity values on Gd[MTS-ADO3A]apo AI binding to rHDL remains presently unclear. Although the rotational correlation time increases on binding to rHDL and will increase the relaxivity concomitantly, the standard NMR dispersion profile shows relaxivity peaking at a field of less than 1 T (37,38). These initial observations require further NMR dispersion, 17O, 1/T2P and electron paramagnetic resonance experiments to clarify the mechanism underlying the relaxivity of Gd[MTS-ADO3A]apo AI-S55C-rHDL.
Basis for apo AI imaging in vivo
The relaxivity of Gd[MTS-ADO3A]apo AI-S55C-rHDL leads to an estimate of the protein concentration required to detect an observable image enhancement in vivo (39). Given the infusion protocol, a final Gd-apo AI-rHDL concentration of 0.2 mm in blood should yield about a 20–30% image contrast enhancement relative to normal liver tissue with a T1 value of about 1 s. Any free Gd[MTS-ADO3A]apo AI-S55C would contribute less to image enhancement, because the lipidated Gd[MTS-ADO3A]apo AI-S55C induces a five-fold higher water relaxivity than unlipidated Gd[MTS-ADO3A]apo AI-S55C. Because the literature contains many imaging studies using gadodiamide, in contrast with the novel Gd[MTS-ADO3A], the imaging experiments used Gd[DPTA-BMA] as the reference image contrast agent. Both free Gd[MTS-ADO3A] and Gd[DPTA-BMA] should act as nonspecific image contrast agents with very short half-life in blood and unrestricted intraperitoneal penetration. They should enhance only the kidney image, as observed.
A comparative analysis of Gd[DO3A] functionalized to conjugate with the polymer N-(2-hydroxypropyl)methacrylamide (HPMA) with Gd[MTS-ADO3A]apo AI-S55C supports a specific interaction of the modified apo AI with liver. Although the 28-kDa fraction of Gd[DO3A]HPMA has a similar molecular weight to Gd[MTS-ADO3A]apo AI-S55C and, at 3 T, induces a water relaxivity of 11.7 mm−1 s−1, Gd[DO3A]HPMA clears rapidly from the liver within the first 30 min after infusion, consistent with a nonspecific washout of the contrast agent (40). In contrast, the liver image intensity after infusion of Gd[MTS-ADO3A]apo AI-S55C continues to increase. Given the biodistribution characteristics of Gd[DO3A] HPMA, the Gd[MTS-ADO3A]apo AI-S55C-rHDL disk size and the continuing increase in the image intensity after the injection of Gd[MTS-ADO3A]apo AI-S55C, the enhanced liver image suggests a specific interaction or uptake of Gd[MTS- ADO3A]apo AI-S55C in vivo.
Localization of Gd3+ in vivo
Once injected into the animal, Gd[MTS-ADO3A]apo AI produces an image enhancement in liver and kidney, the two major organs in which apo AI catabolism occurs. ICPMS analysis confirms that Gd3+ remains bound to apo AI and provides a major source of image enhancement.
In Western blotting, the apo AI antibody highlights two distinct bands at approximately 25 and 75 kDa in the liver and kidney from animals infused with Gd[MTS-ADO3A]apo AI. The 25-kDa band corresponds to apo AI, which has a molecular weight of 28 kDa, whereas the 75-kDa band corresponds to an apo AI oligomer resistant to the detergent action of SDS. Previous studies have reported the presence of SDS-resistant apo AI oligomers from tissue extracts (31). Western blotting on the same samples using a monoclonal antibody directed against the poly-His tag on the recombinant apo AI detected primarily the dimer and tetramer species of apo AI (data not shown) (17). Thus, the preponderance of apo AI monomers and trimers on the Western blot indicates the greater accessibility of the epitope in these species, rather than a greater distribution in the SDS gel.
The antibody does not detect any endogenous apo AI in tissues receiving gadodiamide, because mouse monoclonal antibody directed against human apo AI exhibits minimal cross-reactivity with mouse apo AI. In contrast, gadodiamide infusion yields only a detectable trace of Gd3+. For gadodiamide, nonspecific interaction most probably gives rise to the presence of Gd3+ in the 25-kDa band, as the Western blot detects no apo AI. Moreover, gadodiamide must bind nonspecifically to other proteins, as the kidney image enhances significantly, more than the detected trace amount of Gd3+ would suggest.
ICPMS analysis
ICPMS analysis of the 25-kDa bands from the SDS-PAGE gel indicates the presence of Gd3+ in the liver and kidney of animals infused with Gd[MTS-ADO3A]apo AI, and shows a Gd3+ level 10 times above the ICPMS detection threshold. Liver samples show a slightly higher concentration. No Gd3+ is found in the running front of the SDS-PAGE gel, where low-molecular-weight compounds, such as free Gd3+ or Gd[MTS-ADO3A], would appear. These observations support the view that Gd[MTS- ADO3A] remains covalently linked to apo AI and that the Gd[MTS-ADO3A]apo AI complex gives rise to the image enhancement.
ICPMS analysis of the 25-kDa bands from the SDS-PAGE gel shows that the liver and kidney in the animals receiving Gd[MTS-ADO3A]apo AI-S55C (A5L and A5K) still retain intact Gd[MTS-ADO3A]apo AI-S55C. In animals receiving only gadodia-mide, ICPMS detects, in the 25-kDa gel bands from liver and kidney extracts (03L and 03K), 3.4 × 10⁻³ and 3.7 × 10⁻³ ppb Gd3+, respectively. ICPMS analysis of the similar bands (A5L and A5K) from the liver and kidney extracts of animals receiving Gd[MTS-ADO3A]apo AI-S55C reveals two to three times higher [Gd3+] of 7.1 × 10⁻³ and 9.0 × 10⁻³ ppb Gd3+, respectively.
Implication of using Gd[MTS-ADO3A]apo AI as an MRI contrast agent
Many studies have used rHDL to develop rHDL imaging particles that can detect vulnerable atherosclerotic plaques (14,41,42). These rHDL particles, reconstituted with either apo AI or apo AI-mimicking peptide, contain GdDTPA-conjugated phospholipids, which serve as the relaxation agents. Glickson et al. (43,44) have presented a comprehensive summary of the incorporation of contrast agents in HDL and LDL molecules by surface loading (nonspecific incubation of gadolinium chelates), protein loading (apolipoprotein modification to alter the metabolic pathway of LDL) and core loading of contrast agents that serve as excellent tools for diagnostics, as well as drug delivery.
The method used in this work employs specific surface loading of contrast agent to the lipoprotein on HDL, which combines the advantages of both protein loading and surface loading, with minimal or no change to the protein function. Using modified apo AI as the molecular framework to create the contrast agent by conjugating Gd[MTS-ADO3A] presents an alternative approach that can potentially yield an improved rHDL contrast agent. In contrast with GdDTPA-conjugated phospholipids in the lipid core of rHDL, parts of apo AI face the solvent and exchange readily with the surrounding water molecules. Moreover, the modified apo AI presents potentially multiple Cys mutation sites for Gd[MTS-ADO3A] conjugation. Conjugated Gd3+ at multiple sites could improve markedly the relaxivity of the rHDL image contrast agent.
CONCLUSIONS
This report demonstrates that selective Cys mutation of apo AI can present a linkage site for the paramagnetic molecule Gd[MTS-ADO3A] to form an MRI contrast nanoparticle, which can follow the dynamic process of HDL formation and catabolism in vivo (45-48). Such modified apo AI rHDL contrast agents will yield insight into the biodistribution and metabolism of HDL, and will aid in the development of rHDL nanodisks for application in drug delivery, gene therapy and clinical diagnosis (22,23).
Supplementary Material
Acknowledgments
We gratefully acknowledge funding support from NIH GM 58688 (TJ), Philip Morris 005510 (TJ), Specific Cooperative Agreement No # 58-5306-1-447 between USDA, ARS, Western Human Nutrition Research Center and the School of Medicine, University of California Davis (TJ and MVL), American Heart Association Western States Affiliate 0265319Y (UK), the Swedish Research Council (JL), the Royal Swedish Academy of Sciences (JL), the research service of the Department of Veterans Affairs, NCHCS, Mather, CA (GAK), the Paul F. Gulyassy endowment funds (GAK and TJ), the support of the Dialysis Clinic Inc. (GAK), the collegiality of Dr. Fitzroy Curry, and the technical assistance of Kathie Howes, Joel Commisso, Dr. Jeff Walton, and Dr. Jeff de Ropp.
Abbreviations used
- apo AI
apolipoprotein AI
- apo AI-Q76C
glutamine to cysteine mutation in position 76 of apo AI
- apo AI-S55C
serine to cysteine mutation in residue 55 of apo AI
- CAD
coronary artery disease
- Cys
cysteine
- DMPC
dimyristoyl phosphatidylcholine
- GdDTPA-BMA
gadolinium diethyle-netriaminepentaacetic acid-bismethylamide (gadodiamide)
- GdDTPA-DMPE
gadolinium 1,2-dimyristoyl-sn-glycero-3-phosphoethanolamine diethylene-triaminepentaacetic acid
- Gd[MTS-ADO3A]
gadolinium methanethiosulfonate
- Gln
glutamine
- HDL
high-density lipoprotein
- HPMA
N-(2-hydroxypropyl)methacrylamide
- ICPMS
inductively coupled plasma mass spectrometry
- LCAT, lecithin
cholesterol acyltransferase
- LDL
low-density lipoprotein
- rHDL
reconstituted HDL
- SDS-PAGE
sodium dodecylsulfate-polyacrylamide gel electrophoresis
Footnotes
Supporting information may be found in the online version of this article
References
- 1.Assmann G, Schulte H, von Eckardstein A, Huang Y. High-density lipoprotein cholesterol as a predictor of coronary heart disease risk. The PROCAM experience and pathophysiological implications for reverse cholesterol transport. Atherosclerosis. 1996;124(Suppl):S11–S20. doi: 10.1016/0021-9150(96)05852-2. [DOI] [PubMed] [Google Scholar]
- 2.Zannis VI, Chroni A, Krieger M. Role of ApoA-I, ABCA1, LCAT, and SR-BI in the biogenesis of HDL. J Mol Med. 2006;84:276–294. doi: 10.1007/s00109-005-0030-4. [DOI] [PubMed] [Google Scholar]
- 3.Fielding CJ, Fielding PE. Molecular physiology of reverse cholesterol transport. J Lipid Res. 1995;36:211–228. [PubMed] [Google Scholar]
- 4.Barter P, Kastelein J, Nunn A, Hobbs R. High density lipoproteins (HDLs) and atherosclerosis; the unanswered questions. Atherosclerosis. 2003;168:195–211. doi: 10.1016/s0021-9150(03)00006-6. [DOI] [PubMed] [Google Scholar]
- 5.Meyer P, Nigam A, Marcil M, Tardif JC. The therapeutic potential of high-density lipoprotein mimetic agents in coronary artery disease. Curr Atheroscler Rep. 2009;11:329–333. doi: 10.1007/s11883-009-0049-z. [DOI] [PubMed] [Google Scholar]
- 6.Parolini C, Marchesi M, Chiesa G. HDL therapy for the treatment of cardiovascular diseases. Curr Vasc Pharmacol. 2009;7:550–556. doi: 10.2174/157016109789043856. [DOI] [PubMed] [Google Scholar]
- 7.Rousset X, Vaisman B, Amar M, Sethi AA, Remaley AT. Lecithin: cholesterol acyltransferase – from biochemistry to role in cardiovascular disease. Curr Opin Endocrinol Diabetes Obes. 2009;16:163–171. doi: 10.1097/med.0b013e328329233b. [DOI] [PMC free article] [PubMed] [Google Scholar]
- 8.Zhang Y, Zanotti I, Reilly MP, Glick JM, Rothblat GH, Rader DJ. Over-expression of apolipoprotein A-I promotes reverse transport of cholesterol from macrophages to feces in vivo. Circulation. 2003;108:661–663. doi: 10.1161/01.CIR.0000086981.09834.E0. [DOI] [PubMed] [Google Scholar]
- 9.Alexander ET, Tanaka M, Kono M, Saito H, Rader DJ, Phillips MC. Structural and functional consequences of the Milano mutation (R173C) in human apolipoprotein A-I. J Lipid Res. 2009;50:1409–1419. doi: 10.1194/jlr.M800578-JLR200. [DOI] [PMC free article] [PubMed] [Google Scholar]
- 10.Dass CR, Jessup W. Apolipoprotein A-I, cyclodextrins and liposomes as potential drugs for the reversal of atherosclerosis. A review. J Pharm Pharmacol. 2000;52:731–761. doi: 10.1211/0022357001774606. [DOI] [PubMed] [Google Scholar]
- 11.Assmann G, Nofer JR. Atheroprotective effects of high-density lipoproteins. Annu Rev Med. 2003;54:321–341. doi: 10.1146/annurev.med.54.101601.152409. [DOI] [PubMed] [Google Scholar]
- 12.Frias JC, Williams KJ, Fisher EA, Fayad ZA. Recombinant HDL-like nanoparticles: a specific contrast agent for MRI of atherosclerotic plaques. J Am Chem Soc. 2004;126:16,316–16,317. doi: 10.1021/ja044911a. [DOI] [PubMed] [Google Scholar]
- 13.Frias JC, Ma Y, Williams KJ, Fayad ZA, Fisher EA. Properties of a versatile nanoparticle platform contrast agent to image and characterize atherosclerotic plaques by magnetic resonance imaging. Nano Lett. 2006;6:2220–2224. doi: 10.1021/nl061498r. [DOI] [PubMed] [Google Scholar]
- 14.Cormode DP, Briley-Saebo KC, Mulder WJM, Aguinaldo JGS, Barazza AMY, Fisher EA, Fayad ZA. An apoA-I mimetic peptide HDL-based MRI contrast agent for atherosclerotic plaque composition detection. Small. 2008;4:1437–1444. doi: 10.1002/smll.200701285. [DOI] [PubMed] [Google Scholar]
- 15.Corbin IR, Li H, Chen J, Lund-Katz S, Zhou R, Glickson JD, Zheng G. Low-density lipoprotein nanoparticles as magnetic resonance imaging contrast agents. Neoplasia. 2006;8:488–498. doi: 10.1593/neo.05835. [DOI] [PMC free article] [PubMed] [Google Scholar]
- 16.Thonon D, Jacques V, Desreux JF. A gadolinium triacetic monamide DOTA derivative with a methanethiosulfonate anchor group. Relaxivity properties and conjugation with albumin and thiolated particles. Contrast Media Mol Imaging. 2007;2:24–34. doi: 10.1002/cmmi.121. [DOI] [PubMed] [Google Scholar]
- 17.Lagerstedt JO, Budamagunta MS, Oda MN, Voss JC. Electron paramagnetic resonance spectroscopy of site-directed spin labels reveals the structural heterogeneity in the N-terminal domain of ApoA-I in solution. J Biol Chem. 2007;282:9143–9149. doi: 10.1074/jbc.M608717200. [DOI] [PubMed] [Google Scholar]
- 18.Oda MN, Forte TM, Ryan RO, Voss JC. The C-terminal domain of apolipoprotein A-I contains a lipid-sensitive conformational trigger. Nat Struct Biol. 2003;10:455–460. doi: 10.1038/nsb931. [DOI] [PubMed] [Google Scholar]
- 19.Aime S, Barge A, Cabella C, Crich S, Gianolio E. Targeting cells with MR imaging probes based on paramagnetic Gd(III) chelates. Curr Pharm Biotechnol. 2004;5:509–518. doi: 10.2174/1389201043376580. [DOI] [PubMed] [Google Scholar]
- 20.Artemov D, Bhujwalla ZM, Bulte JW. Magnetic resonance imaging of cell surface receptors using targeted contrast agents. Curr Pharm Biotechnol. 2004;5:485–494. doi: 10.2174/1389201043376553. [DOI] [PubMed] [Google Scholar]
- 21.Lanza CM, Winter P, Caruthers S, Schmeider A, Crowder K, Morawski A, Zhang H, Scott MJ, Wickline SA. Novel paramagnetic contrast agents for molecular imaging and targeted drug delivery. Curr Pharm Biotechnol. 2009;5:495–507. doi: 10.2174/1389201043376544. [DOI] [PubMed] [Google Scholar]
- 22.Corbin IR, Chen J, Cao W, Li H, Lund-Katz S, Zheng G. Enhanced cancer-targeted delivery using engineered high-density lipoprotein-based nanocarriers. J Biomed Nanotechnol. 2007;3:367–376. [Google Scholar]
- 23.Ryan RO. Nanodisks: hydrophobic drug delivery vehicles. Expert Opin Drug Deliv. 2008;5:343–351. doi: 10.1517/17425247.5.3.343. [DOI] [PubMed] [Google Scholar]
- 24.Ryan RO, Forte TM, Oda MN. Optimized bacterial expression of human apolipoprotein A-I. Protein Expr Purif. 2003;27:98–103. doi: 10.1016/s1046-5928(02)00568-5. [DOI] [PubMed] [Google Scholar]
- 25.Lagerstedt JO, Cavigiolio G, Roberts LM, Hong HS, Jin LW, Fitzgerald PG, Oda MN, Voss JC. Mapping the structural transition in an amyloidogenic apolipoprotein A-I. Biochemistry. 2007;46:9693–9699. doi: 10.1021/bi7005493. [DOI] [PMC free article] [PubMed] [Google Scholar]
- 26.Panagotopulos SE, Witting SR, Horace EM, Hui DY, Maiorano JN, Davidson WS. The role of apolipoprotein A-I helix 10 in apolipoprotein-mediated cholesterol efflux via the ATP-binding cassette transporter ABCA1. J Biol Chem. 2002;277:39,477–39,484. doi: 10.1074/jbc.M207005200. [DOI] [PubMed] [Google Scholar]
- 27.Gallagher S. One-dimensional SDS gel electrophoresis of proteins. Curr Protoc Mol Biol. 2006;10:10.2.1–10.2.37. doi: 10.1002/0471142727.mb1002as75. [DOI] [PubMed] [Google Scholar]
- 28.Cohen SL, Chait BT. Mass spectrometry of whole proteins eluted from sodium dodecyl sulfate–polyacrylamide gel electrophoresis gels. Anal Biochem. 1997;247:257–267. doi: 10.1006/abio.1997.2072. [DOI] [PubMed] [Google Scholar]
- 29.Hoff J. Methods of blood collection in the mouse. Lab Animal. 2000;29:47–53. [Google Scholar]
- 30.Bourasset F, Dencausse A, Bourrinet P, Ducret M, Corot C. Comparison of plasma and peritoneal concentrations of various categories of MRI blood pool agents in a murine experimental pharmacokinetic model. MAGMA. 2001;12:82–87. doi: 10.1007/BF02668086. [DOI] [PubMed] [Google Scholar]
- 31.Davidson WS, Hazlett T, Mantulin WW, Jonas A. The role of apolipoprotein AI domains in lipid binding. Proc Natl Acad Sci USA. 1996;93:13,605–13,610. doi: 10.1073/pnas.93.24.13605. [DOI] [PMC free article] [PubMed] [Google Scholar]
- 32.Davidson WS, Thompson TB. The structure of apolipoprotein A-I in high density lipoproteins. J Biol Chem. 2007;282:22,249–22,253. doi: 10.1074/jbc.R700014200. [DOI] [PubMed] [Google Scholar]
- 33.Frank PG, Marcel YL. Apolipoprotein A-I: structure–function relationships. J Lipid Res. 2000;41:853–872. [PubMed] [Google Scholar]
- 34.Smith LE, Davidson WS. The role of hydrophobic and negatively charged surface patches of lipid-free apolipoprotein A-I in lipid binding and ABCA1-mediated cholesterol efflux. Biochim Biophys Acta. 2010;1801:64–69. doi: 10.1016/j.bbalip.2009.09.012. [DOI] [PMC free article] [PubMed] [Google Scholar]
- 35.Martin DD, Budamagunta MS, Ryan RO, Voss JC, Oda MN. Apolipoprotein A-I assumes a ‘looped belt’ conformation on reconstituted high density lipoprotein. J Biol Chem. 2006;281:20,418–20,426. doi: 10.1074/jbc.M602077200. [DOI] [PubMed] [Google Scholar]
- 36.Eykyn TR, Payne GS, Leach MO. Inversion recovery measurements in the presence of radiation damping and implications for evaluating contrast agents in magnetic resonance. Phys Med Biol. 2005;50:N371–N376. doi: 10.1088/0031-9155/50/22/N03. [DOI] [PubMed] [Google Scholar]
- 37.Caravan P, Ellison JJ, McMurry TJ, Lauffer RB. Gadolinium(III) chelates as MRI contrast agents: structure, dynamics, and applications. Chem Rev. 1999;99:2293–2352. doi: 10.1021/cr980440x. [DOI] [PubMed] [Google Scholar]
- 38.Merbach AE, Toth E. The Chemistry of Contrast Agents in Medical Magnetic Resonance Imaging. John Wiley & Sons; New York: 2001. [Google Scholar]
- 39.Gambarota G, Veltien A, van Laarhoven H, Philippens M, Jonker A, Mook OR, Frederiks WM, Heerschap A. Measurements of T-1 and T-2 relaxation times of colon cancer metastases in rat liver at 7T. Magn Reson Mater Phys Biol Med. 2004;17:281–287. doi: 10.1007/s10334-004-0068-2. [DOI] [PubMed] [Google Scholar]
- 40.Wang Y, Ye F, Jeong E-K, Sun Y, Parker DL, Lu Z-R. Noninvasive visualization of pharmacokinetics, biodistribution, and tumor targeting of poly[N-(2-hydroxypropyl)methacrylamide in mice using contrast enhanced MRI. Pharm Res. 2007;24:1208–1216. doi: 10.1007/s11095-007-9252-1. [DOI] [PubMed] [Google Scholar]
- 41.Frias JC, Lipinski MJ, Lipinski SE, Albelda Modified lipoproteins as contrast agents for imaging of atherosclerosis. Contrast Mol Imaging. 2007;2:16–23. doi: 10.1002/cmmi.124. [DOI] [PubMed] [Google Scholar]
- 42.Cormode DP, Skajaa T, van Schooneveld MM, Koole R, Jarzyna P, Lobatto ME, Calcagno C, Barazza A, Gordon RE, Zanzonico P, Fisher EA, Fayad ZA, Mulder WJ. Nanocrystal core high-density lipoproteins: a multimodality contrast agent platform. Nano Lett. 2008;8:3715–3723. doi: 10.1021/nl801958b. [DOI] [PMC free article] [PubMed] [Google Scholar]
- 43.Glickson JD, Lund-Katz S, Zhou R, Choi H, Chen IW, Li H, Corbin I, Popov AV, Cao W, Song L, Qi C, Marotta D, Nelson DS, Chen J, Chance B, Zheng G. Lipoprotein nanoplatform for targeted delivery of diagnostic and therapeutic agents. Mol Imaging. 2008;7:101–110. [PubMed] [Google Scholar]
- 44.Glickson JD, Lund-Katz S, Zhou R, Choi H, Chen IW, Li H, Corbin I, Popov AV, Cao W, Song L, Qi C, Marotta D, Nelson DS, Chen J, Chance B, Zheng G. Lipoprotein nanoplatform for targeted delivery of diagnostic and therapeutic agents. Adv Exp Med Biol. 2009;645:227–239. doi: 10.1007/978-0-387-85998-9_35. [DOI] [PubMed] [Google Scholar]
- 45.Kaysen GA, Hoye E, Jones H., Jr Apolipoprotein AI levels are increased in part as a consequence of reduced catabolism in nephrotic rats. Am J Physiol. 1995;268:F532–F540. doi: 10.1152/ajprenal.1995.268.3.F532. [DOI] [PubMed] [Google Scholar]
- 46.Hovingh GK, de Groot E, van der Steeg W, Boekholdt SM, Hutten BA, Kuivenhoven JA, Kastelein JJ. Inherited disorders of HDL metabolism and atherosclerosis. Curr Opin Lipidol. 2005;16:139–145. doi: 10.1097/01.mol.0000162318.47172.ef. [DOI] [PubMed] [Google Scholar]
- 47.Horowitz BS, Goldberg IJ, Merab J, Vanni TM, Ramakrishnan R, Ginsberg HN. Increased plasma and renal clearance of an exchangeable pool of apolipoprotein A-I in subjects with low levels of high density lipoprotein cholesterol. J Clin Invest. 1993;91:1743–1752. doi: 10.1172/JCI116384. [DOI] [PMC free article] [PubMed] [Google Scholar]
- 48.Miida T, Miyazaki O, Hanyu O, Nakamura Y, Hirayama S, Narita I, Gejyo F, Ei I, Tasaki K, Kohda Y, Ohta T, Yata S, Fukamachi I, Okada M. LCAT-dependent conversion of prebeta1-HDL into alpha-migrating HDL is severely delayed in hemodialysis patients. J Am Soc Nephrol. 2003;14:732–738. doi: 10.1097/01.asn.0000046962.43220.8a. [DOI] [PubMed] [Google Scholar]
Associated Data
This section collects any data citations, data availability statements, or supplementary materials included in this article.