

Abstract
Calculating NMR relaxation effects for proteins with dynamics on multiple timescales generally requires very long trajectories based on conventional molecular dynamics simulations. In this report, we have built Markov state models from multiple MD trajectories and used the resulting MSM to capture the very fast internal motions of the protein within a free energy basin on a time scale up to hundreds of picoseconds and the more than three orders of magnitude slower conformational exchange between macrostates. To interpret the relaxation data, we derive new equations using the model free framework which includes two slowly exchanging macrostates, each of which also exhibits fast local motions.. Using simulations of HIV-1 Protease as an example, we show how the populations of slowly exchanging conformational states as well as order parameters for the different states can be determined from the NMR relaxation data.
Keywords: HIV-1 protease, molecular dynamics, kinetic network, two-state exchange, NMR theory
Introduction
The study of the dynamics of proteins can help us to understand the mechanisms of molecular recognition which underly such processes as ligand binding, allosteric inhibition, and signaling.1,2 Human immunodeficiency virus type 1 protease (HIV-1 PR) is an enzyme involved in the processing of gag-pol polyproteins, a critical step for the viral maturation and the life cycle of HIV-1. Many x-ray crystal structures 4 of HIV-1 PR have been solved in both the free state and in complex with inhibitors. The free state (e.g. PDB 1HHP), without inhibitors bound, is defined by a semiopen conformation which is a C2 symmetric homodimer with a substrate-binding pocket loosely covered by two β-hairpins (the flaps). When complexed with inhibitors (e.g. PDB 1HVR), however, HIV-1 PR has a closed form. Namely, the two flaps close in toward the bottom of the active binding site and form a complete cavity closure; in addition there is a change in the relative orientation of the flaps (i.e. change in “handedness”). To accomplish ligand binding, it is thought that the two flaps have to open further to allow for the access of the ligand to the active site.5 Such an open state (PDB 1TW7) was found in a crystal structure which was determined to be stabilized by crystal packing contacts.6 (See Figure 1 for pictures of the four macrostates of HIV-1 PR).
Figure 1.
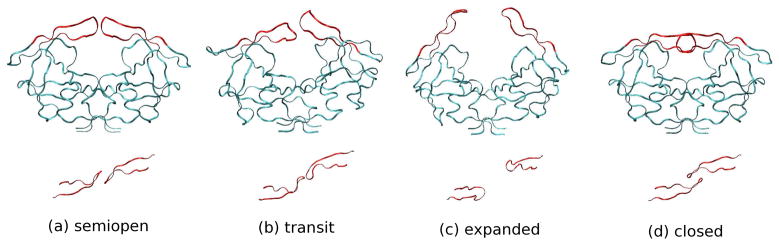
Four macrostates of HIV-1 PR from crystal structures and our MD simulation with the OPLS-AA force field and the AGBNP implicit solvent model. (Up: side view, Bottom: top view of flaps only) (a) semiopen crystal structure (PDB 1HHP), (b) transit state from MD simulation (RMSD from the semiopen is 2.61), (c) expanded state (similar to PDB 1TW7) from MD simulation (RMSD from the semiopen is 6.47), and (d) closed crystal structure (PDB 1HVR without ligand, RMSD from the semiopen is 3.26). Residue 51 and 52 are located in the tip of each flap.
Obtaining dynamical information for HIV-1 PR in solution, however, requires resorting to other techniques, such as nuclear magnetic resonance (NMR) relaxation R1/R2/NOE,7–9 chemical exchange from Carr-Purcell-Meiboom-Gill (CPMG) and spin-lock experiments,10 and electron paramagnetic resonance (EPR) experiments.11 Through measurements of R1/R2/NOE, the Torchia group found that residues in the flap tips are flexible on the sub-nanoseconds (ns) timescale.9 Chemical exchange experiments10 however showed that the flaps undergo significant rearrangement from the semiopen to the closed state on a much longer time scale of up to 100 microseconds (μs). Typically, NMR relaxation parameters (R1/R2/NOE) have been used to probe sub-ns fast motions,12,13 because the application of the popular model-free approach14,15 to their interpretation requires that the internal motions be separated from overall rotations and decay on a much faster time scale than the tumbling. In contrast, chemical exchange effects probed by CPMG and spin-lock experiments16 detect much slower motions on the μs to ms timescale associated with larger conformation changes. These transitions are typically modeled as occurring between macrostates (free energy basins) which lack internal motion, e.g. they are assumed to be rigid. In this paper we provide a framework for extracting information from NMR relaxation measurements (R1/R2/NOE) about the populations of interconverting macrostates which also undergo fast motions within the macrostates. We show how the model-free approach to extract order parameters for fast motions within a single macrostate can be extended to include fast motions within two (or more) macrostates and the much slower conformational exchange between them. The expression for the NMR relaxation simplifies in two limits: when the conformational exchange is much slower than the tumbling (the common situation), or much faster than the tumbling.
Many molecular dynamics simulations6,17–27 of HIV-1 PR have been performed, the general picture that emerges is consistent with experimental results although the transition timescales between macrostates estimated from MD results are much faster than experiments suggest.10 The unliganded HIV-1 PR in solution predominantly occupies a semiopen macrostate and also there is a closed state component.17–19,22,28 The transition between the semiopen state and the closed state can be achieved through large conformational rearrangements of the two β-sheet flaps and may also involve other intermediates such as the transient open state.6,16–19,24 A major drawback of standard MD simulations is that the current computer power limits the timescales that can be simulated to values where only a very small number of slow conformational changes on times of the order of μs can be observed and therefore the ability to converge quantities like NMR correlation functions for the internal motions is severely compromised. Early simulations only lasted from a few hundred picoseconds (ps)28 to several ns.18,19 Simmerling’s group utilized an implicit solvent model29 and extended the timescale to ~40 ns.22,23 More recent reports25 have included explicit waters and reached 100 ns. The latest GPUGRID project (http://gpugrid.net) performed large ensembles (461) of explicit solvent MD simulations each with an average simulation time of 50 ns.26
To reach simulations lasting tens of microseconds or longer in a single trajectory, either we have to resort to special purpose computers such as Anton from D. E. Shaw research30,31 or more advanced simulation methods.17,20,21,27,28,32 Coarse-grained models20,21 reduce an atomic residue to one bead and enable dynamical simulations on the timescale of tens of μs, but with the sacrifice of atomic details and the elimination of all fast modes, which may be important for modeling the motions of larger protein segments like the HIV PR flaps. Accelerated MD simulations such as metadynamics32 have been performed to study the substrate binding mechanism of HIV-1 PR using a 1.6 μs trajectory with explicit solvent. Although accelerated methods are able to locate free energy minima and construct free energy surfaces, on a shorter simulation timescale than standard MD methods, the real dynamics of conformational changes is difficult to recover. Furthermore, many accelerated methods require a predefinition of reaction coordinates and are limited to problems in low dimensions. To obtain protein folding trajectories on the timescale of μs, recently our group33–36 developed a framework using Gillespie stochastic simulations44 based on Markov state models37–41(MSM) that were constructed from atomistic replica exchange molecular dynamics (REMD) simulations.42–44 We were able to generate μs trajectories for HIV-1 PR at six different temperatures and to compute transition pathways between different native forms of HIV-1 PR and to determine key features of the kinetics without specifying the reaction coordinates in advance.27
In principle NMR relaxation parameters can be calculated directly by analyzing MD trajectories45–48 although it requires very long simulations, at least an order of magnitude longer than the slowest decay of the motions of interest. Trajectories of duration tens of microseconds or longer are needed to capture the effects of slow conformational exchange on NMR parameters.49–56 In this report we use Markov state models37–41 to generate stochastic trajectories lasting 10 microseconds for HIV-1 PR and we compute the corresponding NMR correlation functions. We show how the results can be interpreted using a model free framework that includes fast internal motions coupled with slow conformational exchange.
Theory and Methods
Building the Markov state kinetic network model
Recently, Markov state models37–41,56–58 have been constructed to study the complex dynamics of proteins on long time scales, including larger scale conformational transitions,27,60,61 protein folding,33,36,43,62,63 and ligand binding.32,64 In these models the conformational space is discretized onto a set of states and a network connecting them is constructed from short time MD simulations, for example. The construction of a transition matrix to connect the states is crucial; it can be constructed from an energy-landscape approach41,65 based on the energy minima and first-order saddle points, a dynamical approach utilizing short66,67 or long MD simulations62 and Bayesian techniques,63,68–70 or by utilizing REMD42 and constructing links based on structural similarity.27,33,35,36 In a previous study27 of the kinetics of HIV-1 PR using a Markov state model, we analyzed pathways for opening the flaps of HIV-PR at different temperatures using transition path theory. In this report we build a kinetic network at finer resolution and compute NMR relaxation effects from the stochastic trajectories on the network. The details regarding the MD simulations of HIV-1 PR dimer, the construction of the kinetic network, and the stochastic simulation are described in our previous work27,33,36 and the supporting information (SI). Briefly, 20 MD simulations of HIV-1 PR each of duration 20 ns were performed using the molecular simulation package IMPACT71 with the OPLS-AA force field (2005),72 and the AGBNP implicit solvent model.73,74 To build the network, we first chose 200000 snapshots which were stored every 2 ps from the 20 MD trajectories each of length 20 ns, and calculated the C-α RMSD matrix for both flaps (residues 43–58 and 142–157) between each pair of snapshots, which requires storage of 4 × 10¹⁰ matrix elements. These snapshots were clustered into 82291 conformational nodes using an RMSD criteria of 0.5 Å and each node has a corresponding snapshot. (See Figure 3S in SI for the distributions of these clustered nodes, the classification of these nodes to four macrostates, and the positions four macrostates when they are projected onto the first two principal components.) The kinetic network of conformational nodes was created by connecting all pairs of nodes which have node snapshot RMSDs < 1.2 Å. The rate constant kij between any two connected nodes was parameterized to fit the short time molecular dynamics using Eq. 6 in the SI. The key idea is that large conformational changes are propagated by many local transitions through structurally similar nodes. This assumption is reasonable when the resolution of the network model is high; in a high resolution network the local kinetics on the network is largely diffusive; large scale conformational kinetics are determined by a combination of local diffusive motions and the varying density of the network nodes along the transition paths which determines the probability of being at a barrier. We note that this approach is similar in spirit to the method of estimating the rate matrix from metadynamics trajectory data by Laio et al.32,91 except that in our approach the MD is not biased along predetermined reaction coordinates. A 10-μs trajectory was generated from the Gillespie stochastic simulation44 on the kinetic network starting from a node in the semiopen state.
Two-macrostate exchange model with internal motion for NMR relaxation
For a molecule with a single free energy minimum significantly lower than all the others, the model-free approach14 and its extended version15 is the main theoretical framework used to estimate structural and dynamical information from NMR fast relaxation experiments by neglecting the other free energy basins. Namely, the global free energy minimum defines a macrostate and the fast local fluctuations around the minimum are sufficient to explain NMR relaxation quantities such as R1/R2/NOE. Due to its simplicity and generality, the model free framework is the main way that NMR fast relaxation measurements on proteins are analyzed,8,9 with the diffusion tensor describing the overall rotation and the order parameter S2 and decay constant τe representing local internal motions of each residue that can be fitted from the experimental values of R1/R2/NOE. This framework, however, will fail if there exists large conformational changes to other macrostates and the populations of the other states are not substantially smaller than the major one. For the case of HIV-1 PR, previous analysis based on this model free framework could not provide distinct values for the populations of the semiopen and closed states.8,9 To extract the populations of two macrostates and information about their fast internal motions and slow conformational exchange from NMR relaxation experiments, we have derived general equations for the rotational correlation functions of spin-pin vectors using a model which includes these effects. The results for the two-state exchange model between free energy basins which also includes fast internal motions within each basin as depicted in Figure 2 are presented below. Assuming the existence of a common diffusion tensor and the exchange time is well-defined between two states which can be described locally by the model-free approach,14 we found that the internal rotational correlation function of a spin-spin vector can be written as (Eqs. 35, 36 and 37 of SI),
Figure 2.

Two-state conformation exchange model. The macromolecule has two distinct conformation states A and B which share the same principal coordinates frame (diffusion tensor). (a) free energy representation, (b) motions represented by different coordinate frames, (c) schematic graph for a rotational correlation function of internal motions.
| (1) |
with
| (2) |
and
| (3) |
As shown in Figure 2, the correlation function converges to three important values on different time scales (Eqs. 40, 41, and 42 of SI):
| (4) |
| (5) |
| (6) |
where PA(PB), S2A(S2B), τeA(τeB) denote the equilibrium populations, generalized order parameters, and time constants of internal motions from the model-free theory, for the two distinct macrostates (A and B) respectively, and θAB is the angle between the two equilibrium positions of a spin-spin vector in state A and state B. P(2)(x) is the second order Legendre polynomial. τEX is the time constant of two-state exchange which is related to the two rate constants (A → B and B → A) by τEX = 1/(kAB+kBA). After multiplying the overall rotation and internal correlation functions (Eqs. 45 and 46 of SI) and Fourier-transforming, Eqs. 1 to 6 provide a new way to extract equilibrium and dynamics information for the individual macrostates and the exchange rate between them from NMR relaxation data.
Which equation (Eq. 5 or 6) to fit the data to depends on the relative timescales of overall rotation τM (τ1, τ2, and τ3 for anisotropic cases) and conformational exchange τEX. When τe ≪ τM ≪ τEX (slow exchange model), the decay of overall rotation is much quicker than the rate of exchange between the two macrostates, CI(t) → F(t) and the second plateau Eq. 6 is averaged out by the tumbling. In contrast, both plateaus, Eq. 5 and Eq. 6, contribute in the fast exchange limit when τM ≫ τEX ≫ τe.
Results and Discussion
Constructing a ten-microsecond trajectory from the kinetic network model
A 10 μs trajectory was obtained from the stochastic simulations on the kinetic network constructed from 20 short MD trajectories each of length 20 ns (see Section I in SI). 3,123,612 conformational snapshots were saved for analysis once a transition to new node occurs (Note that snapshots are not evenly distributed for a Gillespie simulation). In Figure 3, we display the RMSD time series of the two flaps by aligning all conformational snapshots to the semiopen crystal state (PDB 1HHP). The trajectory starts from a conformational node in the semiopen state and experiences 79 transition events from the semiopen to the closed conformation, and from the closed to semiopen state respectively. The mean first passage time for the former is 95.0 ns and 30.8 ns for the later and results in an estimated exchange time of 23.3 ns. This result is consistent with our previous work20 where the kinetic network was built from REMD conformations sampled at different temperatures and weighted to the target temperature using the T-WHAM method.75
Figure 3.

Time series of RMSDs from the semiopen crystal state in different simulation trajectories. The color lines mark the RMSDs of four states in Figure 1. (a) 10 μs network simulation, (b) 280–300 ns part of (a), (c) 20 ns from one of the short MD simulations.
The transition timescale (~100 ns) from the semiopen to the closed state is consistent with other simulation results.22,25–27 However, it is apparently much faster than the experimentally estimated relaxation time which is of the order of 70 μs.10 This discrepancy might be due to two factors, one experimental and the other computational. The measured chemical shift differences used to extract the transition timescale from the CPMG experiment10 may correspond to the differences between the semiopen state and the expanded one (with smaller population and longer exchange time27) instead of the differences between the semiopen and the closed state. Secondly, the discrepancy may be due to the protein force field and the use of an implicit solvent model which does not include the frictional effects of the solvent on the motion. Early MD simulations18,19,28 were able to observe the flap opening from the semiopen state (e.g. the semiopen to the transit state in Figure 3) but not the transition to the closed state. Recently the Simmerling group22 found a transition of the semiopen to the closed state within 10 ns using the AMBER FF99 force field76 and the implicit (Generalized Born) model29 with low viscosity, but no transitions within 45ns with the addition of explicit waters. More recent simulations25 with the AMBER FF99 and TIP3P explicit water model exhibited one transition on the 100ns timescale. We emphasize that our 10 μs MSM trajectory provides many more observations of transitions in a series from the semiopen to transit, to expanded, and back to the closed state than previous simulations.
The colored lines in Figure 3 mark four states shown in Figure 1. Also shown in Figure 3 are a 20 ns segment (Fig. 3(b)) from the MSM trajectory and a 20 ns segment (Fig. 3(c)) from the MD trajectory respectively. The MSM and MD trajectories exhibit very similar behavior. The semiopen and the closed states have longer lifetimes than the other two metastable states. The transit state is a metastable intermediate with a short lifetime (several ns). The expanded state is visited after the transit state and has the shortest lifetime compared with the other three (less than 1 ns).
Correlation functions and NMR parameters from the network MSM trajectory
Figure 4 shows the internal rotational correlation functions and plateaus on different time scales (the first 100ps and up to 250 ns) for the N-H vectors of residues 51 and 52, computed from the 10 μs network MSM trajectory. (More correlation functions of residues in the floppy flap regions are included in Figure 4S and 5S.) From these figures, we can see that the correlation functions for some residues (e.g. 40, 47 and 60) decay and reach the plateau value (S2P2, equilibrium S2(CI(∞))) very quickly, on a time scale of ps. For other residues (e.g. 49, 50, 51 and 52) instead, the correlation functions have a very quick initial decay (ps) to an initial plateau (S2P1), then a slow decay on a much longer time scale, ~100 ns, gradually approaching the second plateau value (S2P2). The time scales for the slow decay are close to the mean first passage time of the transition from the semiopen to closed state.
Figure 4.

Comparison of internal correlation functions of the N-H vectors from residue 51 and 52: (a) and (b) are correlation functions of residue 51 and 52 at first 100 ps from the network MSM and that from the 20 ns MD trajectories, (c) and (d) are correlation functions of residue 51 and 52 up to 250ns from the network MSM and the theoretical prediction of two-macrostate slow exchange model with fast internal motion (Eq. 1 to 3). The color lines mark the calculated S2P1 and S2P2 from the network MSM.
As shown in Figures 4(a) and 4(b), the fast decay of the rotational correlation functions for residues 51 and 52 (on the flap tip) during the first 100 ps calculated from the Markov state network simulations agree well with those from the underlying MD simulations. Namely, the local dynamics within the macrostates sampled by the MD simulations are captured by the network MSM. Figure 6S shows that the equilibrium order parameters S2 (S2P2 from the average of all snapshots) calculated from the twenty MD simulations (20 ns per simulation) are consistent with those from the 10 μs network MSM trajectory. The agreement between correlation functions and order parameters calculated from the MD simulations and those calculated from the stochastic simulations on the kinetic network confirms that the construction of the network and the stochastic simulations capture the main characteristics of the fast local dynamics of the individual macrostates and the slow semiopen to closed state transition. Furthermore, as shown in Fig. 7S of SI, the calculated order parameters are qualitatively consistent with those derived from the NMR experiments,9 except that residues 51 and 52 appear less flexible when comparing the order parameters derived from the experimental NMR relaxation data with the values extracted from the MSM simulation. We should note that the residue 51 and 52 are located in the tips of two flaps and exhibit more complicated motions comparing to other residues. The experiment derivation,9 instead, only used a model-free model assuming a single free energy minima.
Figures 4(c) and 4(d) compare the rotational correlation functions for residues 51 and 52 calculated from the 10 μs network MSM trajectory with the theoretical predictions from the two-macrostate model (with fast internal motions) of Eqs. 1 to 3 using the S2 values of the semiopen and closed states in Figure 5, the populations fitted in Figure 6(b) and the exchange time of 23.3 ns. The theoretical curve of residue 51 overlaps with the one calculated directly from the network MSM very well. The prediction for residue 52 is slightly worse than that of residue 51. This is mostly due to the fact that S2P2 is sensitive to the cross term in Eq. 6 which is determined by the average angle of the spin vectors between the equilibrium positions of the semiopen and closed states. The agreement can be improved if the spin vector equilibrium positions of both states are allowed to optimize.
Figure 5.

S2 (S2P2 =CI(∞)) for all states, and two different macrostates (semiopen and closed) of HIV-1 PR, calculated from the 10 μs network trajectory. S2P2 is calculated using the equilibrium average of all snapshots or that belonging to the individual states. The legends in the figure also show the statistical populations (0.638, 0.224) of the two different states respectively. There are other states not belonging to any twos with a total population of 0.14 roughly.
Figure 6.

S2 from the 10 μs network trajectory is fitted to two-state exchange model. (a) S2P1 is estimated at t = 100ps of CI(t). (PA = 0.73 and PB = 0.27 by fitting to Eqs. 4 and 5); (b) S2P2 is calculated using equilibrium average of all snapshots and θAB is estimated from the simulation data. (PA = 0.76 and PB = 0.24 by fitting to Eqs. 4 and 6).
Fitting the model free equations to the Markov state simulation
Figure 5 displays the order parameters at long time (S2 =S2P2 =CI(∞)) calculated from the equilibrium average over the network MSM trajectory for two different macrostates: semiopen and closed, with the statistical populations of 0.638 and 0.224. (Figure 8S in SI also includes the transit and expanded states with much smaller populations of 0.012 and 0.001. Note that adding the four populations does not sum to 1.0; there is a residual population of ~ 14 % which does not correspond to well defined states.) The semiopen state is the major population and together the semiopen plus closed states contain more than 85% of the total population. This is consistent with the results of previous MD simulations22,26 and experiments.9 All four states have similar order parameter S2 profiles, except that there are large differences for residues located in the flap regions. Thus, the local motions of residues within the flaps are significantly different within the different macrostates. For residue 52, S2 is 0.2 within the closed state but is almost 0.5 in the semiopen state. It is worth pointing out that the total S2 for some residues (such as 49 and 50) are smaller than the individual values from the semiopen or closed states. This is, in contrast, different for other residues (e.g. residues 51 and 52) whose total S2 are between the values for the individual semiopen and closed states. This difference originates from the cross term in Equation 6 and is not contained within the current model-free theory.14
Due to the short life times and very small populations of the transit and expanded states, in what follows we focus on fitting the NMR data only to the semiopen and closed states. Figure 6 shows that the order parameters (S2P1 and S2P2) estimated on different time scales can be well fit to the two-state exchange model using Eqs. 4 to 6. The population of the seimopen state was found to be 0.73 and 0.76 for S2 fitted to the short (Eq. 5) and long time (Eq. 6) behavior respectively. Namely S2P1 (S2P2) calculated from the correlation functions on different time scales can be used to predict the correct populations for the semiopen and closed macrostates, which are consistent with the population statistics extracted directly from the network MSM trajectory. The resulting population of the semiopen state from fitting (~ 0.74) is ~ 10% larger than the population estimated directly from the network MSM as shown in Figure 5. This is due to the fact that ~ 14% of the conformations cannot be assigned to any of the four macrostates and these conformations are absorbed into the semiopen state by the fitting.
For the analysis presented in this section, the overall tumbling has been removed from consideration, hence we were able to fit S2 both on short and long time scales. Since the experimentally derived time scale of HIV-1 PR isotropic tumbling time9 in water is around 12 ns, which is much faster than the conformational exchange of the HIIV-1 PR flaps between the semiopen and closed macrostates,10 in practice, we can only fit experimental data to the slow-exchange model (Eqs. 4 and 5). For some systems it might be possible to adjust experimental conditions so as to vary the kinetics between the slow and fast exchange limits, by e.g. adjusting the viscosity or temperature to increase the rotational correlation time.
Conclusions
In summary, we built a Markov state kinetic network model to study the conformational dynamics of HIV-1 PR using the twenty short MD trajectories (20 ns each) to parameterize the model. The transition matrix among the microstates (network nodes) was estimated using structure similarity rather than Bayesian techniques63,68–70 In this work, we performed stochastic simulations on the kinetic network and constructed a 10 microsecond MSM trajectory to capture the dynamics of the HIV-1 PR flaps. The correlation functions and the NMR order parameters calculated from the stochastic simulation are in accord with the short MD results. Namely, we can build network MSMs from short MD simulations to study not only the short time behavior and local dynamics within the individual states but also capture the long time kinetics corresponding to conformational transitions between macrostates.
Besides the development of early theories77–81 of NMR relaxation in macromolecules and the introduction of the model-free formula,14,15 there are other theories which can be used to interpret NMR relaxation in proteins, including those with more complex treatments of the coupling of interdomain and overall motions with different diffusion tensors,82 the coupling between internal dynamics and rotational diffusion in the presence of exchange,83,84 and relaxation without separating the overall rotations from internal motions.85 In this paper we assume the overall and internal motions can be separated and we use the model-free description for the local motions within individual macrostates. We have derived the general equations (see SI) for the rotational correlation functions of spin-spin vectors for a model in which there are two slowly exchanging macrostates, each of which also exhibits fast internal motions. We have demonstrated that the correlation functions derived from this model closely resemble those calculated from the 10 microsecond stochastic Markov state trajectory of HIV-1 PR. This suggests that it should be possible to fit the experimental NMR relaxation data of HIV-1 PR to the two-macrostate slow exchange model and extract the local dynamics within the semiopen and closed states as well as the exchange rates between those two states, and their populations. (We should emphasize that the two-state model with fast internal motions within the macrostates is only an approximation to the full dynamics. Such a simple model, though more complicated than the traditional model-free approach, is not expected to reproduce all of the complex dynamics.) Such fitting procedure will help us to understand conformational changes or population shifts of HIV-1 PR due to ligand binding or drug resistant mutation revealed by MD simulations and experiments such as EPR.86–90 The major problem to be overcome is summarized below.
Generally there are three observables (R1/R2/NOE) for one spin-spin vector from a NMR relaxation experiment with one magnetic field. In contrast, the two-macrostate slow exchange model with fast internal motions requires the determination of five parameters (S2A, S2B, τeA, τeB, θAB) for the internal motions of each residue and three parameters (PA, PB, τEX) for the equilibrium and exchange information which are common to all residues as well as the diffusion tensor for overall motion. Hence the number of experimental data points is smaller than the number of the unknown parameters to fit. In order to tackle this problem, obtaining experimental NMR relation data at multiple magnetic fields is one direction to take. An alternative approach is fitting the experimental quantities from NMR relaxation of HIV-1 PR by simultaneously optimizing the diffusion tensor and the parameters describing the fast internal motions and slow conformational exchange using a genetic algorithm. Work along these lines is underway in our lab.
Supplementary Material
Acknowledgments
This work has been supported by a grant from the National Institutes of Health (GM30580) awarded to RML. MD simulations were carried out on the Gyges cluster at Rutgers supported by NIH shared instrumentation grants No. S10-RR022375 and S10-RR027444. We thank Emilio Gallicchio for the support of computer resources and for many helpful discussions.
Footnotes
Supporting Information Available
Details about the building of the Markov state kinetic network, the NMR theory and the derivation of two-state exchange model with fast internal motions, and the calculation of NMR quantities from the trajectories have been included in the supporting information. This material is available free of charge via the Internet at http://pubs.acs.org.
References
- 1.Boehr DD, Dyson HJ, Wright PE. An NMR Perspective on Enzyme Dynamics. Chem Rev. 2006;106:3055–3079. doi: 10.1021/cr050312q. [DOI] [PubMed] [Google Scholar]
- 2.Boehr DD, Nussinov R, Wright PE. The Role of Dynamic Conformational Ensembles in Biomolecular Recognition. Nat Chem Biol. 2009;5:789–796. doi: 10.1038/nchembio.232. [DOI] [PMC free article] [PubMed] [Google Scholar]
- 3.Hornak V, Simmerling C. Targeting Structural Flexibility in HIV-1 Protease Inhibitor Binding. Drug Discovery Today. 2007;12:132–138. doi: 10.1016/j.drudis.2006.12.011. [DOI] [PMC free article] [PubMed] [Google Scholar]
- 4.Vondrasek J, Wlodawer A. HIVdb: A Database of the Structures of Human Immunodeficiency Virus Protease. Proteins: Struct, Funct Genet. 2002;49:429–431. doi: 10.1002/prot.10246. [DOI] [PubMed] [Google Scholar]
- 5.Martin P, Vickrey JF, Proteasa G, Jimenez YL, Wawrzak Z, Winters MA, Merigan TC, Kovari LC. “Wide-open” 1.3 angstrom Structure of a Multidrugresistant HIV-1 Protease as a Drug Target. Structure. 2005;13:1887–1895. doi: 10.1016/j.str.2005.11.005. [DOI] [PubMed] [Google Scholar]
- 6.Layten M, Hornak V, Simmerling C. The Open Structure of a Multi-drugresistant HIV-1 Protease is Stabilized by Crystal Packing Contacts. J Am Chem Soc. 2006;128:13360–13361. doi: 10.1021/ja065133k. [DOI] [PMC free article] [PubMed] [Google Scholar]
- 7.Nicholson LK, Yamazaki T, Torchia DA, Grzesiek S, Bax A, Stahl SJ, Kaufman JD, Wingfield PT, Lam PYS, Jadhav PK, et al. Flexibility and Function in HIV-1 Protease. Nat Struct Biol. 1995;2:274–280. doi: 10.1038/nsb0495-274. [DOI] [PubMed] [Google Scholar]
- 8.Tjandra N, Wingfield P, Stahl S, Bax A. Anisotropic Rotational Diffusion of Perdeuterated HIV Protease from N-15 NMR Relaxation Measurements at Two Magnetic. J Biomol NMR. 1996;8:273–284. doi: 10.1007/BF00410326. [DOI] [PubMed] [Google Scholar]
- 9.Freedberg DI, Ishima R, Jacob J, Wang YX, Kustanovich I, Louis JM, Torchia DA. Rapid Structural Fluctuations of the Free HIV Protease Flaps in Solution: Relationship to Crystal Structures and Comparison with Predictions of Dynamics Calculations. Protein Sci. 2002;11:221–232. doi: 10.1110/ps.33202. [DOI] [PMC free article] [PubMed] [Google Scholar]
- 10.Ishima R, Freedberg DI, Wang YX, Louis JM, Torchia DA. Flap Opening and Dimer-Interface Flexibility in the Free and Inhibitor-Bound HIV Protease, and Their Implications for Function. Structure. 1999;7:1047–1055. doi: 10.1016/s0969-2126(99)80172-5. [DOI] [PubMed] [Google Scholar]
- 11.Galiano L, Bonora M, Fanucci GE. Interflap Distances in HIV-1 Protease Determined by Pulsed EPR Measurements. J Am Chem Soc. 2007;129:11004–11005. doi: 10.1021/ja073684k. [DOI] [PubMed] [Google Scholar]
- 12.Jarymowycz VA, Stone MJ. Fast Time Scale Dynamics of Protein Backbones: NMR Relaxation Methods, Applications, and Functional Consequences. Chem Rev. 2006;106:1624–1671. doi: 10.1021/cr040421p. [DOI] [PubMed] [Google Scholar]
- 13.Igumenova TI, Frederick KK, Wand AJ. Characterization of the Fast Dynamics of Protein Amino Acid Side Chains using NMR Relaxation in Solution. Chem Rev. 2006;106:1672–1699. doi: 10.1021/cr040422h. [DOI] [PMC free article] [PubMed] [Google Scholar]
- 14.Lipari G, Szabo A. Model-Free Approach to the Interpretation of Nuclear Magnetic-Resonance Relaxation in Macromolecules.1. Theory and Range of Validity. J Am Chem Soc. 1982;104:4546–4559. [Google Scholar]
- 15.Clore GM, Szabo A, Bax A, Kay LE, Driscoll PC, Gronenborn AM. Deviations from the Simple 2-Parameter-Free Appoach to the Interpretation of N-15 Nuclear Magnetic-Relaxation of Proteins. J Am Chem Soc. 1990;112:4989–4991. [Google Scholar]
- 16.Palmer AG. NMR Characterization of the Dynamics of Biomacromolecules. Chem Rev. 2004;104:3623–3640. doi: 10.1021/cr030413t. [DOI] [PubMed] [Google Scholar]
- 17.Rick SW, Erickson JW, Burt SK. Reaction Path and Free Energy Calculations of the Transition between Alternate Conformations of HIV-1 Protease. Proteins: Struct, Funct Genet. 1998;32:7–16. doi: 10.1002/(sici)1097-0134(19980701)32:1<7::aid-prot3>3.0.co;2-k. [DOI] [PubMed] [Google Scholar]
- 18.Scott WRP, Schiffer CA. Curling of Flap Tips in HIV-1 Protease as a Mechanism for Substrate Entry and Tolerance of Drug Resistance. Structure. 2000;8:1259–1265. doi: 10.1016/s0969-2126(00)00537-2. [DOI] [PubMed] [Google Scholar]
- 19.Meagher KL, Carlson HA. Solvation Influences Flap Collapse in HIV-1 Protease. Proteins: Struct, Funct Bioinf. 2005;58:119–125. doi: 10.1002/prot.20274. [DOI] [PubMed] [Google Scholar]
- 20.Chang CE, Shen T, Trylska J, Tozzini V, McCammon JA. Gated Binding of Ligands to HIV-1 Protease: Brownian Dynamics Simulations in a Coarse-Grained Model. Biophys J. 2006;90:3880–3885. doi: 10.1529/biophysj.105.074575. [DOI] [PMC free article] [PubMed] [Google Scholar]
- 21.Tozzini V, Trylska J, Chang C-e, McCammon JA. Flap Opening Dynamics in HIV-1 Protease Explored with a Coarse-Grained Model. J Struct Biology. 2007;157:606–615. doi: 10.1016/j.jsb.2006.08.005. [DOI] [PubMed] [Google Scholar]
- 22.Hornak V, Okur A, Rizzo RC, Simmerling C. HIV-1 Protease Flaps Spontaneously Open and Reclose in Molecular Dynamics Simulations. Proc Natl Acad Sci U S A. 2006;103:915–920. doi: 10.1073/pnas.0508452103. [DOI] [PMC free article] [PubMed] [Google Scholar]
- 23.Hornak V, Okur A, Rizzo RC, Simmerling C. HIV-1 Protease Flaps Spontaneously Close to the Correct Structure in Simulations Following Manual Placement of an Inhibitor into the Open State. J Am Chem Soc. 2006;128:2812–2813. doi: 10.1021/ja058211x. [DOI] [PMC free article] [PubMed] [Google Scholar]
- 24.Ding F, Layten M, Simmerling C. Solution Structure of HIV-1 Protease Flaps Probed by Comparison of Molecular Dynamics Simulation Ensembles and EPR Experiments. J Am Chem Soc. 2008;130:7184–7185. doi: 10.1021/ja800893d. [DOI] [PMC free article] [PubMed] [Google Scholar]
- 25.Li D, Ji B, Hwang K, Huang Y. Crucial Roles of the Subnanosecond Local Dynamics of the Flap Tips in the Global Conformational Changes of HIV-1 Protease. J Phys Chem B. 2010;114:3060–3069. doi: 10.1021/jp1005549. [DOI] [PubMed] [Google Scholar]
- 26.Kashif Sadiq S, De Fabritiis G. Explicit Solvent Dynamics and Energetics of HIV-1 Protease Flap Opening and Closing. Proteins: Struct, Funct Bioinf. 2010;78:2873–2885. doi: 10.1002/prot.22806. [DOI] [PubMed] [Google Scholar]
- 27.Deng NJ, Zheng W, Gallicchio E, Levy RM. Insights into the Dynamics of HIV-1 Protease: A Kinetic Network Model Constructed from Atomistic Simulations. J Am Chem Soc. 2011;133:9387–9394. doi: 10.1021/ja2008032. [DOI] [PMC free article] [PubMed] [Google Scholar]
- 28.Collins JR, Burt SK, Erickson JW. Flap Opening in HIV-1 Protease Simulated by Activated molecular-dynamics. Nat Struct Biol. 1995;2:334–338. doi: 10.1038/nsb0495-334. [DOI] [PubMed] [Google Scholar]
- 29.Tsui V, Case DA. Theory and Applications of the Generalized Born Solvation Model in Macromolecular Simulations. Biopolymers. 2000;56:275–291. doi: 10.1002/1097-0282(2000)56:4<275::AID-BIP10024>3.0.CO;2-E. [DOI] [PubMed] [Google Scholar]
- 30.Maragakis P, Lindorff-Larsen K, Eastwood MP, Dror RO, Klepeis JL, Arkin IT, Jensen MO, Xu HF, Trbovic N, Friesner RA, et al. Microsecond Molecular Dynamics Simulation Shows Effect of Slow Loop Dynamics on Backbone Amide Order Parameters of Proteins. J Phys Chem B. 2008;112:6155–6158. doi: 10.1021/jp077018h. [DOI] [PMC free article] [PubMed] [Google Scholar]
- 31.Shaw DE, Deneroff MM, Dror RO, Kuskin JS, Larson RH, Salmon JK, Young C, Batson B, Bowers KJ, Chao JC, et al. Anton, a Special-Purpose Machine For Molecular Dynamics Simulation. Communications of the ACM. 2008;51:91–97. [Google Scholar]
- 32.Pietrucci F, Marinelli F, Carloni P, Laio A. Substrate Binding Mechanism of HIV-1 Protease from Explicit-Solvent Atomistic Simulations. J Am Chem Soc. 2009;131:11811–11818. doi: 10.1021/ja903045y. [DOI] [PubMed] [Google Scholar]
- 33.Andrec M, Felts AK, Gallicchio E, Levy RM. Protein Folding Pathways From Replica Exchange Simulations and a Kinetic Network Model. Proc Natl Acad Sci U S A. 2005;102:6801–6806. doi: 10.1073/pnas.0408970102. [DOI] [PMC free article] [PubMed] [Google Scholar]
- 34.Zheng W, Andrec M, Gallicchio E, Levy RM. Simulating Replica Exchange Simulations of Protein Folding with a Kinetic Network Model. Proc Natl Acad Sci U S A. 2007;104:15340–15345. doi: 10.1073/pnas.0704418104. [DOI] [PMC free article] [PubMed] [Google Scholar]
- 35.Zheng W, Andrec M, Gallicchio E, Levy RM. Recovering Kinetics from a Simplified Protein Folding Model Using Replica Exchange Simulations: A Kinetic Network and Effective Stochastic Dynamics. J Phys Chem B. 2009;113:11702–11709. doi: 10.1021/jp900445t. [DOI] [PMC free article] [PubMed] [Google Scholar]
- 36.Zheng W, Gallicchio E, Deng N, Andrec M, Levy RM. Kinetic Network Study of the Diversity and Temperature Dependence of Trp-Cage Folding Pathways: Combining Transition Path Theory with Stochastic Simulations. J Phys Chem B. 2011;115:1512–1523. doi: 10.1021/jp1089596. [DOI] [PMC free article] [PubMed] [Google Scholar]
- 37.Ozkan SB, Dill KA, Bahar I. Fast-Folding Protein Kinetics, Hidden Intermediates, and the Sequential Stabilization model. Protein Sci. 2002;11:1958–1970. doi: 10.1110/ps.0207102. [DOI] [PMC free article] [PubMed] [Google Scholar]
- 38.Singhal N, Snow CD, Pande VS. Using Path Sampling to Build Better Markovian State Models: Predicting the Folding Rate and Mechanism of a Tryptophan Zipper Beta Hairpin. J Chem Phys. 2004;121:415–425. doi: 10.1063/1.1738647. [DOI] [PubMed] [Google Scholar]
- 39.Swope W, Pitera JW, Suits F. Describing Protein Folding Kinetics by Molecular Dynamics Simulations. 1. Theory. J Chem Phys. 2004;108:6571–6581. [Google Scholar]
- 40.Sriraman S, Kevrekidis IG, Hummer G. Coarse Master Equation for Bayesian Analysis of Replica Molecular Dynamics Simulations. J Phys Chem B. 2005;109:6479–6484. doi: 10.1021/jp046448u. [DOI] [PubMed] [Google Scholar]
- 41.Noe F, Krachtus D, Smith JC, Fischer S. Transition Networks for the Comprehensive Characterization of Complex Conformational Change in Proteins. J Chem Theory Comput. 2006;2:840–857. doi: 10.1021/ct050162r. [DOI] [PubMed] [Google Scholar]
- 42.Sugita Y, Okamoto Y. Replica-Exchange Molecular Dynamics Method for Protein Folding. Chem Phys Lett. 1999;314:141–151. [Google Scholar]
- 43.Berezhkovskii A, Hummer G, Szabo A. Reactive Flux and Folding Pathways in Network Models of Coarse-Grained Protein Dynamics. J Chem Phys. 2009;130:205102–205106. doi: 10.1063/1.3139063. [DOI] [PMC free article] [PubMed] [Google Scholar]
- 44.Gillespie DT. Exact Stochastic Simulation of Coupled Chemical Reactions. J Phys Chem. 1977;81:2340–2361. [Google Scholar]
- 45.Levy RM, Karplus M, McCammon JA. Increase of Carbon-13 NMR relaxation times in Proteins due to Picosecond Motional averaging. J Am Chem Soc. 1981;103:994–996. [Google Scholar]
- 46.Levy RM, Karplus M, Wolynes PG. NMR Relaxation Parameters in Molecules with Internal Motion: Exact Langevin Trajectory Results Compared with Simplified Relaxation Models. J Am Chem Soc. 1981;103:5998–6011. [Google Scholar]
- 47.Lipari G, Szabo A, Levy RM. Protein Dynamics and NMR Relaxation: Comparison of Simulations with Experiment. Nature. 1982;300:197–198. [Google Scholar]
- 48.Levy RM, Sheridan RP. Combined Effect of Restricted Rotational Diffusion Plus Jumps on Nuclear Magnetic Resonance and Fluorescence Probes of Aromatic Ring Motions in Proteins. Biophys J. 1983;41:217–221. doi: 10.1016/S0006-3495(83)84422-1. [DOI] [PMC free article] [PubMed] [Google Scholar]
- 49.Wong V, Case DA. Evaluating Rotational Diffusion from Protein MD Simulations. J Phys Chem B. 2008;112:6013–6024. doi: 10.1021/jp0761564. [DOI] [PubMed] [Google Scholar]
- 50.Showalter SA, Bruschweiler R. Validation of Molecular Dynamics Simulations of Biomolecules Using NMR Spin Relaxation as Benchmarks: Application to the AMBER99SB Force Field. J Chem Theory Comput. 2007;3:961–975. doi: 10.1021/ct7000045. [DOI] [PubMed] [Google Scholar]
- 51.Peter C, Daura X, van Gunsteren WF. Calculation of NMR-Relaxation Parameters for Flexible Molecules from Molecular Dynamics Simulations. J Biomol NMR. 2001;20:297–310. doi: 10.1023/a:1011241030461. [DOI] [PubMed] [Google Scholar]
- 52.Fawzi NL, Phillips AH, Ruscio JZ, Doucleff M, Wemmer DE, Head-Gordon T. Structure and Dynamics of the Aβ21–30 Peptide from the Interplay of NMR Experiments and Molecular Simulations. J Am Chem Soc. 2008;130:6145–6158. doi: 10.1021/ja710366c. [DOI] [PMC free article] [PubMed] [Google Scholar]
- 53.Xia J, Case DA. Sucrose in Aqueous Solution Revisited. Part 1:. Molecular Dynamics Simulations and Direct and Indirect Dipolar Coupling Analysis. Biopolymers. 2012;97:276–288. doi: 10.1002/bip.22017. [DOI] [PMC free article] [PubMed] [Google Scholar]
- 54.Xia J, Case DA. Sucosae in Aqueous Solution Revisted. Part 2: Adaptively Biased Molecular Dynamics Simulations and Computational Analysis of NMR Relaxation. Biopolymers. 2012;97:289–302. doi: 10.1002/bip.22004. [DOI] [PMC free article] [PubMed] [Google Scholar]
- 55.Chen JH, Brooks CL, Wright PE. Model-Free Analysis of Protein Dynamics: Assessment of Accuracy and Model Selection Protocols Based on Molecular Dynamics Simulation. J Biomol NMR. 2004;29:243–257. doi: 10.1023/B:JNMR.0000032504.70912.58. [DOI] [PubMed] [Google Scholar]
- 56.Schneider TR, Brunger AT, Nilges M. Influence of Internal Dynamics on Accuracy of Protein NMR Structures: Derivation of Realistic Model Distance Data from a Long Molecular Dynamics Trajectory. J Mol Biol. 1999;285:727–740. doi: 10.1006/jmbi.1998.2323. [DOI] [PubMed] [Google Scholar]
- 57.Noe F, Fischer S. Transition Networks for Modeling the Kinetics of Conformational Change in Macromolecules. Curr Opin Struct Biol. 2008;18:154–162. doi: 10.1016/j.sbi.2008.01.008. [DOI] [PubMed] [Google Scholar]
- 58.Pande VS, Beauchamp K, Bowman GR. Everything You Wanted to Know about Markov State Models but were Afraid to Ask. Methods. 2010;52:99–105. doi: 10.1016/j.ymeth.2010.06.002. [DOI] [PMC free article] [PubMed] [Google Scholar]
- 59.Prinz JH, Wu H, Sarich M, Keller B, Senne M, Held M, Chodera JD, Schuette C, Noe F. Markov Models of Molecular Kinetics: Generation and Validation. J Chem Phys. 2011;134:174105–174127. doi: 10.1063/1.3565032. [DOI] [PubMed] [Google Scholar]
- 60.Yang S, Banavali NK, Roux B. Mapping the Conformational Transition in Src Activation by Cumulating the Information from Multipe Molecular Dynamics Trajectories. Proc Natl Acad Sci U S A. 2009;106:3776–3781. doi: 10.1073/pnas.0808261106. [DOI] [PMC free article] [PubMed] [Google Scholar]
- 61.Da LT, Wang D, Huang X. Dynamics of Pyrophosphate Ion Release and Its Coupled Trigger Loop Motion from Closed to Open State in RNA Polymerase II. J Am Chem Soc. 2012;134:2399–2406. doi: 10.1021/ja210656k. [DOI] [PMC free article] [PubMed] [Google Scholar]
- 62.Lane TJ, Bowman GR, Beauchamp K, Voelz VA, Pande VS. Markov State Model Reveals Folding and Functional Dynamics in Ultra-Long MD Trajectories. J Am Chem Soc. 2011;133:18413–18419. doi: 10.1021/ja207470h. [DOI] [PMC free article] [PubMed] [Google Scholar]
- 63.Buchete NV, Hummer G. Coarse Master Equations for Peptide Folding Dynamics. J Phys Chem B. 2008;112:6057–6069. doi: 10.1021/jp0761665. [DOI] [PubMed] [Google Scholar]
- 64.Buch I, Giorgino T, De Fabritiis G. Complete Reconstruction of an Enzyme Inhibitor Binding Process by Molecular Dynamics Simulations. Proc Natl Acad Sci U S A. 2011;108:10184– 10189. doi: 10.1073/pnas.1103547108. [DOI] [PMC free article] [PubMed] [Google Scholar]
- 65.Fischer S, Karplus M. Conjugate Peak Refinement – an Algorithm for Finding Reaction Paths and Accurate Transition-States in Systems with Many Degrees Freedom. Chem Phys Lett. 1992;194:252–261. [Google Scholar]
- 66.Noe F, Schuette C, Vanden-Eijnden E, Reich L, Weikl TR. Constructing the equilibrium ensemble of folding pathways from short off-equilibrium simulations. Proc Natl Acad Sci U S A. 2009;106:19011–19016. doi: 10.1073/pnas.0905466106. [DOI] [PMC free article] [PubMed] [Google Scholar]
- 67.Chodera JD, Swope WC, Pitera JW, Dill KA. Long-Time Protein Folding Dynamics from Short-Time Molecular Dynamics Simulations. Multiscale Model Simul. 2006;5:1214–1226. [Google Scholar]
- 68.Bacallado S, Chodera JD, Pande V. Bayesian Comparison of Markov Models of Molecular Dynamics with Detailed Balance Constraint. J Chem Phys. 2009;131:045106–045115. doi: 10.1063/1.3192309. [DOI] [PMC free article] [PubMed] [Google Scholar]
- 69.Noe F. Probability Distributions of Molecular Observables Computed from Markov Models. J Chem Phys. 2008;128:244103–244115. doi: 10.1063/1.2916718. [DOI] [PubMed] [Google Scholar]
- 70.Singhal N, Pande VS. Error Analysis and Efficient Sampling in Markovian State Models for Molecular Dynamics. J Chem Phys. 2005;123:204909–204921. doi: 10.1063/1.2116947. [DOI] [PubMed] [Google Scholar]
- 71.Banks JL, Beard HS, Cao Y, Cho AE, Damm W, Farid R, Felts AK, Halgren TA, Mainz DT, Maple JR, et al. Integrated Modeling Program, Applied Chemical Theory (IMPACT) J Comput Chem. 2005;26:1752–1780. doi: 10.1002/jcc.20292. [DOI] [PMC free article] [PubMed] [Google Scholar]
- 72.Jorgensen WL, Maxwell DS, TiradoRives J. Development and Testing of the OPLS All-Atom Force Field on Conformational Energetics and Properties of Organic Liquids. J Am Chem Soc. 1996;118:11225–11236. [Google Scholar]
- 73.Gallicchio E, Levy RM. AGBNP: An Analytic Implicit Solvent Model Suitable for Molecular Dynamics Simulations and High-Resolution Modeling. J Comput Chem. 2004;25:479–499. doi: 10.1002/jcc.10400. [DOI] [PubMed] [Google Scholar]
- 74.Gallicchio E, Paris K, Levy RM. The AGBNP2 Implicit Solvation Model. J Chem Theory Comput. 2009;5:2544–2564. doi: 10.1021/ct900234u. [DOI] [PMC free article] [PubMed] [Google Scholar]
- 75.Gallicchio E, Andrec M, Felts AK, Levy RM. Temperature Weighted Histogram Analysis Method, Replica Exchange, and Transition Paths. J Phys Chem B. 2005;109:6722–6731. doi: 10.1021/jp045294f. [DOI] [PubMed] [Google Scholar]
- 76.Pearlman DA, Kollman PA. Evaluating the Assumptions Underlying Force-Field Development and Application Using Free-Energy Conformational Maps for Nucleosides. J Am Chem Soc. 1991;113:7167–7177. [Google Scholar]
- 77.Favro LD. Theory of the Rotational Brownian Motion of a Free Rigid Body. Phys Rev. 1960;119:53–62. [Google Scholar]
- 78.Woessner DE. Nuclear Spin Relaxation in Ellipsoids Undergoing Rotational Brownian Motion. J Chem Phys. 1962;37:647–654. [Google Scholar]
- 79.Woessner DE, Snowden BS, Meyer GH. Nuclear Spin-Lattice Relaxation in Axially Symmetric Ellipsoids with Internal Motion. J Chem Phys. 1969;50:719–721. [Google Scholar]
- 80.Wallach D. Effect of Internal Rotation on Angular Correlation Functions. J Chem Phys. 1967;47:5258–5268. [Google Scholar]
- 81.Wittebort RJ, Szabo A. Theory of NMR Relaxation in Macromolecules: Restricted Diffusion and Jump models for Multiple Internal Rotations in Amino Acide Side Chains. J Chem Phys. 1978;69:1722–1736. [Google Scholar]
- 82.Wong V, Case DA, Szabo A. Influence of the Coupling of Interdomain and Overall Motions on NMR Relaxation. Proc Natl Acad Sci U S A. 2009;106:11016–11021. doi: 10.1073/pnas.0809994106. [DOI] [PMC free article] [PubMed] [Google Scholar]
- 83.Ryabov Y, Clore GM, Schwieters CD. Coupling between Internal Dynamics and Rotational Diffusion in the Presence of Exchange between Discrete Molecular Conformations. J Chem Phys. 2012;136:034108–034112. doi: 10.1063/1.3675602. [DOI] [PMC free article] [PubMed] [Google Scholar]
- 84.Ryabov YE, Fushman D. A Model of Interdomain Mobility in a Multidomain Protein. J Am Chem Soc. 2007;129:3315–3327. doi: 10.1021/ja067667r. [DOI] [PMC free article] [PubMed] [Google Scholar]
- 85.Prompers JJ, Bruschweiler R. General Framework for Studying the Dynamics of Folded and Nonfolded Proteins by NMR Relaxation Spectroscopy and MD Simulation. J Am Chem Soc. 2002;124:4522–4534. doi: 10.1021/ja012750u. [DOI] [PubMed] [Google Scholar]
- 86.Perryman AL, Lin JH, McCammon JA. HIV-1 Protease Molecular Dynamics of a Wide-Type and of the V82F/I84V Mutant: Possible Contributions to Drug Resistance and a Potential New Target Site for Drugs. Protein Sci. 2004;13:1108–1123. doi: 10.1110/ps.03468904. [DOI] [PMC free article] [PubMed] [Google Scholar]
- 87.Galiano L, Ding F, Veloro AM, Blackburn ME, Simmerling C, Fanucci GE. Drug Pressure Selected Mutations in HIV-1 Protease Alter Flap Conformations. J Am Chem Soc. 2009;131:430–431. doi: 10.1021/ja807531v. [DOI] [PMC free article] [PubMed] [Google Scholar]
- 88.Kear JL, Blackburn ME, Veloro AM, Dunn BM, Fanucci GE. Subtype Polymorphisms among HIV-1 Protease Variants Confer Altered Flap Conformations and Flexibility. J Am Chem Soc. 2009;131:14650–14651. doi: 10.1021/ja907088a. [DOI] [PMC free article] [PubMed] [Google Scholar]
- 89.Blackburn ME, Veloro AM, Fanucci GE. Monitoring Inhibitor-Induced Conformational Population Shifts in HIV-1 Protease by Pulsed EPR Spectroscopy. Biochemistry. 2009;48:8765–8767. doi: 10.1021/bi901201q. [DOI] [PubMed] [Google Scholar]
- 90.Cai Y, Yilmaz NK, Myint W, Ishima R, Schiffer CA. Differential Flap Dynamics in Wild-Type and a Drug Resistant Variant of HIV-1 Protease Revealed by Molecular Dynamics and NMR Relaxation. J Chem Theory Comput. 2012;8:3452–3462. doi: 10.1021/ct300076y. [DOI] [PMC free article] [PubMed] [Google Scholar]
- 91.Marinelli F, Pietrucci F, Laio A, Piana S. A Kinetic Model of Trp-Cage Folding from Multiple Biased Molecular Dynamics Simulations. PLOS Comput Biol. 2009;5:e1000452. doi: 10.1371/journal.pcbi.1000452. [DOI] [PMC free article] [PubMed] [Google Scholar]
Associated Data
This section collects any data citations, data availability statements, or supplementary materials included in this article.