

Abstract
Our objective in this study was to estimate the probability that a Chlamydia trachomatis (CT) infection will cause an episode of clinical pelvic inflammatory disease (PID) and the reduction in such episodes among women with CT that could be achieved by annual screening. We reappraised evidence from randomized controlled trials of screening and controlled observational studies that followed untreated CT-infected and -uninfected women to measure the development of PID. Data from these studies were synthesized using a continuous-time Markov model which takes into account the competing risk of spontaneous clearance of CT. Using a 2-step piecewise homogenous Markov model that accounts for the distinction between prevalent and incident infections, we investigated the possibility that the rate of PID due to CT is greater during the period immediately following infection. The available data were compatible with both the homogenous and piecewise homogenous models. Given a homogenous model, the probability that a CT episode will cause clinical PID was 0.16 (95% credible interval (CrI): 0.06, 0.25), and annual screening would prevent 61% (95% CrI: 55, 67) of CT-related PID in women who became infected with CT. Assuming a piecewise homogenous model with a higher rate during the first 60 days, corresponding results were 0.16 (95% CrI: 0.07, 0.26) and 55% (95% CrI: 32, 72), respectively.
Keywords: Bayesian analysis, causal effect, Chlamydia trachomatis, Markov model, mass screening, meta-analysis, pelvic inflammatory disease, prospective studies
Pelvic inflammatory disease (PID) is a leading cause of both tubal factor infertility and ectopic pregnancy (1, 2). PID is a clinical diagnosis typically indicated by lower abdominal pain, in association with local tenderness upon bimanual vaginal examination (3). Infection with Chlamydia trachomatis (CT) is an important risk factor for the development of PID, and knowledge of the role of CT is critical for assessing the efficacy and cost-effectiveness of CT screening (4, 5). PID is also caused by other infections of the female reproductive tract, including other sexually transmitted infections (STIs) and infections introduced during surgery, abortion, or parturition; these other risk factors may be unaffected or indirectly affected by CT screening and cause a background level of nonchlamydial PID (3).
A range of observational studies have followed untreated CT-infected women prospectively and have observed the numbers of women developing PID (6–10); in some studies the infection, presumably symptomatic, has been diagnosed in a clinic (6–8, 10), and in 1 study it was identified by screening asymptomatic cases (9). There have also been controlled trials randomizing large numbers of women to screening and treatment or to no screening (11–13). However, there is a remarkable lack of consensus on the risk of PID attributable to an episode of CT, in spite of a major authoritative review (1). Still more surprising is the lack of consensus on what studies should be used to estimate this risk.
In the United Kingdom, one recent cost-effectiveness analysis of screening (5) estimated the risk of PID following CT from a Swedish data linkage study (14), and another based an estimate on retrospective data (15). Neither used the evidence from randomized controlled trials, although this would be regarded as the most reliable evidence of causal effects.
Programs designed to screen for and treat CT have 2 purposes: to reduce transmission to partners and thereby lower prevalence and the number of future infections, and to prevent PID and further sequelae in the women found to be infected (4, 16). Untreated CT infection usually clears within 1.5 years (17–20), so women who are diagnosed through screening have already “survived” a period of infection without developing PID. Randomized controlled trials of screening and treatment versus no screening can provide direct information on the proportion of CT-caused PID that can be prevented in a population with prevalent infection (13, 21, 22). However, it is the proportion of preventable PID in women with incident infection that is required to evaluate programs designed to lower infection rates.
Previous reviews (1, 23–25) of prospective data on progression to PID have been qualitative. Here we synthesize data from these studies to provide quantitative estimates of the difference in the rates at which PID develops in women with and without CT. From these estimates, we derive first the probability that an episode of CT will cause an episode of PID and then the proportion of episodes of PID caused by CT, in women with CT, that could be prevented by randomly timed annual screening—that is, screening not associated with recent risk of infection, referred to herein as “annual screening.”
In this article, we first reappraise the results from prospective studies, including nonrandomized and uncontrolled studies. We then present a 3-state continuous-time Markov model, which allows for not only different rates of development of PID in CT-infected (CT+) and CT-uninfected (CT−) women but also spontaneous clearance of CT, a competing risk. It also allows for CT infection in women who are initially uninfected (CT−) and for reinfection with CT in women who are initially CT+ but who spontaneously clear infection or are tested and treated. We then reanalyze each of the controlled studies, both randomized and not, under the assumptions of the model, and finally synthesize the results altogether, to obtain estimates of the proportion of incident CT that results in PID and the proportion of CT-caused PID in women who become CT-infected that can be prevented by annual screening.
MATERIALS AND METHODS
Information sources and their interpretation
We identified 8 studies (Table 1) that followed women with CT to assess the proportion who developed PID in the absence of, or prior to, treatment (the search strategy is presented in Web Appendix 1, available at http://aje.oxfordjournals.org/). Some studies were set in sexually transmitted disease clinics, and others were based on infected women recruited by population screening. Five were observational, one of which, a clinic-based study, included a control group. The remainder were randomized controlled trials, all based on screened populations. In the Prevention of Pelvic Infection (POPI) Trial (11), participants in one arm were screened and treated immediately, while in the other arm screening and treatment were deferred until the end of the study.
Table 1.
Information From Prospective Studies That Followed Women With Chlamydia to Measure the Development of Pelvic Inflammatory Disease
| First Author, Year (Reference No.) | Study Design | Study Population | Arm | Data (Observation o), ro/no | Crude Proportion, po = ro/no |
Follow-up Period, to | Crude Annual Rate of PID, (−log(1 − po))/to |
||
|---|---|---|---|---|---|---|---|---|---|
| Proportion | 95% CI | Rate | 95% CI | ||||||
| Hook, 1994 (7) | Uncontrolled | Clinic | CT+ | 3/93 | 0.032 | 0.012, 0.091 | 2 weeks | 0.82 | 0.30, 2.40 |
| Geisler, 2008 (6) | Uncontrolled | Clinic | CT+ | 2/115 | 0.017 | 0.005, 0.061 | 2 weeks | 0.44 | 0.14, 1.59 |
| Paavonen, 1980 (8) | Uncontrolled | Clinic | CT+ | 3/15 | 0.200 | 0.078, 0.481 | 1 month | 2.79 | 1.01, 8.21 |
| Rahm, 1986 (9) | Uncontrolled | Screened | CT+ | 4/102 | 0.048 | 0.016, 0.097 | 3 months | 0.18 | 0.07, 0.46 |
| Rees, 1980 (10) | Controlled | Clinic | CT+ | 8/67 | 0.119 | 0.063, 0.222 | 7–90 days | 1.02 | 0.52, 2.01 |
| CT− | 3/62 | 0.048 | 0.018, 0.135 | 0.40 | 0.15, 1.16 | ||||
| Oakeshott, 2010 (11) (POPI Trial) | RCT | Screened | Untreated CT+ | 7/74 | 0.093 | 0.047, 0.183 | 1 year | 0.099 | 0.049, 0.205 |
| Delayed-screen CT− | 16/1,112 | 0.014 | 0.009, 0.023 | 0.014 | 0.009, 0.024 | ||||
| Treated CT+ | 1/63 | 0.016 | 0.004, 0.087 | 0.016 | 0.004, 0.089 | ||||
| Screened CT− | 14/1,128 | 0.011 | 0.007, 0.019 | 0.012 | 0.007, 0.021 | ||||
| Scholes, 1996 (13) | RCT | Screened | Unscreened | 33/1,598 | 0.021 | 0.015, 0.029 | 1 year | 0.021 | 0.015, 0.029 |
| Screened | 7/645 | 0.011 | 0.005, 0.022 | 0.011 | 0.005, 0.022 | ||||
| Chlamydia prevalence | 44/645 | 0.068 | 0.051, 0.091 | ||||||
| Østergaard, 2000 (12) | RCT | Screened | Unscreened | 20/487 | 0.041 | 0.027, 0.063 | 1 year | 0.042 | 0.027, 0.065 |
| Screened | 9/443 | 0.020 | 0.011, 0.038 | 0.021 | 0.011, 0.039 | ||||
| Chlamydia prevalence | 43/867 | 0.050 | 0.037, 0.066 | ||||||
Abbreviations: CI, confidence interval; CT, Chlamydia trachomatis; CT+, CT-infected; CT–, CT-uninfected; PID, pelvic inflammatory disease;POPI, Prevention of Pelvic Infection; RCT, randomized controlled trial.
Table 1 shows the proportion of women with PID in each arm at the end of each study. Most investigators have focused attention on these proportions and, in controlled studies, on relative risks. However, it is necessary to account for the mean follow-up time to for each observation o. The last column of Table 1 shows crude study-specific estimates of the rates of progression to PID, based on a constant hazard within each study and arm.
The crude estimates of the progression rate in CT+ women vary by factors of 30-fold: Studies based on STI clinics have shorter follow-up periods and higher apparent progression rates, while those based on screened populations tend to have longer follow-up periods and lower progression rates. There are 3 possible explanations for this. Firstly, CT infections spontaneously resolve without treatment, so even if progression rates were constant over time, with CT clearance as a “competing risk,” the numbers of women acquiring PID must slowly decrease over time toward a background level seen in a representative control group. The effect of this will tend to be greater in studies with longer follow-up periods. However, the mean duration of untreated CT has been estimated to be over a year (17–20), so this would explain only a small part of the apparent differences. A second possible explanation is that women visiting STI clinics are more likely to have symptoms than those identified through screening, and the higher CT load associated with symptoms (26–28) may confer a greater risk of developing PID. A third possible explanation is that the risk of developing PID may be greater during the period immediately after CT infection (1, 29), even if the infection is asymptomatic.
There is a fundamental difference between STI clinic studies and screening studies. Women are most likely to visit STI clinics because of the onset of symptoms or because of concern following recent possible exposure to infection. They are therefore more likely to be recently infected. This is supported by evidence that symptoms mostly occur soon after infection (6, 20). Screening studies, by contrast, recruit participants with asymptomatic, prevalent CT infection who have already “survived” an unknown period of time without developing PID. Further, if the risk of PID is higher immediately following infection, the screening studies must underestimate the overall progression rate. For example, if asymptomatic infection lasted exactly 12 months and if 20% of incident cases developed PID (at which point they were treated for CT), always exactly 3 months after infection, the annual progression rate that would be observed in patients recruited from a prevalent population would be only 5.9% (i.e., 3/(0.8 × 12 + 0.2 × 3) × 0.2), a gross underestimate. In such a scenario, only screening and treatment occurring during the first 3 months of a 12-month infection would prevent PID. As a result, a single screen every year would prevent only 29.4% (5.9%/20% = 29.4%) of the PID cases caused by CT.
A model for progression to PID in the controlled prospective studies
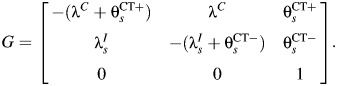
In our model for prospective studies (Figure 1), women who are CT+ and CT− at the start of the study begin in states 1 and 2, respectively. Women in state 1 may clear infection and progress to the CT− state, state 2, at rate λC, or they may develop PID (state 3) at a study-specific rate,  for study s. Women in state 2 may become infected with CT, which occurs at rate
  , or may develop PID at rate
  if they acquire or already have a non-CT infection which carries a PID risk. We assume that the prevalence and incidence rates for other STIs are the same in each arm. The difference δ between
  and
and  represents the rate of acquiring PID among women with a current CT infection that can be causally attributed to CT. The Figure 1 model is represented by the Markov transition rate matrix (G), shown in equation 1:
 |
(1) |
Figure 1.
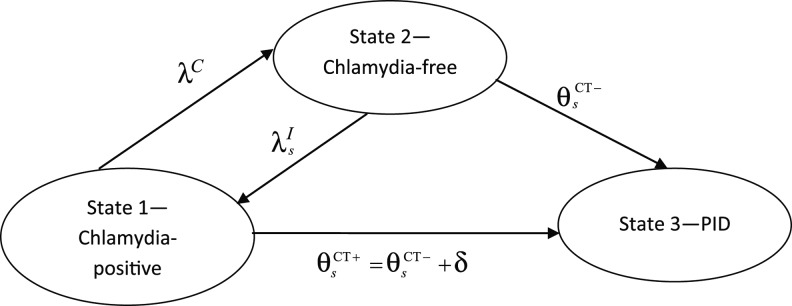
Multistate transition model for progression of Chlamydia trachomatis (CT) infection in prospective studies. λC is the clearance rate of CT,  is the CT infection rate,
  is the rate at which women with CT develop pelvic inflammatory disease (PID),
  is the rate at which women without CT develop PID, and the difference δ between
  and
and  represents the rate of acquiring PID in women with a current CT infection that can be causally attributed to CT.
Only comparative studies can contribute information on δ, but we cannot derive estimates of δ from comparative studies without information on λC and . We assume that the CT clearance rate for asymptomatic infection, λC, is constant across studies, at 0.74 (95% credible interval: 0.61, 0.89) per year, based on a synthesis of evidence from previous studies on CT duration (20). Similar estimates have been reported elsewhere (17). For CT incidence , we assume an infection rate of 5% per year in women who are CT− at the outset and a reinfection rate of 15% per year in women who are CT+ and tested and treated. Given an average duration of CT infection of 1–1.5 years, a 5% incidence reflects a CT prevalence of 5%–7.5%, which accords with the baseline CT prevalence in the 3 trials. Reinfection rates are higher by approximately a factor of 3 (30). We assume that all women in the Scholes et al. (13) and Østergaard et al. (12) (95% CT−) studies are at risk of infection, whereas all women in the Rees (10) (50% CT+) and POPI (11) (100% CT+) studies are assumed to be at risk of reinfection. Detailed sensitivity analyses (Web Appendix 2) show that conclusions are relatively insensitive to the values assumed.
Some of the screening studies recorded the proportion of women who were tested and treated for CT during follow-up, thus shortening their time at risk of CT-PID. This was 43% for the POPI Trial (11), 32% for Østergaard et al. (12), and 8.1% for Rees (10). The Scholes et al. paper (13) implies that some women were tested but does not report how many; we have assumed a proportion of 32%, following Østergaard et al. (12), but we explored the impact of a lower rate in sensitivity analyses (Web Appendix 2).
We consider 2 models. In the first, the causal rate of PID due to CT, δ, is constant throughout the duration of infection. In the second, the causal rate during the period immediately following CT infection (δ1) is different from the causal rate during the remainder of the infection (δ2). We fit models with the rate δ1 lasting for periods of 30, 60, and 90 days postinfection.
Estimation
Details of the estimation methods are given in Web Appendix 3. In brief, each study arm provided data with a binomial likelihood, which estimates a probability parameter, such as  , representing the study-specific transition probability that a person in state i occupies state j, t years later. These probabilities are entries in the transition probability matrix P(t). If the transition rates are constant throughout the period t, then the transition probabilities, on which we have data (Table 1), are functionally related to the transition rates in equation 1 by Kolmogorov's (31) forward equations:
| (2) |
Estimation is carried out using a Bayesian approach, where the posterior distribution is sampled through Markov chain Monte Carlo simulation. The rate parameters in equation 1 are given vague priors, the values of which are updated by the data. Numerical solutions to the forward equations are found in each Markov chain Monte Carlo cycle, using the WinBUGS (32) add-on WBDiff (33), which uses the Runge-Kutta method (34, 35).
From the POPI Trial (11), only the CT+ groups were included in this analysis, because the causal rate estimate is thereby based on a randomized comparison. The proportion of women with CT in the early treated arm are considered, in effect, to be CT− at the start of the observation period. Those in the deferred treatment group are, of course, CT+. However, in the Scholes et al. (13) and Østergaard et al. (12) trials, while the women in the screened arm are again taken to be CT− at the start of follow-up, those in the unscreened arm are a mixture of (untreated) CT+ and CT−. The study-specific CT prevalences in the screened arms are estimators of these mixing proportions.
Further details on how the observed data inform the rate parameters in the matrix G (equation 1) are given in Web Appendix 3. The joint posterior distribution of the rate parameters is used to obtain posterior distributions for the 2 parameters of interest: the proportion of CT infections that result in PID and the proportion of CT-caused PID in women who become infected with CT that is preventable by annual screening.
Probability that incident CT will cause an episode of PID
While the comparative studies provide an estimate of the difference δ in progression rates between CT+ and CT− women, the target parameter of interest is the proportion of incident CT infections that result in PID. We assume that a proportion, φ, of incident CT cases are symptomatic and treated, clearing at rate λT, and acquiring PID at the same rate as asymptomatic women. The remaining 1 − φ infections are asymptomatic. To simplify the equations and maintain generality, we ignore non-CT-related PID as a competing risk at this stage. Even if the rate of non-CT PID were twice that observed in the screened arm of POPI, this would only change the value of our target parameter by about 2.5% (i.e., a multiplicative factor of 1.025). The probability that either type of infection will cause PID is the ratio of the rate of leaving state 1 for state 3 to the rate of leaving state 1, a standard result from competing-risks analysis (36). The proportion of incident cases of CT leading to an episode of PID in a homogenous model is therefore
| (3) |
Calculation of κ requires estimates of φ and λT. For the former, we use the estimate from Geisler et al. (6), 0.24 (95% credible interval: 0.17, 0.32). For the latter, we assume that treated infection lasts 4–8 weeks.
In the 2-stage piecewise homogenous model, with the initial rate lasting for B days, the probability of developing PID in the first B days and the probability of developing PID subsequently, conditional on having neither developed PID nor cleared infection in the first B days, are summed:
 |
(4) |
Estimation of the proportion of PID episodes prevented by screening
Even with 100% coverage, an annual screening program for CT would not prevent all cases of PID. In this paper, we estimate the proportion of episodes of CT-related PID that could be prevented in women who become infected with CT. The expressions for this quantity are derived and presented in Web Appendix 3. This applies to the benefits to CT+ women who are screened and treated and is not designed to measure the full effect of screening, since it does not take into account reduction in PID due to reduced CT incidence.
Plan of analysis
The data analysis is carried out in several steps in order to show the influence of the different types of data on the estimates of interest. Firstly, we examine each of the comparative studies separately. We then synthesize information from all 3 randomized controlled trials and then from the 4 comparative studies. Studies are combined on the basis that the progression rates in CT− women vary between studies in an arbitrary way, but the difference δ between the progression rates from CT− and CT+ has the same fixed effect across studies.
Estimation and model critique
Posterior mean values and 95% credible intervals were obtained from the Bayesian Markov chain Monte Carlo package WinBUGS, version 1.4.3 (32). Unless otherwise stated, vague priors were employed throughout, so that results are dominated by the data. Note that the prior structure for the rates is functionally equivalent to a model with a rate for PID caused by CT and a competing risk of non-CT-related PID. To assess goodness of fit, we used the posterior mean residual deviance, whose expected value is approximately equal to the number of data points under the assumption that the model is true (35, 37, 38). Further details are available in Web Appendix 4, and the WinBUGS code is provided in Web Appendix 5.
RESULTS
Table 2 shows the study-specific estimates from the homogenous Markov model of the difference δ, which we interpret as the causal rate of PID in CT+ women, and the proportion of incident CT infections that result in PID. While the POPI Trial data delivered the lowest estimates of both parameters, the credible intervals for the estimates from the other studies were considerably wider and approximately compatible with the POPI results. The estimates from the Scholes et al. study (13) were relatively insensitive to changes in assumptions on the proportion tested during the follow-up period (Web Appendix 2).
Table 2.
Posterior Mean Values for the Causal Rate of Pelvic Inflammatory Disease (PID) in Chlamydia trachomatis (CT)-infected Women and the Probability That an Incident Case of CT Will Cause PIDa
| First Author, Year (Reference No.) | Causal Rate of PID in CT-Infected Women, δ |
Probability That CT Will Cause PID |
||
|---|---|---|---|---|
| Posterior Mean | 95% CrI | Posterior Mean | 95% CrI | |
| Oakeshott, 2010 (11) (POPI Trial) | 0.15 | 0.02, 0.31 | 0.12 | 0.02, 0.24 |
| Scholes, 1996 (13) | 0.26 | 0.03, 0.55 | 0.20 | 0.03, 0.34 |
| Østergaard, 2000 (12) | 1.03 | 0.13, 2.49 | 0.43 | 0.11, 0.65 |
| Rees, 1980 (10) | 0.76 | 0.07, 1.78 | 0.37 | 0.06, 0.59 |
Abbreviations: CrI, credible interval; CT, Chlamydia trachomatis; PID, pelvic inflammatory disease; POPI, Prevention of Pelvic Infection.
a Estimated using the Markov model shown in Figure 1.
Table 3 presents the results of combining the information from the different studies under each of the homogenous and piecewise homogenous models. In all of the models, the mean residual deviance was close to the number of data points, indicating a good fit. In addition, it was apparent that the estimates under the 1-rate model were broadly similar for data 1) from the POPI Trial only, 2) pooled from all trials, and 3) including the observational study as well. The causal rate of PID ranged from 0.15 cases per year to 0.19 cases per year, and the probability of CT causing PID ranged from 0.12 to 0.16. The proportion of CT-caused PID that was preventable by annual screening remained at 61%–63%. The degree of overlap between these estimates and the shape of the posterior distributions can be seen in Figure 2.
Table 3.
Estimates of the Proportion of Incident Chlamydia trachomatis (CT) That Results in Pelvic Inflammatory Disease (PID) and the Proportion of CT-caused PID Cases in CT-infected Women That Can Be Prevented by Annual Screening
| Method and Included Studies | Mean Residual Deviance | No. of Data Points | Causal Rate of PID |
Probability That CT Will Cause Clinical PID |
Proportion of Cases Prevented by Screening |
|||
|---|---|---|---|---|---|---|---|---|
| Posterior Mean | 95% CrI | Posterior Mean | 95% CrI | Posterior Mean | 95% CrI | |||
| 1-rate models | ||||||||
| POPI data only (11) | 2.0 | 2 | 0.15 | 0.02, 0.31 | 0.12 | 0.02, 0.24 | 0.63 | 0.56, 0.69 |
| Trials only (11–13) | 8.5 | 8 | 0.18 | 0.05, 0.33 | 0.15 | 0.05, 0.25 | 0.62 | 0.55, 0.68 |
| All controlled studies (10–13) | 10.6 | 10 | 0.19 | 0.06, 0.34 | 0.16 | 0.06, 0.25 | 0.61 | 0.55, 0.67 |
| 2-rate models | ||||||||
| All controlled studies— 30 days | 11.0 | 10 | δ1 = 0.28 | 0.02, 0.65 | 0.16 | 0.07, 0.26 | 0.58 | 0.42, 0.68 |
| δ2 = 0.19 | 0.06, 0.35 | |||||||
| All controlled studies— 60 days | 10.9 | 10 | δ1 = 0.29 | 0.02, 0.65 | 0.16 | 0.07, 0.26 | 0.55 | 0.32, 0.72 |
| δ2 = 0.18 | 0.05, 0.35 | |||||||
| All controlled studies— 90 days | 10.9 | 10 | δ1 = 0.28 | 0.02, 0.63 | 0.17 | 0.07, 0.26 | 0.54 | 0.26, 0.76 |
| δ2 = 0.18 | 0.04, 0.36 | |||||||
Abbreviations: CrI, credible interval; CT, Chlamydia trachomatis; PID, pelvic inflammatory disease; POPI, Prevention of Pelvic Infection.
Figure 2.

Marginal posterior distributions of the probability that a Chlamydia trachomatis infection will cause clinical pelvic inflammatory disease (PID), estimated by each model. ACS, all controlled studies; POPI, Prevention of Pelvic Infection; RCT, randomized controlled trial.
The data did not distinguish the 1- and 2-rate models in terms of goodness of fit. The rate in the initial period is estimated to be approximately 50% higher than the rate during the remainder of infection, which is slightly lower than that for the 1-rate model. Both rates are insensitive to the assumed time period for the initial rate between 30 and 90 days (Table 3). Confidence intervals are very wide, however, and a Bayesian P value testing the null hypothesis of equal rates in the 60-day model was only 0.67. The assumption of 2 rates has no real effect on the causal probability of PID. The estimated proportion of PID cases that can be prevented by screening was reduced marginally to 54%–58% for B = 90 days and B = 30 days, respectively, although the 95% credible intervals were wide (Figure 3).
Figure 3.

Marginal posterior distributions of the proportion of pelvic inflammatory disease (PID) episodes caused by Chlamydia trachomatis (CT) in women with CT that each model estimated would be prevented by annual screening. ACS, all controlled studies; POPI, Prevention of Pelvic Infection; RCT, randomized controlled trial.
Sensitivity analyses (Web Appendix 2) showed that although results from some of the individual studies can be sensitive to changes in assumed infection and reinfection rates, none of the results for the pooled analyses using the single-rate model were changed by more than a multiplicative factor of 4%. Results from the 2-rate model were more sensitive, with κ varying between 0.15 and 0.20 when B = 60.
DISCUSSION
Early literature on the progression from CT to PID cited high rates based on uncontrolled studies in high-risk populations (8, 39). Over time, these estimates were increasingly questioned (4, 40, 41). Quantitative estimates of the causal relation between CT and PID have been made using a wide range of study types (42), including linkage studies of treated women (14, 43–47), arguments from retrospective data (15), and the use of CT serology (48–51). More recently, it has been accepted that linkage studies cannot be used to generate reliable estimates (24).
The approach presented here has some novel aspects. The Markov model characterizes the causal rate as the difference in progression rates in CT− and CT+ individuals. It takes account of the “competing” role of CT clearance and of the fact that persons testing CT+ upon screening have already “survived” a period without developing PID. Finally, we have allowed for the impact of CT treatment of women in the untreated arms of trials and likely reinfection rates among those who were treated.
The continuous-time Markov formulation avoids the limitations of traditional relative risk estimates (11–13) of the effect of CT screening. As the follow-up period is extended, the risk ratio estimate will be diluted by CT clearance and PID caused by infections (both CT and non-CT) acquired after the screening and treatment, while in time the risk difference should converge to a stable estimate. Crude risk difference estimates (11, 22) should also be interpreted with caution. The POPI Trial data suggest that screening can prevent 83% of PID occurring during the following year in a prevalent CT+ population (11). Based on the Markov model, these data tell us that the proportion of incident CT-caused PID that can be prevented by annual screening is lower, between 55% and 65%.
The study has also shown for the first time that similar estimates can be derived, though indirectly and with less precision, from trials of screening versus no screening. The Scholes trial in particular has been criticized (21) because testing and treatment rates outside the protocol are unlikely to be the same in the 2 arms. We have used the information available, and sensitivity analyses, to mitigate this. Even with this defect, the trials are clearly superior sources of evidence on the causal effects of CT to the often-cited observational studies, where the difference in CT status at the outset is likely to correlate with risk factors that favor development of PID: higher partner change, greater risk of exposure to other agents that cause PID, and greater prior exposure to CT.
The study relates to “annual screening” at a random point in time. In practice, the benefit of screening for the individual infected woman may be greater if it occurs soon after partner change, as recommended in some countries, or less if partner testing and treatment are not pursued effectively.
The main weakness of this analysis lies in the reliance of almost all prospective studies on clinical PID as the outcome and between-study variation in case definition (42). While clinical PID reflects the cost to care providers of treating PID, it does not always signal the presence of the tubal inflammation (salpingitis) that is responsible for ectopic pregnancy and tubal infertility. The clinical definition may overestimate the rate of laparoscopically defined salpingitis, which may only be present in 45%–75% of cases (50, 52, 53). If the clinical PID that is not salpingitis is never caused by CT, then our estimate of the probability that CT causes PID can be interpreted as the probability that CT causes salpingitis. However, if the proportion of PID that is true salpingitis is the same regardless of whether it is caused by CT, then the probability that CT will cause an episode of salpingitis is likely to be lower than the estimates we derived, equaling about 40%–80% of our estimate.
Prospective studies may also underdiagnose PID, since case-control studies of tubal factor infertility suggest that up to 80% of women with tubal factor infertility report no history of PID (51, 54–56). However, Wølner-Hanssen (57) found that only 11% of women with tubal factor infertility reported never having had clinical symptoms. In prospective studies where participants are questioned about symptoms of PID, few cases are likely to be missed.
The systematic difference in observed PID rates in studies with shorter and longer follow-up periods has led to the suggestion that the progression rate is not constant over time (1). The potential impact of this has been explored in the mathematical modeling literature, using Markov or similar models (29, 58) to predict the proportion of PID prevented. However, with one exception (58), these studies have generated estimates of the proportion prevented from scenario analyses based on estimates of progression rates that were derived from models which do not allow for the competing risk of clearance or the left-truncation inherent in screening studies. The key contribution of this paper is to actually estimate all of these parameters consistently within the Markov model framework. We found that the proportion of CT-related PID that could be prevented by annual screening may be as low as 55%, which might represent only 20%–25% of all PID (59). Estimates based on 2-rate models were relatively insensitive to the duration of a period of heightened PID risk following CT infection but were derived from a single, nonrandomized study. The sparse data available do not distinguish homogenous and piecewise homogenous models statistically, and the confidence intervals for the parameters are wide. However, both 1- and 2-rate models are considered plausible a priori (1).
Supplementary Material
ACKNOWLEDGMENTS
Author affiliations: School of Health and Population Sciences, University of Birmingham, Birmingham, United Kingdom (Malcolm J. Price); School of Social and Community Medicine, University of Bristol, Bristol, United Kingdom (A. E. Ades, Nicky J. Welton, John Macleod, Katy Turner, Paddy J. Horner); Health Protection Agency, London, United Kingdom (Daniela De Angelis, Kate Soldan, Ian Simms); Medical Research Council Biostatistics Unit, Cambridge, United Kingdom (Daniela De Angelis); and Bristol Sexual Health Centre, University Hospital Bristol NHS Foundation Trust, Bristol, United Kingdom (Paddy J. Horner).
This study was funded by Medical Research Council strategic project grant G0801947.
Conflict of interest: none declared.
REFERENCES
- 1.Haggerty CL, Gottlieb SL, Taylor BD, et al. Risk of sequelae after Chlamydia trachomatis genital infection in women. J Infect Dis. 2010;201(2):134–155. doi: 10.1086/652395. [DOI] [PubMed] [Google Scholar]
- 2.Westrom L, Joesoef R, Reynolds G, et al. Pelvic inflammatory disease and fertility—a cohort study of 1,844 women with laparoscopically verified disease and 657 control women with normal laparoscopic results. Sex Transm Dis. 1992;19(4):185–192. [PubMed] [Google Scholar]
- 3.Ross J, McCarthy G. UK National Guideline for the Management of Pelvic Inflammatory Disease 2011. London, United Kingdom: British Association for Sexual Health and HIV; 2011. (http://www.bashh.org/BASHH/Guidelines/BASHH/Guidelines/Guidelines.aspx?hkey=faccb209-a32e-46b4-8663-a895d6cc2051. ). (Accessed May 3, 2013) [Google Scholar]
- 4.Low N. Screening programmes for chlamydial infection: when will we ever learn? BMJ. 2007;334(7596):725–728. doi: 10.1136/bmj.39154.378079.BE. [DOI] [PMC free article] [PubMed] [Google Scholar]
- 5.Roberts TE, Robinson S, Barton PM, et al. Cost effectiveness of home based population screening for Chlamydia trachomatis in the UK: economic evaluation of Chlamydia Screening Studies (ClaSS) project. BMJ. 2007;335(7614):291–294A. doi: 10.1136/bmj.39262.683345.AE. [DOI] [PMC free article] [PubMed] [Google Scholar]
- 6.Geisler WM, Wang C, Morrison SG, et al. The natural history of untreated Chlamydia trachomatis infection in the interval between screening and returning for treatment. Sex Transm Dis. 2008;35(2):119–123. doi: 10.1097/OLQ.0b013e318151497d. [DOI] [PubMed] [Google Scholar]
- 7.Hook EW, III, Spitters C, Reichart CA, et al. Use of cell culture and a rapid diagnostic assay for Chlamydia trachomatis screening. JAMA. 1994;272(11):867–870. [PubMed] [Google Scholar]
- 8.Paavonen J, Kousa M, Saikku P, et al. Treatment of non-gonococcal urethritis with trimethoprim-sulfadiazine and with placebo—a double-blind partner-controlled study. Br J Vener Dis. 1980;56(2):101–104. doi: 10.1136/sti.56.2.101. [DOI] [PMC free article] [PubMed] [Google Scholar]
- 9.Rahm VA, Belsheim J, Gleerup A, et al. Asymptomatic carriage of Chlamydia trachomatis: a study of 109 teenage girls. Eur J Sex Transm Dis. 1986;3(2):91–94. [Google Scholar]
- 10.Rees E. The treatment of pelvic inflammatory disease. Am J Obstet Gynecol. 1980;138(7):1042–1047. doi: 10.1016/0002-9378(80)91105-9. [DOI] [PubMed] [Google Scholar]
- 11.Oakeshott P, Kerry S, Aghaizu A, et al. Randomised controlled trial of screening for Chlamydia trachomatis to prevent pelvic inflammatory disease: the POPI (Prevention of Pelvic Infection) trial. BMJ. 2010;340:c1642. doi: 10.1136/bmj.c1642. [DOI] [PMC free article] [PubMed] [Google Scholar]
- 12.Østergaard L, Andersen B, Møller JK, et al. Home sampling versus conventional swab sampling for screening of Chlamydia trachomatis in women: a cluster-randomized 1-year follow-up study. Clin Infect Dis. 2000;31(4):951–957. doi: 10.1086/318139. [DOI] [PubMed] [Google Scholar]
- 13.Scholes D, Stergachis A, Heidrich FE, et al. Prevention of pelvic inflammatory disease by screening for cervical chlamydial infection. N Eng J Med. 1996;334(21):1362–1366. doi: 10.1056/NEJM199605233342103. [DOI] [PubMed] [Google Scholar]
- 14.Low N, Egger M, Sterne JAC, et al. Incidence of severe reproductive tract complications associated with diagnosed genital chlamydial infection: the Uppsala Women's Cohort Study. Sex Transm Infect. 2006;82(3):212–218. doi: 10.1136/sti.2005.017186. [DOI] [PMC free article] [PubMed] [Google Scholar]
- 15.Adams EJ, Turner KM, Edmunds WJ. The cost effectiveness of opportunistic chlamydia screening in England. Sex Transm Infect. 2007;83(4):267–274. doi: 10.1136/sti.2006.024364. [DOI] [PMC free article] [PubMed] [Google Scholar]
- 16.National Chlamydia Screening Programme Team, Health Protection Agency. National Chlamydia Screening Programme 2011. http://www.chlamydiascreening.nhs.uk/ps/index.html. (Accessed May 9, 2012)
- 17.Althaus C, Heijne J, Roellin A, et al. Transmission dynamics of Chlamydia trachomatis affect the impact of screening programs. Epidemics. 2010;2(3):123–131. doi: 10.1016/j.epidem.2010.04.002. [DOI] [PubMed] [Google Scholar]
- 18.Geisler WM. Duration of untreated, uncomplicated Chlamydia trachomatis genital infection and factors associated with chlamydia resolution: a review of human studies. J Infect Dis. 2010;202(suppl 2):S104–S113. doi: 10.1086/652402. [DOI] [PubMed] [Google Scholar]
- 19.Korenromp EL, Sudaryo MK, de Vlas SJ, et al. What proportion of episodes of gonorrhoea and chlamydia becomes symptomatic? Int J STD AIDS. 2002;13(2):91–101. doi: 10.1258/0956462021924712. [DOI] [PubMed] [Google Scholar]
- 20.Price MJ, Ades AE, De Angelis D, et al. Mixture-of-exponentials models to explain heterogeneity in studies of the duration of Chlamydia trachomatis infection. Stat Med. 2013;32(9):1547–1560. doi: 10.1002/sim.5603. [DOI] [PubMed] [Google Scholar]
- 21.Low N, Bender N, Nartey L, et al. Effectiveness of chlamydia screening: systematic review. Int J Epidemiol. 2009;38(2):435–448. doi: 10.1093/ije/dyn222. [DOI] [PubMed] [Google Scholar]
- 22.Aghaizu A, Adams EJ, Turner K, et al. What is the cost of pelvic inflammatory disease and how much could be prevented by screening for Chlamydia trachomatis? Cost analysis of the Prevention Of Pelvic Infection (POPI) trial. Sex Transm Infect. 2011;87(4):312–317. doi: 10.1136/sti.2010.048694. [DOI] [PubMed] [Google Scholar]
- 23.Risser WL, Risser JMH. The incidence of pelvic inflammatory disease in untreated women infected with Chlamydia trachomatis: a structured review. Int J STD AIDS. 2007;18(11):727–731. doi: 10.1258/095646207782212351. [DOI] [PubMed] [Google Scholar]
- 24.Gottlieb SL, Berman SM, Low N. Screening and treatment to prevent sequelae in women with Chlamydia trachomatis genital infection: how much do we know? J Infect Dis. 2010;202(2):S156–S167. doi: 10.1086/652396. [DOI] [PubMed] [Google Scholar]
- 25.Land JA, van Bergen JEAM, Morré SA, et al. Epidemiology of Chlamydia trachomatis infection in women and the cost-effectiveness of screening. Hum Reprod Update. 2010;16(2):189–204. doi: 10.1093/humupd/dmp035. [DOI] [PubMed] [Google Scholar]
- 26.Wiggins R, Graf S, Low N, et al. Real-time quantitative PCR to determine chlamydial load in men and women in a community setting. J Clin Microbiol. 2009;47(6):1824–1829. doi: 10.1128/JCM.00005-09. [DOI] [PMC free article] [PubMed] [Google Scholar]
- 27.Michel CE, Sonnex C, Carne CA. Chlamydia trachomatis load at matched anatomic sites: implications for screening strategies. J Clin Microbiol. 2007;45(5):1395–1402. doi: 10.1128/JCM.00100-07. [DOI] [PMC free article] [PubMed] [Google Scholar]
- 28.Geisler WM, Suchland RJ, Whittington WLH, et al. Quantitative culture of Chlamydia trachomatis: relationship of inclusion-forming units produced in culture to clinical manifestations and acute inflammation in urogenital disease. J Infect Dis. 2001;184(10):1350–1354. doi: 10.1086/323998. [DOI] [PubMed] [Google Scholar]
- 29.Herzog SA, Heijne JCM, Althaus CL, et al. Describing the progression from Chlamydia trachomatis and Neisseria gonorrhoeae to pelvic inflammatory disease: systematic review of mathematical modeling studies. Sex Transm Dis. 2012;39(8):628–637. doi: 10.1097/OLQ.0b013e31825159ff. [DOI] [PubMed] [Google Scholar]
- 30.LaMontagne DS, Baster K, Emmett L, et al. Incidence and reinfection rates of genital chlamydial infection among women aged 16–24 years attending general practice, family planning and genitourinary medicine clinics in England: a prospective cohort study by the Chlamydia Recall Study Advisory Group. Sex Transm Infect. 2007;83(4):292–303. doi: 10.1136/sti.2006.022053. [DOI] [PMC free article] [PubMed] [Google Scholar]
- 31.Grimmett GDR, Stirzaker DR. Probability and Random Processes. Oxford, United Kingdom: Oxford University Press; 1992. [Google Scholar]
- 32.Lunn DJ, Thomas A, Best N, et al. WinBUGS—a Bayesian modeling framework: concepts, structure, and extensibility. Stat Comput. 2000;10(4):325–337. [Google Scholar]
- 33.Lunn D. WinBUGS Differential Interface (WBDiff) 2004. Cambridge, United Kingdom: MRC Biostatistics Unit, Institute of Public Health, University of Cambridge; 2013. http://www.winbugs-development.org.uk/ (Accessed March 21, 2013) [Google Scholar]
- 34.Price MJ, Welton NJ, Ades AE. Parameterization of treatment effects for meta-analysis in multi-state Markov models. Stat Med. 2011;30(2):140–151. doi: 10.1002/sim.4059. [DOI] [PubMed] [Google Scholar]
- 35.Welton NJ, Ades AE. Estimation of Markov chain transition probabilities and rates from fully and partially observed data: uncertainty propagation, evidence synthesis and model calibration. Med Decis Making. 2005;25(6):633–645. doi: 10.1177/0272989X05282637. [DOI] [PubMed] [Google Scholar]
- 36.Taylor H, Karlin S. An Introduction to Stochastic Modeling. 3rd ed. San Diego, CA: Academic Press, Inc; 2006. [Google Scholar]
- 37.Dempster AP. The direct use of likelihood for significance testing. Stat Comput. 1997;7(4):247–252. [Google Scholar]
- 38.Spiegelhalter DJ, Best NG, Carlin BP, et al. Bayesian measures of model complexity and fit. J R Stat Soc Series B Stat Methodol. 2002;64(4):583–616. [Google Scholar]
- 39.Stamm WE, Guinan ME, Johnson C, et al. Effect of treatment regimens for Neisseria gonorrhoeae on simultaneous infection with Chlamydia trachomatis. N Engl J Med. 1984;310(9):545–549. doi: 10.1056/NEJM198403013100901. [DOI] [PubMed] [Google Scholar]
- 40.van Valkengoed IGM, Morre SA, van den Brule AJC, et al. Overestimation of complication rates in evaluations of Chlamydia trachomatis screening programmes—implications for cost-effectiveness analyses. Int J Epidemiol. 2004;33(2):416–425. doi: 10.1093/ije/dyh029. [DOI] [PubMed] [Google Scholar]
- 41.Boeke AJP, van Bergen JEAM, Morre SA, et al. The risk of pelvic inflammatory disease associated with urogenital infection with Chlamydia trachomatis; literature review. Ned Tijdschr Geneeskd. 2005;149(16):878–884. [PubMed] [Google Scholar]
- 42.Simms I, Hornert P. Has the incidence of pelvic inflammatory disease following chlamydial infection been overestimated? Int J STD AIDS. 2008;19(4):285–286. doi: 10.1258/ijsa.2007.007316. [DOI] [PubMed] [Google Scholar]
- 43.Andersen B, Østergaard L, Puho E, et al. Ectopic pregnancies and reproductive capacity after Chlamydia trachomatis positive and negative test results: a historical follow-up study. Sex Transm Dis. 2005;32(6):377–381. doi: 10.1097/01.olq.0000154512.86651.07. [DOI] [PubMed] [Google Scholar]
- 44.Bakken IJ, Skjeldestad FE, Nordbo SA. Chlamydia trachomatis infections increase the risk for ectopic pregnancy: a population-based, nested case-control study. Sex Transm Dis. 2007;34(3):166–169. doi: 10.1097/01.olq.0000230428.06837.f7. [DOI] [PubMed] [Google Scholar]
- 45.Bakken IJ, Skjeldestad FE, Lydersen S, et al. Births and ectopic pregnancies in a large cohort of women tested for Chlamydia trachomatis. Sex Transm Dis. 2007;34(10):739–743. doi: 10.1097/01.olq.0000261326.65503.f6. [DOI] [PubMed] [Google Scholar]
- 46.Bakken IJ, Ghaderi S. Incidence of pelvic inflammatory disease in a large cohort of women tested for Chlamydia trachomatis: a historical follow-up study. BMC Infect Dis. 2009;9(130) doi: 10.1186/1471-2334-9-130. [DOI] [PMC free article] [PubMed] [Google Scholar]
- 47.Hillis SD, Owens LM, Marchbanks PA, et al. Recurrent chlamydial infections increase the risks of hospitalization for ectopic pregnancy and pelvic inflammatory disease. Am J Obstet Gynecol. 1997;176(1):103–107. doi: 10.1016/s0002-9378(97)80020-8. [DOI] [PubMed] [Google Scholar]
- 48.Treharne JD, Ripa KT, Mardh PA, et al. Antibodies to Chlamydia trachomatis in acute salpingitis. Br J Vener Dis. 1979;55(1):26–29. doi: 10.1136/sti.55.1.26. [DOI] [PMC free article] [PubMed] [Google Scholar]
- 49.Brihmer C, Kallings I, Norde CE, et al. Salpingitis; aspects of diagnosis and etiology: a 4-year study from a Swedish capital hospital. Eur J Obstet Gynecol Reprod Biol. 1987;24(3):211–220. doi: 10.1016/0028-2243(87)90020-7. [DOI] [PubMed] [Google Scholar]
- 50.Taylor-Robinson D, Stacey CM, Jensen JS, et al. Further observations, mainly serological, on a cohort of women with or without pelvic inflammatory disease. Int J STD AIDS. 2009;20(10):712–718. doi: 10.1258/ijsa.2008.008489. [DOI] [PubMed] [Google Scholar]
- 51.Svensson L, Westrom L, Ripa KT, et al. Differences in some clinical and laboratory parameters in acute salpingitis related to culture and serologic findings. Am J Obstet Gynecol. 1980;138(7):1017–1021. doi: 10.1016/0002-9378(80)91099-6. [DOI] [PubMed] [Google Scholar]
- 52.Simms I, Warburton F, Westrom L. Diagnosis of pelvic inflammatory disease: time for a rethink. Sex Transm Infect. 2003;79(6):491–494. doi: 10.1136/sti.79.6.491. [DOI] [PMC free article] [PubMed] [Google Scholar]
- 53.Sellors J, Mahony J, Goldsmith C, et al. The accuracy of clinical findings and laparoscopy in pelvic inflammatory disease. Am J Obstet Gynecol. 1991;164(1):113–120. doi: 10.1016/0002-9378(91)90639-9. [DOI] [PubMed] [Google Scholar]
- 54.Sellors JW, Mahony JB, Chernesky MA, et al. Tubal factor infertility: an association with prior chlamydial infection and asymptomatic salpingitis. Fertil Steril. 1988;49(3):451–457. doi: 10.1016/s0015-0282(16)59772-6. [DOI] [PubMed] [Google Scholar]
- 55.Osser S, Persson K, Liedholm P. Tubal infertility and silent chlamydial salpingitis. Hum Reprod. 1989;4(3):280–284. doi: 10.1093/oxfordjournals.humrep.a136888. [DOI] [PubMed] [Google Scholar]
- 56.Cates W, Jr, Joesoef MR, Goldman MB. Atypical pelvic inflammatory disease: can we identify clinical predictors. Am J Obstet Gynecol. 1993;169(2):341–346. doi: 10.1016/0002-9378(93)90085-w. [DOI] [PubMed] [Google Scholar]
- 57.Wølner-Hanssen P. Silent pelvic inflammatory disease—is it overstated. Obstet Gynecol. 1995;86(3):321–325. doi: 10.1016/0029-7844(95)00177-S. [DOI] [PubMed] [Google Scholar]
- 58.Herzog SA, Althaus CL, Heijne JCM, et al. Timing of progression of Chlamydia trachomatis infection to pelvic inflammatory disease: a mathematical modelling study. BMC Infect Dis. 2012;12(1):187. doi: 10.1186/1471-2334-12-187. [DOI] [PMC free article] [PubMed] [Google Scholar]
- 59.Simms I, Stephenson JM. Pelvic inflammatory disease epidemiology: what do we know and what do we need to know? Sex Transm Infect. 2000;76(2):80–87. doi: 10.1136/sti.76.2.80. [DOI] [PMC free article] [PubMed] [Google Scholar]
Associated Data
This section collects any data citations, data availability statements, or supplementary materials included in this article.