

Abstract
Improving strategies for diagnosing infection by the four human Plasmodium species parasites is important as field-based epidemiologic and clinical studies focused on malaria become more ambitious. Expectations for malaria diagnostic assays include rapid processing with minimal expertise, very high specificity and sensitivity, and quantitative evaluation of parasitemia to be delivered at a very low cost. Toward fulfilling many of these expectations, we have developed a post-polymerase chain reaction (PCR)/ligase detection reaction-fluorescent microsphere assay (LDR-FMA). This assay, which uses Luminex® FlexMAP™ microspheres, provides simultaneous, semi-quantitative detection of infection by all four human malaria parasite species at a sensitivity and specificity equal to other PCR-based assays. In blinded studies using P. falciparum-infected blood from in vitro cultures, we identified infected and uninfected samples with 100% concordance. Additionally, in analyses of P. falciparum in vitro cultures and P. vivax-infected monkeys, comparisons between parasitemia and LDR-FMA signal intensity showed very strong positive correlations (r > 0.95). Application of this multiplex Plasmodium species LDR-FMA diagnostic assay will increase the speed, accuracy, and reliability of diagnosing human Plasmodium species infections in epidemiologic studies of complex malaria-endemic settings.
INTRODUCTION
Controlling malaria infection in endemic regions has been an important goal of the World Health Organization since it was founded in 1948.1 Confidence in attaining and surpassing this goal flourished in the 1950s when chloroquine and DDT showed promise of eradicating malaria by killing plasmodia and anopheline species, respectively.2 However, widespread resistance to these agents in parasite and vector populations has complicated malaria control.2 A recent estimate suggests that approximately 2 billion people are exposed to malaria and more than 500 million clinical cases of Plasmodium falciparum malaria occur annually.3
In the context of these current challenges, significant efforts are underway to develop malaria vaccines,4 introduce new strategies to maximize the impact of a limited arsenal of approved, effective and affordable antimalarial drugs,5 and develop more effective mosquito control efforts that reduce transmission of malaria parasites.6–8 In addition to these new approaches for limiting replication and spread of malaria parasites, advancing technology continues to improve the efficiency of diagnosing infection by the four human malaria parasite species.9–11 These improved diagnostic strategies will be important in clinical trials of new antimalarial drugs and in vaccine development where estimating post-treatment parasitemia by highly sensitive and specific techniques is necessary for patient safety, reducing diagnostic error, and improving the estimation of drug/vaccine efficacy.12,13 Moreover, it is important to overcome inconsistencies in malaria diagnosis commonly observed with blood smear microscopy, as Ohrt and others have shown how relatively low levels of false positive errors can contribute to substantial underestimation of protective efficacy of drugs in clinical trials.12 In particular, this has resulted in a substantial effort to improve training and expertise in malaria microscopy (Ohrt C, unpublished data).
Our earlier studies have applied14 and advanced9,15 previously developed polymerase chain reaction (PCR)–based approaches16,17 for diagnosing infection by malaria parasites. Most recently, we have shown how sequence-specific ligase chain reaction techniques9 may be used to perform multiplex assays to simplify diagnosis of P. falciparum, P. vivax, P. malariae, and P. ovale. Here we introduce implementation of oligonucleotide probes bound covalently to microspheres designed to emit unique classification fluorescence to this diagnostic strategy. This modification of our multiplex malaria diagnostic assay simplifies 96-well plate processing. Furthermore, in evaluating the semi-quantitative capacity of this method, we find that this assay is capable of performing simultaneous comparisons of blood-stage parasite levels for all four human malaria parasite species in mixing experiments and in detection of parasites from in vitro cultures and infected animals.
MATERIALS AND METHODS
Plasmodium falciparum culture
The P. falciparum laboratory strain Mun01 (kindly provided by Alfred Cortes, Papua New Guinea Institute of Medical Research, Mill Hill, London) was propagated in vitro in human red blood cells (RBCs) (blood type O+) following standard malaria parasite culturing techniques.18 Briefly, the culture medium (RPMI 1640 medium, 25 mM HEPES, 0.25% sodium bicarbonate) was supplemented with 0.5% Albumax II, 2.2 mM L-glutamine, 0.08 mg/mL of gentamicin, and 0.2 mM hypoxanthine. Parasites were grown at 37°C in an atmosphere of 5% CO2, 1% O2, and 94% N2 to a density of 2% (mixed developmental stage infection) at a 5% hematocrit before harvesting by centrifugation at 1,200 rpm for five minutes. All serial dilutions were performed using leukocyte-depleted whole blood washed three times with equal volumes of RPMI 1640 medium. Thin blood smears were fixed with 100% methanol for 30 seconds, stained with 4% Giemsa for 30 minutes, and examined by microscopy with an oil-immersion objective (100×). Parasitemia was based on the number of infected RBCs (IRBCs)/(infected plus uninfected RBCs [n = 1,000]).
Plasmodium vivax infections
Monkeys (Aotus nancymai) were infected by intravenous inoculation of parasitized RBCs. Beginning one day after inoculation of P. vivax-IRBCs, thick and thin blood films were made by the method of Earle and Perez,19 stained with Giemsa, and examined microscopically. Parasites were recorded per microliter of blood. Blood samples (0.2 mL) from 11 infected monkeys harboring infections with P. vivax (Salvador I, Chesson, and Thai 3 strains) were obtained by venipuncture. Blood samples were collected in K+ EDTA-coated Vacutainer® (Becton Dickinson, Franklin Lakes, NJ) tubes and shipped from the Centers for Disease Control and Prevention (CDC) (Atlanta, GA) to Case Western Reserve University (Cleveland, OH) where DNA extraction and ligase detection reaction-fluorescent microsphere assay (LDR-FMA)-based diagnosis was conducted. Monkeys did not receive anti-malarial drugs during this study. Protocols for infecting monkeys with malaria parasites were reviewed and approved by the CDC Institutional Animal Care and Use Committee according to Public Health Service Policy.
Extraction of DNA
DNA was extracted from malariainfected human (parasite cultures) and non-human primate (whole blood) samples (200 μL) using the QIAamp DNA blood mini kit (Qiagen, Valencia, CA). Parasitemias of blood samples harboring individual Plasmodium species infections were 5.0 × 10⁴ IRBCs/μL for P. falciparum, 4.4 × 10⁴ IRBCs/μL for P. vivax, 1.5 × 10⁴ IRBCs/μL for P. malariae, and 3.6 × 10² IRBCs/μL for P. ovale. DNA concentrations for plasmids containing four species-specific small subunit (ssu) ribosomal RNA (rRNA) genes14 were 0.3 ng/μL for P. falciparum (GenBank accession no. AF145334), 0.3 ng/μL for P. vivax (GenBank accession no. AF145335), 0.4 ng/μL for P. malariae (GenBank accession no. AF145336), and 0.4 ng/μL for P. ovale (GenBank accession no. AF145337).
Polymerase chain reaction amplification
Amplification of the ssu rRNA gene fragment (491–500 basepairs) was conducted in PCR mixtures previously described.9,15 The optimal PCR cycle number for detecting semi-quantitative differences in Plasmodium species template concentration was determined by analyzing dilutions of genomic DNA representing each of the four human Plasmodium parasite species. The PCR products were subjected to electrophoresis on 2% agarose gels, stained with SYBR® Gold (Molecular Probes, Eugene, OR), and were visualized on a Storm 860 using ImageQuant, 5.2 software (Molecular Dynamics, Sunnyvale, CA).
Plasmodium species-specific post-PCR multiplex LDR
The LDR analysis used to identify P. falciparum, P. vivax, P. malariae, and P. ovale amplicons specifically was designed as follows. The LDR probes consisted of five species-specific probes and two fluorescently labeled conserved sequence probes (Table 1). Each species-specific primer was modified at the 5′ end by addition of unique 24-base FlexMAP™ TAG (Luminex Corporation, Austin, TX) sequences to allow subsequent hybridization with FlexMAP™ anti-TAG probes coupled to microspheres that emit unique fluorescent signals. Conserved sequence primers were 5′ phosphorylated and 3′ biotinylated by the supplier (Integrated DNA Technologies, Coralville, IA). The LDRs were conducted in a solution (15 μL) containing 20 mM Tris-HCl buffer, pH 7.6, 25 mM potassium acetate, 10 mM magnesium acetate, 1 mM NAD+, 10 mM dithiothrietol, 0.1% Triton X-100, 10 nM (200 fmol) of each LDR probe, 1 μL of each PCR product, and 2 units of Taq DNA ligase (New England Biolabs, Beverly, MA). Reactions were initially heated at 95°C for one minute, followed by 32 thermal cycles at 95°C for 15 seconds (denaturation) and 58.0°C for 2 minutes (annealing/ligation).
Table 1.
Small subunit ribosomal DNA ligation direction reaction primers for differentiation of human malaria parasite species*
| Species-specific | Primer sequence‡ | FlexMAP™ microsphere§ |
|---|---|---|
| Primers† | ||
| Pf1 | 5′-ctatctatctaactatctatacaTGT AGC ATT TCT TAG GGA ATG TTG ATT TTA TAT-3′ | 78 |
| Pf2 | 5′-tacactttctttctttctttctttAAA AGT CAT CTT TCG AGG TGA CTT-3′ | 12 |
| Pv | 5′-cttttcatcttttcatctttcaatAAA ATA AGA ATT TTC TCT TCG GAG TTT ATT C-3′ | 37 |
| Pm | 5′-ttacctttatacctttctttttacAAG AGA CAT TCT TAT ATA TGA GTG TTT CTT-3′ | 30 |
| Po | 5′-ctactatacatcttactatactttTAA GAA AAT TCC TTT CGG GGA AAT TTC-3′ | 14 |
| Conserved¶ | ||
| Common1 | 5′/Phos/TAG AAT TGC TTC CTT CAG TAC CTT ATG-3′ Biotin | |
| Common2 | 5′/Phos/TTA GAT WGC TTC CTT CAG TRC CTT ATG-3′ Biotin |
Pf = Plasmodium falciparum; Pv = P. vivax; Pm = P. malariae; Po = P. ovale.
Species-specific primers are based on GenBank files Pf1 (M19173), Pf2 (M19172), Pv (U07367), Pm (M54897), and Po (L48987). Conserved probe sequences are based on GenBank files: Ca (M19173) and C2 (M19172, U07367, M54897, L48987).
Nucleotides in lower case (24 base) represent the TAG sequences added to the 5′ end of each species-specific LDR primer.
One hundred unique Luminex® microsphere sets are synthesized to exhibit unique fluorescence. Each microsphere set is coupled to different anti-TAG sequences. Anti-TAG sequences are complementary to the species-specific TAG sequences.
Nucleotide codes W and R correspond to T or A, and G or A degeneracy, respectively.
Labeling and detection of LDR products
The multiplex LDR product (5 μL) was added to 60 μL of hybridization solution (3 M tetramethylammonium chloride [TMAC], 50 mM Tris-HCl, pH 8.0, 3 mM EDTA, pH 8.0, 0.10% sodium dodecyl sulfate) containing 250 beads from each Luminex® FlexMAP™ microsphere set (total number of sets = 5). Optimization of microsphere concentrations to detect LDR products was performed as described recently by Bruse and others (unpublished data). Mixtures were heated to 95°C for 90 seconds and incubated at 37°C for 40 minutes to allow hybridization between species-specific LDR products and bead-labeled anti-TAG probes. After hybridization, 6 μL of streptavidin-R-phycoerythrin (Molecular Probes) in TMAC hybridization solution (20 ng/μL) was added to the post-LDR mixture and incubated at 37°C for 40 minutes in Costar-6511M polycarbonate 96-well V-bottom plates (Corning Inc., Corning, NY). Detection of species-specific LDR:bead-labeled anti-TAG hybrid complexes was performed using a Bio-Plex array reader (Bio-Rad Laboratories, Hercules, CA); the plate temperature was set to 37°C throughout detection. This instrumentation was optimized to excite red/infra-red classification fluorochromes in embedded microspheres (proprietary Luminex technology) using a 635 nm 10-mW red diode laser (dyes emit at 658 and 712 nm) and to excite the R-phycoerythrin (PE) reporter using a 532 nm 13-mW yttrium aluminum garnet laser (PE emits at 578 nm).20 For each individual sample (total volume = 71 μL) the sample volume assayed was 50 μL and 75 microsphere plus PE fluorescence events from each microsphere set were sorted and quantitated. The Bio-Plex array reader was calibrated according to manufacturer’s specifications; the high RP1 setting (17436) was used to calibrate the reporter fluorescence detector for all diagnostic assays. Fluorescent signals are reported as median fluorescent intensity.
Species-specific discrimination of Plasmodium species infection status
Species-specific fluorescence data were collected using Bio-Plex Manager 3.0 software (Bio-Rad Laboratories). Differentiation of negative from positive fluorescent signals was performed by two approaches. First, as a negative control, each assay included a human genomic DNA sample from an individual who had not traveled to a malariaendemic region; the mean ± SD average fluorescent signals for the four individual microsphere sets was 121.2 ± 18.1 for P. falciparum (microsphere 78), 102.2 ± 38.2 for P. vivax (microsphere 37), 94.3 ± 39.0 for P. malariae (microsphere 30), and 109.0 ± 28.5 for P. ovale (microsphere 14) (values are an average of 11 individual assays). Second, for each set of assays where the composition of species-specific templates added to the PCR was known, fluorescent signals corresponding to species templates not added to the PCR were viewed as apparent negatives. Mean ± SD fluorescent signals for the four individual microsphere sets were 102.8 ± 25.3 for P. falciparum (microsphere 78), 91.4 ± 24.9 for P. vivax (microsphere 37), 89.9 ± 25.2 for P. malariae (microsphere 30), and 81.3 ± 26.5 for P. ovale (microsphere 14) (values are an average of 25 individual assays). Conservatively, these results suggested that reporter fluorescent signals greater than 200 identified samples that were positive for individual parasite species corresponding to each unique classification microsphere set.
Plasmodium vivax-specific semi-quantitative real-time PCR
For real-time PCR assays, we used the P. vivax-specific primers, probe, and amplification methods recently described by Perandin and others.21 The specificity of this assay was tested by including genomic DNA samples from P. falciparum (eight different strains), P. malariae, and P. ovale as negative controls; three different P. vivax strains (Sal I, Chesson, and Thai 3) produced positive real-time PCR results. Real-time PCR analyses were performed with one 10-minute incubation at 95°C, followed by 40 two-step cycles (95°C for 15 seconds and 60°C for 60 seconds) using a GeneAmp 5700 Sequence Detection System (Applied Biosystems, Foster City, CA).
Statistical analyses evaluating the semi-quantitative correlation between parasitemia, species-specific fluorescence signal detection, and real-time PCR detection
All correlation statistics, regression analyses (linear fit), and graphing were performed in GraphPad PRISM version 4.0 (GraphPad Software, Inc., San Diego, CA).
RESULTS
Specificity of the Plasmodium species post-PCR/LDR-FMA
We have modified a recently introduced PCR-LDR diagnostic assay for P. falciparum, P. vivax, P. malariae, and P. ovale as shown in Figure 1. After genus-specific PCR amplification, products are added to a multiplex LDR (Step 1) where species-specific upstream primers ligate to conserved sequence primers when appropriate target sequences are available in the reaction. The 5′ end of the LDR products receive classification labeling in a second multiplex (Step 2) reaction where hybridization occurs between four anti-TAG oligonucleotide probes bound to fluorescent microspheres and TAG sequences added to the species-specific primers. After this hybridization, reaction products are incubated (Step 3) in a solution containing streptavidin-R-phycoerythrin (SA-PE) to allow reporter labeling through binding to the 3′-biotin (B) on the conserved sequence primers. Detection of doubly labeled ligation products occurs through dual fluorescence flow cytometry in the Bio-Plex array reader and leads to collection of a reporter signal in unique speciesspecific bins.
Figure 1.
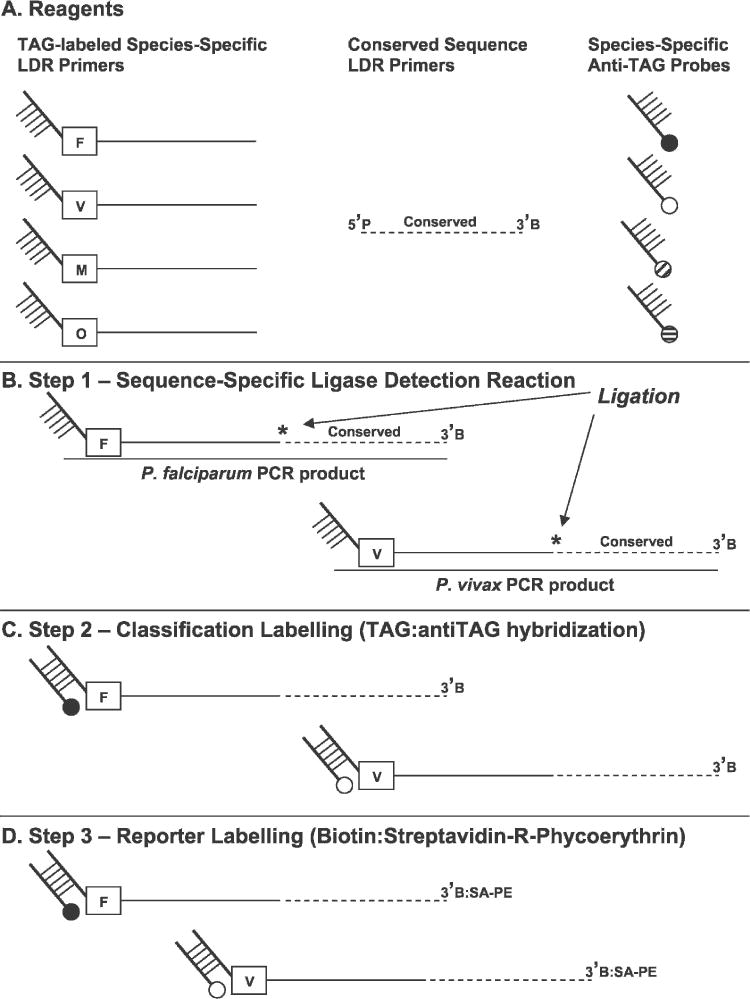
Post-polymerase chain reaction (PCR) ligase detection reaction-fluorescent microsphere assay (LDR-FMA) for diagnosis of human Plasmodium parasite species. A, Components of the Plasmodium species LDR-FMA. Species-specific TAG sequence-labeled primers (F = P. falciparum; V = P. vivax; M = P. malariae; and O = P. ovale) carry unique 5′ sequence extensions. These primers anneal to species-specific DNA sequence polymorphisms in the small subunit ribosomal RNA gene target. Conserved sequence primers are 5′ phosphorylated (P) and 3′ biotinylated. B, These primers anneal to a DNA sequence conserved among the human malaria parasite species. Species-specific anti-TAG probes hybridize to the unique 5′ TAG of the species-specific primers; probes are coupled to uniquely fluorescing microspheres represented by attached filled circles (Black = P. falciparum; white = P. vivax; diagonal stripe = P. malariae; horizontal strip = P. ovale). The orientation of species-specific and conserved sequence primers during ligase detection reactions is shown. Thermostable DNA ligase ligates (star) these primers when exact sequence hybridization occurs between the upstream and downstream primers. C, Hybridization of species-specific anti-TAG probes to LDR products and labeling of the 5′ end of these molecules with the fluorescent classification microsphere. D, Incubation of LDR products in buffer containing streptavidin-R-phycoerythrin (SA:PE) labels the 3′ end of these molecules with reporter fluorescence.
In the specificity experiments, PCR products were amplified from plasmids containing ssu rRNA genes from the four human Plasmodium species. After multiplex LDR and anti-TAG hybridization reactions, we detected only the target sequences added as templates in four single, six double, four triple, and one quadruple species PCRs as reported previously (Figure 2 in McNamara and others9). It is important to acknowledge that peak reporter signals observed for each species-specific probe complex varied depending upon TAG:anti-TAG probe combinations used; maximum fluorescent signals were approximately 4,000 for P. falciparum (microsphere set 12), 23,000 for P. vivax (microsphere set 37), 17,000 for P. malariae (microsphere set 30), and 15,000 for P. ovale (microsphere set 14). Alternative P. falciparum-specific detection using the GenBank M19172 target sequence and FlexMAP™ microsphere set 78 resulted in maximum signals of 13,000 when P. falciparum genomic DNA was used as the PCR template. Therefore, for all remaining experiments, P. falciparum results will be expressed in the context of microsphere set 78.
Multiplex detection sensitivity of Plasmodium species sequences
In preliminary experiments to evaluate the species-specific semi-quantitative sensitivity of our LDR-FMA system, we analyzed serial three-fold dilutions of genomic DNA extracted from blood samples representing infection by each human Plasmodium parasite species; starting parasitemias for individual species ranged from 300 to 50,000 IRBCs/μL. For these experiments, 27 PCR cycles were performed. Results in Figure 2 show that fluorescent signal detected for probe sets decreased in a stepwise fashion across the dilution series for each individual species. Although the relationship between parasitemia and fluorescent signals detected for each species-specific probe set varied, the linear range of fluorescence included the limit of detection for blood smear microscopy (40 IRBCs/μL). The lower limit of detection for our assay after 27 cycles of PCR was estimated to be between 0.3 and 10 IRBCs/μL. Data in Figure 2 suggest that our assay was capable of providing a semi-quantitative estimate of parasitemia between 0.3 and 1,000 IRBCs/μL. In this range, highly positive correlations between fluorescent signals and parasitemia were observed (r = 0.95–0.98, P = 0.003–0.0005, R2 = 0.91–0.96). Parasitemias analyzed in Figure 2 are commonly associated with clinical malaria parasitemias between 100 and 10,000 IRBCs/μL.22
Figure 2.
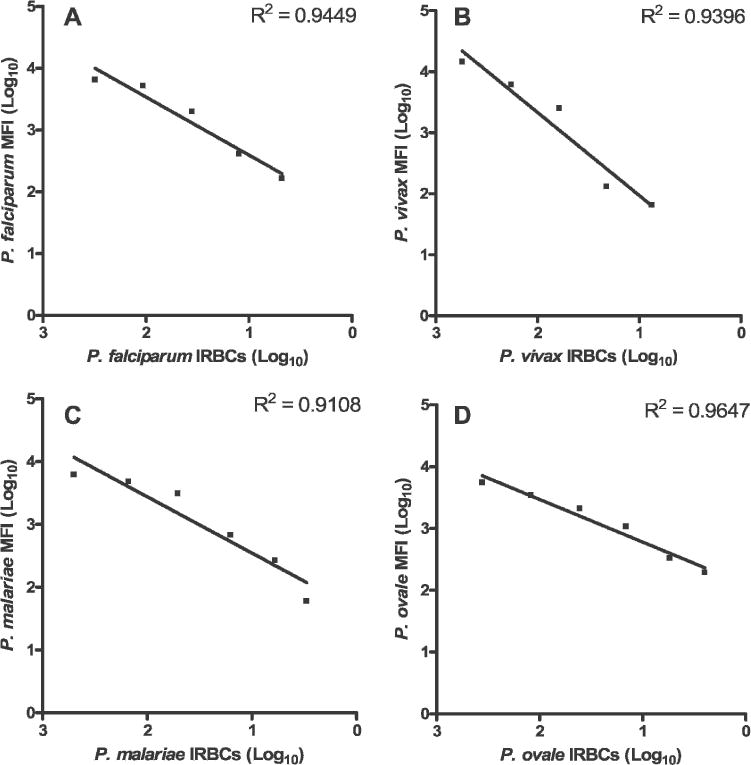
Semi-quantitative detection of Plasmodium species small subunit (ssu) ribosomal RNA (rRNA) polymerase chain reaction products by ligase detection reaction-fluorescent microsphere assay (LDR-FMA). Each experiment was performed on genomic DNA extracted from non-human primate blood samples individually infected with A, P. falciparum (5.0 × 10⁴ infected red blood cells [IRBCs]/μL), B, P. vivax (4.4 × 10⁴ IRBCs/μL), C, P. malariae (1.5 × 10⁴ IRBCs/μL), and D, P. ovale (3.6 × 10² IRBCs/μL). Three-fold serial dilutions were performed on these genomic DNA samples to represent parasitemias ranging between approximately 1,000 and 0.1 IRBCs/μL. Individual semi-quantitative detection assays were performed following PCR amplification (27 cycles) of single-species ssu rRNA template sequences. Each detection experiment was performed using multiplex LDR and FlexMAP™ anti-TAG probe hybridization master mixes. For these experiments, the Bio-Plex array reader was set to assay 75 microsphere plus phycoerythrin fluorescence (molecules doubly labeled with classification and reporter fluorescence); P. falciparum microsphere set 78, P. vivax microsphere set 37, P. malariae microsphere set 30, and P. ovale microsphere set 14. Highly significant linear fit between mean fluorescent intensity (MFI) (log10 transformed) and the number of IRBCs/μL (log10 transformed) were observed for each individual Plasmodium species experiment; R2 = 0.91–0.96.
Because we observed variation in LDR-FMA signal intensities between assays, it was important to include the dilution series shown in Figure 2 in all diagnostic assays. Furthermore, to maximize the space available on 96-well plates, we combined these species-specific dilutions into seven wells; one additional well per plate was dedicated to a no DNA control. In this configuration, up to 88 research samples may be evaluated for infection complexity on each 96-well plate. To test whether combining the dilution controls might confound species-specific detection, we organized samples in wells 1–7 so that template concentrations for P. falciparum and P. ma-lariae decreased, while template concentrations for P. vivax and P. ovale increased. The last sample in each dilution series was a no DNA control for each species. The data in Table 2 are averages of 12 individual experiments and show that fluorescent signals detected across these combined controls were similar to those observed for each of the individual species-specific dilutions. High concentrations of one species did not cause false-positive detection of that species in negative controls of other species. We did not observe that high concentrations of one species consistently inhibited detection of minority species.
Table 2.
Correlation of Plasmodium species parasitemia with semi-quantitative ligase direction reaction–fluorescent microsphere assay fluorescence in combined dilution series controls*
|
P. falciparum
|
P. vivax
|
P. malariae
|
P. ovale
|
||||||||
|---|---|---|---|---|---|---|---|---|---|---|---|
| Tube | MFI† | IRBCs/μL | Tube | MFI | IRBCs/μL | Tube | MFI | IRBCs/μL | Tube | MFI | IRBCs/μL |
| 1 | 14,687.0 | 7,667 | 1 | 92.7 | (−) | 1 | 8,634.7 | 5,000 | 1 | 83.5 | (−) |
| 2 | 11,983.9 | 2,556 | 2 | 116.7 | 60 | 2 | 7,358.5 | 1,667 | 2 | 104.6 | 1.5 |
| 3 | 10,145.9 | 852 | 3 | 380.8 | 181 | 3 | 5,694.8 | 556 | 3 | 107.8 | 4 |
| 4 | 5,834.7 | 284 | 4 | 2,171.0 | 543 | 4 | 3,600.7 | 185 | 4 | 129.6 | 13 |
| 5 | 2,418.0 | 95 | 5 | 9,959.8 | 1,630 | 5 | 1,686.1 | 62 | 5 | 330.8 | 40 |
| 6 | 669.9 | 32 | 6 | 20,811.6 | 4,889 | 6 | 491.9 | 21 | 6 | 622.0 | 120 |
| 7 | 166.8 | (−) | 7 | 23,373.3 | 14,667 | 7 | 104.6 | (−) | 7 | 828.5 | 360 |
| Exp(−) | 121.2 | 0 | Exp(−) | 102.2 | 0 | Exp(−) | 94.3 | 0 | Exp(−) | 109.0 | 0 |
Median fluorescence intensity (MFI) values are based on an average of 12 individual assays. IRBC = infected red blood cells, (−) = no DNA control for individual species dilutions; Exp(−) = genomic DNA from an individual who has not traveled to a malaria-endemic region.
Values correspond to reporter MFI associated with the P. falciparum (microsphere 78), P. vivax (microsphere 37), P. malariae (microsphere 30), and P. ovale (microsphere 14) classification microspheres.
Semi-quantitative evaluation of in vitro and in vivo parasitemia
Given that fluorescent signals detected across dilution series for each human malaria parasite species were observed to be positively correlated with the concentration of DNA template added to the PCRs, we compared the semiquantitative fluorescent signals detected by the LDR-FMA and parasitemia evaluated by blood smear microscopy. The investigator performing LDR-FMA and real-time PCR diagnostic assays was blinded from the blood smear parasitemia data in all of these experiments.
We first performed our analyses on in vitro cultures of P. falciparum. Parasitemia of the starting culture was judged by microscopic evaluation of thin smears to be 5 × 10⁴ IRBCs/μL. A series of infected blood samples were then generated by diluting the starting culture using leukocyte-depleted whole blood. With this group of samples we included blood samples to which no parasite culture was added. We then performed LDR-FMA as described in the semi-quantitative species-specific and species-mixing experiments described above. Results in Table 3 show that the P. falciparum-specific fluorescent signals decreased as the parasitized culture was diluted; fluorescent signals were consistently higher for specific parasitemias than that shown in Table 2. Results in Table 3 also show that the fluorescent signal for the blood sample to which no parasite culture was added (tube no. 11) was equivalent to the no DNA controls. Additional samples from a dilution series were estimated to contain 0.3–1.3 IRBCs/μL produced positive LDR-FMA fluorescent signals; samples containing no IRBCs were LDR-FMA negative.
Table 3.
Correlating in vitro Plasmodium falciparum parasitemia and Plasmodium species semi-quantitative ligation direction reaction–fluorescent microsphere assay fluorescence*
| Tube number† | Infected cells‡ per μL | Fluorescent reading§ |
|---|---|---|
| 1 | 50,000.0 | 13,232 |
| 2 | 500.0 | 10,951 |
| 3 | 250.0 | 10,095 |
| 4 | 125.0 | 7,561 |
| 5 | 62.5 | 6,492 |
| 6 | 31.3 | 3,871 |
| 7 | 15.6 | 2,787 |
| 8 | 7.8 | 2,055 |
| 9 | 5.0 | 1,419 |
| 10 | 2.5 | 843 |
| 11 | 0.0 | 135 |
The investigator performing these diagnostic assays was blinded from the parasitemia of individual culture samples.
Tube 2 was a 100-fold dilution of the starting 1% culture; Tubes 3–10 were 2-fold dilutions starting from Tube 2.
Estimated parasitemia based upon an unsynchronized culture.
Fluorescent readings are median fluorescent intensities collected by the BioPlex array reader. Apparent negative fluorescent readings for P. vivax, P. malariae, and P. ovale ranged from 45 to 146.
We next performed LDR-FMA diagnosis on a series of P. vivax-infected blood samples (Sal I and Chesson strains) collected on 2–4-day intervals over a one-month period from a group of 11 Aotus monkeys (total sample number = 103). Results in Figure 3A show a highly positive relationship between blood smear microscopy and LDR-FMA fluorescent signals (Pearson’s r = 0.90, 95% confidence interval [CI] = 0.85–0.93, P < 0.0001, R2 = 0.80); 20 PCR cycles. Because a number of studies have demonstrated close correlations between blood smear microscopy and semi-quantitative realtime PCR assay results,10,11,21,23,24 we further analyzed these same infected monkey blood samples to compare P. vivax-specific semi-quantitative analysis by LDR-FMA and realtime PCR. Results shown in Figure 3B show a strong correlation between blood smear microscopy and the cycle threshold values (Pearson’s r = −0.80, 95% CI = −0.86 to −0.71, P < 0.0001, R2 = 0.63) (Ct; PCR cycle number at which detection of the P. vivax-specific amplicon was observed above background fluorescence for the sequence-specific Taqman probe). Furthermore, the correlation between semiquantitative P. vivax LDR-FMA and real-time PCR diagnosis were strongest between LDR-FMA fluorescence values of 143 (log10 = 2.16) to 5,900 (log10 = 3.77) and real-time PCR Cts corresponding to 26.36–33.85 cycles (Pearson’s r = −0.91, 95% CI = −0.94 to −0.86, P < 0.0001, R2 = 0.83). Results of triplicate experiments for 19 samples showed close agreement with the direct comparison between LDR-FMA and real-time PCR (replicate 1, Pearson’s r = −0.93, 95% CI = −0.97 to −0.82, P < 0.0001, R2 = 0.86; replicate 2, Pearson’s r = −0.77, 95% CI = −0.90 to −0.50, P < 0.0001, R2 = 0.60).
Figure 3.
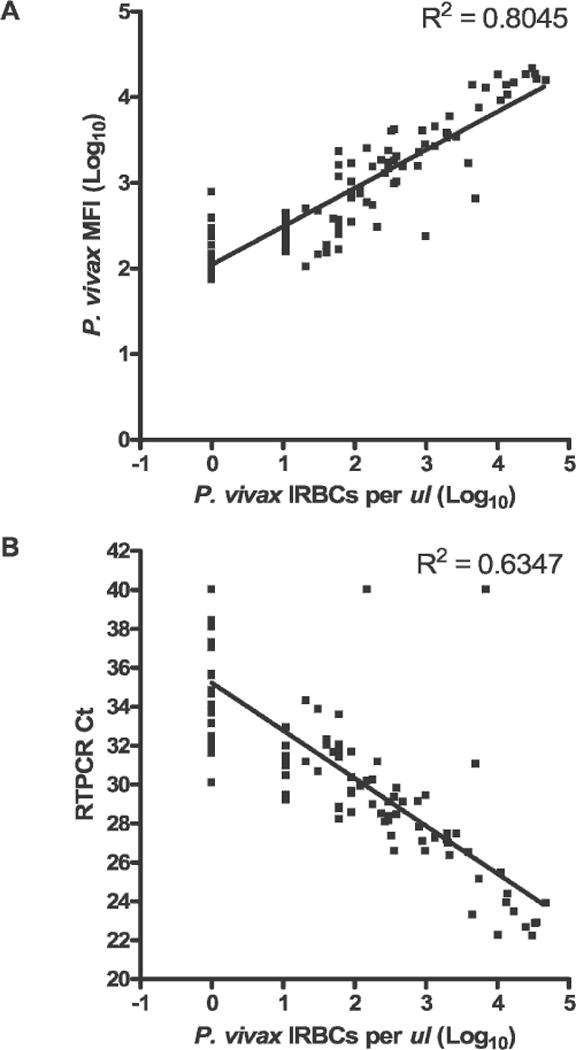
Comparison of semi-quantitative microscopy and post-polymerase chain reaction (PCR) detection of Plasmodium vivax infection in Aotus monkeys. Blood samples from 11 different Aotus monkeys infected with P. vivax (Sal I or Chesson strains) were collected at 4–9 time points. A, Linear relationship between blood smear microscopy and ligase detection reaction-fluorescent microsphere assay. MFI = mean fluorescent intensity. B, Linear relationship between blood smear microscopy and real-time PCR. Blood smear parasitemia ranged between 0 and 36,000 infected red blood cells (IRBCs)/μL of whole blood. Monkeys were not receiving antimalarial treatment during the time of these infections. RTPCR Ct = reverse transcription-PCR cycle number.
Finally, overall concordance among these assays was greater than 76% (microscopy versus LDR-FMA = 90.3%, microscopy versus real-time PCR = 76.7%, LDR-FMA versus real-time PCR = 84.5%). Further evaluation showed that discordance between assays occurred largely from diagnostic differences of 26 blood smear-negative samples. With 20 cycles of PCR, 17 of these samples were negative for P. vivax infection by LDR-FMA (9 were scored as P. vivax positive); 4 of the samples determined by microscopy and LDR-FMA as not infected were also P. vivax negative by real-time PCR (22 were scored as P. vivax positive). One sample with a parasitemia of 20 IRBCs/μL by microscopy was judged to be P. vivax negative by LDR-FMA; the real-time Ct for this sample was 34.31. Two samples with parasitemias of 150 IRBCs/μL and 7,000 IRBCs/μL by microscopy were P. vivax negative by real-time PCR; the LDR-FMA fluorescence readings for these samples were 2,526 (log10 = 3.40) and 12,722 (log10 = 4.10), respectively. The nine blood smear-negative samples were positive by LDR-FMA (range of reporter fluorescence = 146 [log10 = 2.16] to 781 [log10 = 2.89]) and real-time PCR (Ct values = 38.10−30.09). For 13 samples negative by blood smear and LDR-FMA but positive by real-time PCR, Ct values for the real-time PCR assay ranged from 38.43 to 33.67.
DISCUSSION
We have developed a multiplex assay for diagnosis of P. falciparum, P. vivax, P. malariae, and P. ovale in infected blood samples where detection of post-PCR/LDR products uses Luminex® FlexMAP™ probes. By introducing these microsphere-coupled probes that emit unique fluorescent classification signals, we have eliminated our earlier reliance on polyacrylamide gel electrophoresis9 to differentiate LDR products representing the four human Plasmodium parasite species. This modification contributes toward automation, efficiency, and qualitative uniformity of PCR-based malaria diagnosis because sample processing from DNA extraction to data entry into database files may now be handled continuously through a 96-well plate format. Additionally, in contrast to early studies using Luminex technology,25,26 differences in detection instrumentation, molecular targets, and approaches we have taken make it possible to reduce the concentration of microsphere-labeled probes 20–50-fold without compromising diagnostic results. Based upon this effort to optimize detection of the Plasmodium species LDR products, and through the availability of pre-labeled FlexMAP™ anti-TAG probes, current cost to perform this LDR-FMA diagnostic assay is $0.30 per individual.
We have evaluated the specificity and sensitivity of this assay system through mixing experiments using all four human malaria parasite species. Because we previously observed that signal intensities of the LDR products varied consistently with species-specific parasitemia within individual samples,9 we were interested in evaluating the correlation between parasitemia determined by conventional microscopy and LDR-FMA reporter fluorescent signal intensities. Our overall results showed consistent semi-quantitative reduction in reporter fluorescence for three of the four human malaria parasite species-specific probes across a series of three-fold dilutions covering a range between 1 and 10,000 IRBCs/μL; analysis of P. ovale was limited by a starting parasitemia of 360 IRBCs/μL. These same results were obtained whether the diagnostic assay was configured to detect single or the full multiplex of Plasmodium species target products. Furthermore, in mixing experiments with decreasing P. falciparum and P. malariae DNA concentrations and increasing P. vivax and P. ovale DNA concentrations, we did not observe that high concentrations of one species caused false-positive signals from other species in low concentration or absent from the starting target mixture. Additionally, we did not observe that detection of minority parasite species was obscured when the DNA concentration of majority species was 100-fold higher. We anticipate that larger differences in DNA template concentrations may affect PCR efficiency of minority species. It may be possible to avoid this type of interference observed here and by others using real-time PCR strategies10 through further optimization of PCR and/or LDR primer concentrations. Alternatively, it may be necessary to compare assays based upon species- versus genus-specific PCR amplification strategies.21
Through analysis of infection levels in in vitro P. falciparum cultures and P. vivax-infected monkeys, we have performed additional comparisons of semi-quantitative assessment of IRBCs by conventional blood-smear microscopy, LDR-FMA, and real-time PCR. These studies showed highly significant correlations between microscopy and both LDR-FMA and real-time PCR. Despite variability in LDR-FMA fluorescent signal intensity, we also observed a highly significant correlation between LDR-FMA (reporter fluorescence range = 143–5,900) and real-time PCR (Ct range = 26.36–33.85). This comparative study identifies strengths and limitations of each diagnostic approach as follows.
The molecular analyses appeared to detect P. vivax infections beyond the limits of blood smear detection where LDR-FMA judged 9 and real-time PCR judged 22 microscopy-negative samples as infected. In regard to the nine blood smear-negative/LDR-FMA-positive diagnoses, four of these discordant results were collected from the same monkey, and microscopy-negative blood samples were flanked by microscopy-positive samples collected within three days; the remaining five discordant results occurred at the end of the observation period. Here it is important to recall that none of the monkeys were treated with anti-malarial drugs during the study and therefore may have carried a parasitemia below the limit of microscopy. In regard to potential false-negative results from molecular diagnostic assays, it is of continuing importance to identify technical steps where sample processing might lead to discordance of this nature.
In comparing the two molecular strategies, real-time PCR methodologies allow for continuous evaluation of fluorescence signal detection associated with infection, while LDR-FMA diagnosis evaluates a single end-point. In this study, we chose to position the PCR endpoint to be consistent with a range of parasitemia that would cover the limits of detection by microscopy. By selecting an endpoint with a higher number of PCR cycles, we anticipated that comparable strong correlations would be observed between LDR-FMA and realtime PCR for samples with lower numbers of IRBCs. Determination of the level of sensitivity desired for malaria diagnosis will vary among different epidemiologic or antimalarial drug or vaccine studies.
Introduction of multiplex LDR-FMA for semi-quantitative assay for all four human Plasmodium species parasites occurs as a number of real-time PCR-based strategies are being described in the literature. Alternative approaches to multiplex real-time PCR-based diagnosis of the human malaria species infections detect amplified products through incorporation of SYBR Green dye11 or through hybridization of Taqman probes to internal sequences.10,21,23,24 Only one of these approaches using SYBR Green detection has demonstrated assessment of all four human Plasmodium parasite species in a single multiplex analysis.11 Perandin and others suggested that sequence polymorphism in the 18S rRNA gene prevented satisfactory development of a P. malariae-specific probe.21 This observation of molecular diversity within the 18S rRNA sequence among the human malaria parasite species poses a particular problem to Taqman-based real-time PCR diagnostic strategies that are limited to a maximum of four different fluorescent labels. Through the availability of up to 100 uniquely fluorescent FlexMAP™ microspheres (Luminex®) LDR-FMA does not face this limitation. This advantage of the LDR-FMA is of additional importance when designing probes to evaluate multiple allele systems associated with anti-malarial drug resistance27,28 and antigenic diversity.29
In conclusion, we and others have recently reviewed22,30 the advantages and limitations of blood smear, antigen capture, and PCR methods for malaria diagnosis. The effort to develop molecular-based strategies for malaria diagnosis is driven by the widely acknowledged limited specificity and sensitivity of blood smear diagnosis, the ensuing challenges associated with accurate evaluation of infections that include low parasitemia and/or a mixture of species, and the shortage of expert microscopists. Development of our semiquantitative LDR-FMA provides highly specific and sensitive malaria diagnosis and is likely to improve diagnosis of minority species in mixed-Plasmodium species infections. Furthermore, large-scale PCR-based sample evaluation is significantly more efficient and will reduce the burden on microscopists in large epidemiologic studies. It will be important to compare results from our newly developed assay with blood smear diagnosis conducted where infection by all four human malaria parasite species and mixed species infections are common such as Papua New Guinea.14,15,31,32 The LDR-FMA diagnostic assay will allow more thorough analyses of species-specific fluctuation of parasitemia in response to drug or vaccine treatment. This new diagnostic method will also enhance studies evaluating associations between infection prevalence and parasite levels with human genetic polymorphisms observed in PNG populations.33–36
Acknowledgments
We thank Rajeev Mehlotra, Shannon Bruse, Jodi Thomson, JoAnn Sullivan, Kiet Dan Luc, and Hisashi Fujioka for technical assistance and advice during the course of this study. We also thank Sherry Dunbar, Christopher L. King, Ingrid Felger, and Ivo Mueller for helpful comments and criticisms during the preparation of the manuscript.
Financial support: This study was supported by grants from the National Institutes of Health (NIH) (AI-46919 and AI-52312). Brian T. Grimberg and Jennifer Cole-Tobian received support from NIH grant AI-07024.
Footnotes
Reprint requests: Peter A. Zimmerman, Center for Global Health and Diseases, Case Western Reserve University School of Medicine, Wolstein Research Building, 4-125, Cleveland, OH 44106-7286, Telephone: 216-368-0508, Fax: 216-368-4825, E-mail: paz@case.edu.
Contributor Information
DAVID T. McNAMARA, Center for Global Health and Diseases, Case Western Reserve University School of Medicine, Wolstein Research Building, 4-125, Cleveland, OH 44106-7286
LAURIN J. KASEHAGEN, Center for Global Health and Diseases, Case Western Reserve University School of Medicine, Wolstein Research Building, 4-125, Cleveland, OH 44106-7286
BRIAN T. GRIMBERG, Center for Global Health and Diseases, Case Western Reserve University School of Medicine, Wolstein Research Building, 4-125, Cleveland, OH 44106-7286
JENNIFER COLE-TOBIAN, Center for Global Health and Diseases, Case Western Reserve University School of Medicine, Wolstein Research Building, 4-125, Cleveland, OH 44106-7286.
WILLIAM E. COLLINS, Division of Parasitic Diseases, National Center for Infectious Diseases, Centers for Disease Control and Prevention, 4770 Buford Highway, Atlanta, GA 30341
PETER A. ZIMMERMAN, Center for Global Health and Diseases, Case Western Reserve University School of Medicine, Wolstein Research Building, 4-125, Cleveland, OH 44106-7286.
References
- 1.Russell PF. Man’s Mastery of Malaria. London: Oxford University Press; 1955. [Google Scholar]
- 2.Bruce-Chwatt LJ. Essential Malariology. London: William Heinemann Medical Books; 1985. [Google Scholar]
- 3.Snow RW, Guerra CA, Noor AM, Myint HY, Hay SI. The global distribution of clinical episodes of Plasmodium falciparum malaria. Nature. 2005;434:214–217. doi: 10.1038/nature03342. [DOI] [PMC free article] [PubMed] [Google Scholar]
- 4.Richie TL, Saul A. Progress and challenges for malaria vaccines. Nature. 2002;415:694–701. doi: 10.1038/415694a. [DOI] [PubMed] [Google Scholar]
- 5.Greenwood B. The use of anti-malarial drugs to prevent malaria in the population of malaria-endemic areas. Am J Trop Med Hyg. 2004;70:1–7. [PubMed] [Google Scholar]
- 6.Gimnig JE, Vulule JM, Lo TQ, Kamau L, Kolczak MS, PhillipsHoward PA, Mathenge EM, ter Kuile FO, Nahlen BL, Hightower AW, Hawley WA. Impact of permethrin-treated bed nets on entomologic indices in an area of intense yearround malaria transmission. Am J Trop Med Hyg. 2003;68:16–22. [PubMed] [Google Scholar]
- 7.Riehle MA, Srinivasan P, Moreira CK, Jacobs-Lorena M. Towards genetic manipulation of wild mosquito populations to combat malaria: advances and challenges. J Exp Biol. 2003;206:3809–3816. doi: 10.1242/jeb.00609. [DOI] [PubMed] [Google Scholar]
- 8.Pates H, Curtis C. Mosquito behavior and vector control. Annu Rev Entomol. 2005;50:53–70. doi: 10.1146/annurev.ento.50.071803.130439. [DOI] [PubMed] [Google Scholar]
- 9.McNamara DT, Thomson JM, Kasehagen LJ, Zimmerman PA. Development of a multiplex PCR-ligase detection reaction assay for diagnosis of infection by the four parasite species causing malaria in humans. J Clin Microbiol. 2004;42:2403–2410. doi: 10.1128/JCM.42.6.2403-2410.2004. [DOI] [PMC free article] [PubMed] [Google Scholar]
- 10.Rougemont M, van Saanen M, Sahli R, Hinrikson HP, Bille J, Jaton K. Detection of four Plasmodium species in blood from humans by 18S rRNA gene subunit-based and species-specific real-time PCR assays. J Clin Microbiol. 2004;42:5636–5643. doi: 10.1128/JCM.42.12.5636-5643.2004. [DOI] [PMC free article] [PubMed] [Google Scholar]
- 11.Mangold KA, Manson RU, Koay ES, Stephens L, Regner M, Thomson RB, Jr, Peterson LR, Kaul KL. Real-time PCR for detection and identification of Plasmodium spp. J Clin Microbiol. 2005;43:2435–2440. doi: 10.1128/JCM.43.5.2435-2440.2005. [DOI] [PMC free article] [PubMed] [Google Scholar]
- 12.Ohrt C, Purnomo, Sutamihardja MA, Tang D, Kain KC. Impact of microscopy error on estimates of protective efficacy in malaria-prevention trials. J Infect Dis. 2002;186:540–546. doi: 10.1086/341938. [DOI] [PubMed] [Google Scholar]
- 13.Felger I, Genton B, Smith T, Tanner M, Beck HP. Molecular monitoring in malaria vaccine trials. Trends Parasitol. 2003;19:60–63. doi: 10.1016/s1471-4922(02)00066-1. [DOI] [PubMed] [Google Scholar]
- 14.Mehlotra RK, Lorry K, Kastens W, Miller SM, Alpers MP, Bockarie M, Kazura JW, Zimmerman PA. Random distribution of mixed species malaria infections in Papua New Guinea. Am J Trop Med Hyg. 2000;62:225–231. doi: 10.4269/ajtmh.2000.62.225. [DOI] [PubMed] [Google Scholar]
- 15.Mehlotra RK, Kasehagen LJ, Baisor M, Lorry K, Kazura JW, Bockarie MJ, Zimmerman PA. Malaria infections are randomly distributed in diverse holoendemic areas of Papua New Guinea. Am J Trop Med Hyg. 2002;67:555–562. doi: 10.4269/ajtmh.2002.67.555. [DOI] [PMC free article] [PubMed] [Google Scholar]
- 16.Snounou G, Viriyakosol S, Zhu XP, Jarra W, Pinheiro L, do Rosario VE, Thaithong S, Brown KN. High sensitivity of detection of human malaria parasites by the use of nested polymerase chain reaction. Mol Biochem Parasitol. 1993;61:315–320. doi: 10.1016/0166-6851(93)90077-b. [DOI] [PubMed] [Google Scholar]
- 17.Kimura M, Kaneko O, Liu Q, Zhou M, Kawamoto F, Wataya Y, Otani S, Yamaguchi Y, Tanabe K. Identification of the four species of human malaria parasites by nested PCR that targets variant sequences in the small subunit rRNA gene. Parasitol Intl. 1997;46:91–95. [Google Scholar]
- 18.Trager W, Jensen JB. Human malaria parasites in continuous culture. Science. 1976;193:673–675. doi: 10.1126/science.781840. [DOI] [PubMed] [Google Scholar]
- 19.Earle WC, Perez M. Enumeration of parasites in the blood of malarial patients. J Lab Clin Med. 1932;17:1124–1130. [Google Scholar]
- 20.Kellar KL, Iannone MA. Multiplexed microsphere-based flow cytometric assays. Exp Hematol. 2002;30:1227–1237. doi: 10.1016/s0301-472x(02)00922-0. [DOI] [PubMed] [Google Scholar]
- 21.Perandin F, Manca N, Calderaro A, Piccolo G, Galati L, Ricci L, Medici MC, Arcangeletti MC, Snounou G, Dettori G, Chezzi C. Development of a real-time PCR assay for detection of Plasmodium falciparum, Plasmodium vivax, and Plasmodium ovale for routine clinical diagnosis. J Clin Microbiol. 2004;42:1214–1219. doi: 10.1128/JCM.42.3.1214-1219.2004. [DOI] [PMC free article] [PubMed] [Google Scholar]
- 22.Zimmerman PA, Mehlotra RK, Kasehagen LJ, Kazura JW. Why do we need to know more about mixed Plasmodium species infections in humans? Trends Parasitol. 2004;20:440–447. doi: 10.1016/j.pt.2004.07.004. [DOI] [PMC free article] [PubMed] [Google Scholar]
- 23.Lee MA, Tan CH, Aw LT, Tang CS, Singh M, Lee SH, Chia HP, Yap EP. Real-time fluorescence-based PCR for detection of malaria parasites. J Clin Microbiol. 2002;40:4343–4345. doi: 10.1128/JCM.40.11.4343-4345.2002. [DOI] [PMC free article] [PubMed] [Google Scholar]
- 24.Farcas GA, Zhong KJ, Mazzulli T, Kain KC. Evaluation of the RealArt Malaria LC real-time PCR assay for malaria diagnosis. J Clin Microbiol. 2004;42:636–638. doi: 10.1128/JCM.42.2.636-638.2004. [DOI] [PMC free article] [PubMed] [Google Scholar]
- 25.Iannone MA, Taylor JD, Chen J, Li MS, Rivers P, Slentz-Kesler KA, Weiner MP. Multiplexed single nucleotide polymorphism genotyping by oligonucleotide ligation and flow cytometry. Cytometry. 2000;39:131–140. [PubMed] [Google Scholar]
- 26.Dunbar SA, van der Zee CA, Oliver KG, Karem KL, Jacobson JW. Quantitative, multiplexed detection of bacterial pathogens: DNA and protein applications of the Luminex LabMAP system. J Microbiol Methods. 2003;53:245–252. doi: 10.1016/s0167-7012(03)00028-9. [DOI] [PubMed] [Google Scholar]
- 27.Plowe CV, Cortese JF, Djimde A, Nwanyanwu OC, Watkins WM, Winstanley PA, Estrada-Franco JG, Mollinedo RE, Avila JC, Cespedes JL, Carter D, Doumbo OK. Mutations in Plasmodium falciparum dihydrofolate reductase and dihydropteroate synthase and epidemiologic patterns of pyrimethamine-sulfadoxine use and resistance. J Infect Dis. 1997;176:1590–1596. doi: 10.1086/514159. [DOI] [PubMed] [Google Scholar]
- 28.Mehlotra RK, Fujioka H, Roepe PD, Janneh O, Ursos LM, Jacobs-Lorena V, McNamara DT, Bockarie MJ, Kazura JW, Kyle DE, Fidock DA, Zimmerman PA. Evolution of a unique Plasmodium falciparum chloroquine-resistance phenotype in association with pfcrt polymorphism in Papua New Guinea and South America. Proc Natl Acad Sci U S A. 2001;98:12689–12694. doi: 10.1073/pnas.221440898. [DOI] [PMC free article] [PubMed] [Google Scholar]
- 29.Cole-Tobian J, King CL. Diversity and natural selection in Plasmodium vivax Duffy binding protein gene. Mol Biochem Parasitol. 2003;127:121–132. doi: 10.1016/s0166-6851(02)00327-4. [DOI] [PubMed] [Google Scholar]
- 30.Moody A. Rapid diagnostic tests for malaria parasites. Clin Microbiol Rev. 2002;15:66–78. doi: 10.1128/CMR.15.1.66-78.2002. [DOI] [PMC free article] [PubMed] [Google Scholar]
- 31.Bruce MC, Donnelly CA, Alpers MP, Galinski MR, Barnwell JW, Walliker D, Day KP. Cross-species interactions between malaria parasites in humans. Science. 2000;287:845–848. doi: 10.1126/science.287.5454.845. [DOI] [PubMed] [Google Scholar]
- 32.Smith T, Genton B, Baea K, Gibson N, Narara A, Alpers MP. Prospective risk of morbidity in relation to malaria infection in an area of high endemicity of multiple species of Plasmodium. Am J Trop Med Hyg. 2001;64:262–267. doi: 10.4269/ajtmh.2001.64.262. [DOI] [PubMed] [Google Scholar]
- 33.Zimmerman PA, Woolley I, Masinde GL, Miller SM, McNamara DT, Hazlett F, Mgone CS, Alpers MP, Genton B, Boatin BA, Kazura JW. Emergence of FY*A(null) in a Plasmodium vivax-endemic region of Papua New Guinea. Proc Natl Acad Sci U S A. 1999;96:13973–13977. doi: 10.1073/pnas.96.24.13973. [DOI] [PMC free article] [PubMed] [Google Scholar]
- 34.Patel SS, Mehlotra RK, Kastens W, Mgone CS, Kazura JW, Zimmerman PA. The association of the glycophorin C exon 3 deletion with ovalocytosis and malaria susceptibility in the Wosera, Papua New Guinea. Blood. 2001;98:3489–3491. doi: 10.1182/blood.v98.12.3489. [DOI] [PubMed] [Google Scholar]
- 35.Maier AG, Duraisingh MT, Reeder JC, Patel SS, Kazura JW, Zimmerman PA, Cowman AF. Plasmodium falciparum erythrocyte invasion through glycophorin C and selection for Gerbich negativity in human populations. Nat Med. 2003;9:87–92. doi: 10.1038/nm807. [DOI] [PMC free article] [PubMed] [Google Scholar]
- 36.Patel SS, King CL, Mgone CS, Kazura JW, Zimmerman PA. Glycophorin C (Gerbich antigen blood group) and band 3 polymorphisms in two malaria holoendemic regions of Papua New Guinea. Am J Hematol. 2004;75:1–5. doi: 10.1002/ajh.10448. [DOI] [PMC free article] [PubMed] [Google Scholar]