

Abstract
The skeletal system functions as a locomotive organ and a mineral reservoir and combinations of genetic and environmental factors affect the skeletal system. Although delayed puberty is associated with compromised bone mass, suppression of estrogen should be beneficial to cortical strength. The purpose was to employ path analysis to study bone strength and delayed puberty. Forty-five female rats were randomly assigned to a control group (n = 15) and an experimental group (n = 30) that received injections of gonadotropin releasing hormone antagonist (GnRH-a). Causal models were constructed by specifying directed paths between bone traits. The first model tested the hypothesis that the functional relationships between bone traits and body weight were altered by a delay in pubertal onset. GnRH-a injections during puberty altered the covariation between body weight and bone size. The second model was constructed to test the hypothesis that variability in stiffness was causally related to variability in body weight. The model also tested the relationship between the periosteal and endocortical surfaces and their relationship to stiffness. There was no change in the relationship between the surfaces in the GnRH-a group. The third model determined the effect of estradiol on both total area and relative cortical area in both groups. The relationship between periosteal surface and serum estradiol levels was only significant during estrogen suppression. These data suggest that increases in body weight during or prior to puberty may not be protective of bone strength.
Keywords: Bone architecture/structure, Biomechanics, Bone histology, Bone histomorphometry, Steroid hormones, Estrogens, Path analysis
The skeletal system functions as both a locomotive organ and a mineral reservoir and combinations of multiple genetic and environmental factors (both local and systemic) affect the skeletal system. Therefore, in order to produce a functional skeletal system, a single optimal bone architecture may not exist. Studies have reported that genetic variants in one trait are compensated by the covariation of other traits. This covariation is a buffering mechanism to protect against variants that may affect mechanical function. Covariation of morphology and composition maintained mechanical function in mouse strains with genetic variants that impaired periosteal expansion, resulting in slender bones [1]. Understanding the mechanisms of the relationships between traits [2] and not merely enumerating the individual components may lead to a better understanding of factors that affect bone strength development.
The timing of puberty has emerged as a crucial factor in bone strength development. Osteoporosis has been called “a pediatric disease with geriatric consequences” [3]. Peak bone mineral accrual rate occurs at puberty [4], with an accrual of 26% of total adult bone mineral within 2 years [5]. However, a delay in menarche and infrequent menstrual cycles decrease estrogen levels during adolescence and may decrease peak bone mass [6–8]. Warren et al. [9] reported that the age at menarche was more correlated with stress fracture occurrence than with bone mineral density (BMD). Furthermore, in a comparison of fractured versus nonfractured elite female athletes, BMD was not different between groups, however, there was a significantly later age at menarche (puberty) in the fractured group [10]. A stress fracture incidence as high as 20% has been reported in prospective studies of young female athletes and military recruits [11]. Moreover, stress fractures may be an indicator of inadequate bone health. Identification of the covariation of bone traits during a delay in pubertal onset may result in potential therapeutic strategies.
Although primary and secondary amenorrhea are associated with compromised bone mass [9, 12, 13], a suppression of estrogen should be beneficial to cortical bone structure and strength. Prepubertal girls and boys have similar bone geometry and muscle size, however, boys experience greater periosteal expansion and cortical thickening during puberty than girls, and men therefore have stronger femora than women [14]. Studies have identified estradiol and its increase during puberty to be the source of sexual dimorphism between males and females. Males’ periosteal surface increases postpuberty and females’ periosteal expansion is suppressed, with an increased cortical width resulting from endocortical apposition [15, 16]. As a result a delay in pubertal onset in females and suppressed estradiol levels should then result in increased periosteal diameter, potentially producing stronger bones, since the resistance to bending or torsional forces is exponentially related to bone diameter. Following gonadectomy (OVX), bone formed at a rate 75% of control animals in males, whereas a 130% increased periosteal bone formation compared to control animals was reported in female rats [17, 18]. In addition, increased periosteal expansion of 105% was found in females, while there was a 47% reduction of periosteal expansion in males following OVX [19]. Endocortical diameter remained unchanged in male femora, yet female bones had an increased endocortical diameter [19]. As a result mechanical strength following OVX in females may not decrease and has actually been reported to increase in some studies [20–22]. These data support the hypothesis that suppressed estradiol levels in females should result in a stronger bone. Although it is tempting to interpret changes in bone geometry as having a positive effect on bone strength, an animal model of delayed puberty (suppressed estrogen levels) has reported short-term decreases in peak moment and stiffness without changes in total area or bone area [23]. Therefore morphologic changes may not completely explain the adaptation to a delay in pubertal onset. The goals of this analysis were to employ a path analysis (structural equation modeling) to study bone strength and delayed puberty to determine if there was a change in the covariation of bone traits following a delay in pubertal onset (hypothalamic suppression). It was hypothesized that body weight would correlate with cortical bone morphology even after hypothalamic suppression during puberty. Second, it was hypothesized that estradiol suppression would result in an increased total area and thus increased bone strength.
Path analysis is a well-established multivariate technique that tests for causal relationships among multiple traits [24], which is similar to multiple regression but examines relationships in the broader context of how all traits covary simultaneously. Multiple factors (traits) interact and result in bone strength. The relationship of the traits can change in sign and significance when analyzed with other potentially confounding traits [25]. Independent and dependent traits are selected based on a priori hypotheses of how a system functions. The direction of the relationship is critical in determining the overall goodness of fit for the proposed model [1]. The directionality between traits provides the basis for implying causal relationships. There is an increase in the use of path analysis to investigate the complex networks relating to bone strength and fragility [1, 25–28].
Materials and Methods
We analyzed data from a study that used two doses of gonadotropin releasing hormone antagonist (GnRH-a) to delay pubertal onset [29]. Forty-five female Sprague-Dawley rats (23 days of age; Charles Rivers Laboratories, Wilmington, MA, USA) were randomly assigned to a control group (C; n = 15) and two experimental groups (n = 15/group) that received injections of GnRH-a. Injections (0.2 ml) of either saline or the GnRH-a (Zentaris GmbH) were given intraperitoneally. The experimental groups were injected with either 1.25 mg/kg/dose daily (7 days per week) or 5.0 mg/kg/dose, 5 days per week. The two GnRH-a groups were combined for the current analysis and represent the experimental group (GnRH-a group). All animals were monitored daily for vaginal opening, an indicator of pubertal onset. Body weights were measured weekly and at sacrifice. At approximately 7 weeks of age (C, day 49; low dose, day 49; high dose, day 48), animals were killed with an overdose of pentobarbital. Serum estradiol was measured (3rd Generation Estradiol RIA, DSL-39100; Diagnostic Systems Laboratories, Inc., Webster, TX, USA). Femora were harvested for histomorphometry, ash fraction, and mechanical testing. All procedures were approved by the Institutional Animal Care and Use Committee (IACUC) at Brooklyn College (City University of New York).
Static histomorphometric indices included total subperiosteal area (T.Ar; mm2), cortical area (Ct.Ar = (T.Ar−Vd.Ar−Po); mm2), marrow area (Ma.Ar; mm2), periosteal perimeter (identified as total perimeter in the path models) (T.Pm; mm), and endocortical perimeter (Ec.Pm; mm). Porosity (Po/Ct.Ar; %) within the intracortical envelope was calculated as ((Vd.Ar−Ma.Ar)/Ct.Ar × 100). The intracortical porosity occurred very near the endocortical perimeter and was contiguous with the marrow space in some animals but not in others. Therefore measures of void area (Vd.Ar; mm2) and void perimeter (Vd. Pm; mm) were used to express the void space near the endocortical surface. These measures included the marrow areas and any large porosity adjacent to the endocortical surface. A measure representing cortical thickness was calculated as the percentage bone area per total area (RCA). On the periosteal surface bone formation was assessed by measuring single-labeled surface (sL.Pm) and double-labeled surface (dL.Pm) and then calculating labeled surface (L.Pm/B.Pm; %) (L.Pm = dL.Pm + ½ sL.Pm). The medial-lateral and anterior-posterior moments of inertia (Iml and Iap; mm4) were measured from middiaphysis femoral cross sections using image processing software (Image J; NIH Image) and a macro (Momentmacro; C. Ruff, Ph.D., The Johns Hopkins University School of Medicine). The mean polar moment of inertia (Jo; mm4) was then calculated.
The femurs were loaded to failure at a rate of 0.05 mm/ s, during which displacement and force data were collected (100 Hz). The force and displacement values were normalized using terms derived from engineering analysis of three-point bending [30]. Bending moments were calculated from the force (F) data (M = FL/4) (N/mm). Displacement data were divided by (L2/12; mm/mm2), where L is the distance between the lower supports (16 mm). Whole-bone stiffness (N/mm2) was determined from the slope of the initial linear portion of the moment-displacement curve. Ash fraction was calculated as ash weight/dry weight [31].
Path Analysis
Multiple factors (traits) interact to develop bone architecture and bone strength. The relationship of the traits can change in sign and significance when analyzed with other potentially confounding traits [25]. Independent and dependent traits and their relationship were selected based on a priori hypotheses of how a system functions. The directions of the relationships were critical in determining the overall goodness of fit for the proposed models [1]. Three models were constructed by specifying directed paths between selected bone traits to examine the functional adaptation to delayed pubertal onset. The paths identified related traits and indicated the direction of the causal relationship between them. The first model was constructed to test the hypothesis that the functional relationship between cortical width and body weight is altered by a delay in pubertal onset. Ct.Ar/T.Ar or relative cortical area (RCA) was used as a measure of cortical width. The relationship of the body weight and bone size (T.Ar/ Length) and percentage ash content to the relative cortical area was analyzed (Fig. 2). T.Ar/Length as a measure of bone size controls for variation in growth in width relative to growth in length (slenderness). This measure of total area normalized by bone length is a measure of a slender or a robust bone. Robust bones tend to be wider and thus resist more loading in the diaphysis under mechanical testing but also have a smaller cortical thickness. Slender bones are narrow, with a greater cortical thickness, but have been found also to have a higher mineral content, resulting in similar strength values. Control and experimental (GnRH-a) groups were tested separately to generate two independent sets of path coefficients. The second model (Fig. 4) was constructed to test the hypothesis that variability in stiffness was causally related to variability in body weight. The model also tested the relationship between the periosteal and the endocortical surfaces and their relationship to stiffness. The third model (Fig. 7) was constructed to determine the effect of estradiol on both total subperiosteal area and RCA in both the control and the GnRH-a groups. Specifically the hypothesis that estradiol levels limit periosteal expansion was tested.
Fig. 2.

Structural model to test for functional interactions among physical traits. Path diagrams for Model A show path coefficients for the control group; diagrams for Model B, for the experimental (GnRH-a) group. Models A and B contrast the effect of hypothalamic suppression during puberty on bone traits. Model A explains 56% of the variability in Ct.Ar/T.Ar; in Model B the percentage is reduced to 9%, and the model is a worse fit to the experimental data. Straight arrows indicate which traits are related and the causal direction between them, and the thick arrows indicate significant path coefficients. Curved arrows indicate unresolved (noncausal) relationships. Structural equations and goodness-of-fit indexes are shown below each path model. The CFI (Comparative Fit Index) indicates a good fit for values >0.9. The RMSEA (root mean square error of approximation) indicates a good model fit for values <0.05
Fig. 4.

Structural model to test for functional interactions among bone strength and geometry traits. Path diagrams for Model A show path coefficients for the control group; diagrams for Model B, for the experimental (GnRH-a) group. Models A and B contrast the effect of hypothalamic suppression during puberty on bone traits. Model B explains 53% of the variability in stiffness, and in Model B the percentage is reduced to 12%. Both models are good fits to the data. Straight arrows indicate which traits are related and the causal direction between them and the thick arrows indicate significant path coefficients. Structural equations and goodness-of-fit indexes are shown below each path model. The CFI (Comparative Fit Index) indicates a good fit for values >0.9. The RMSEA (root mean square error of approximation) indicates a good model fit for values <0.05
Fig. 7.

Structural model to test for functional interactions among serum estradiol levels and geometry traits. Path diagrams for Model A show path coefficients for the control group; diagrams for Model B, for the experimental (GnRH-a) group. Model A explains 61% of the variability in Ct.Ar/T.Ar, and in Model B the percentage is reduced to 17%. Straight arrows indicate which traits are related and the causal direction between them and the thick arrows indicate significant path coefficients. Structural equations and goodness-of-fit indexes are shown below each path model. The CFI (Comparative Fit Index) indicates a good fit for values >0.9. The RMSEA (root mean square error of approximation) indicates a good model fit for values <0.05
All model analyses used AMOS 7.0 (SPSS Inc. Chicago, IL). Missing values in the data sets were replaced using a linear trend for that point. Path coefficients represent the magnitude of the direct and indirect relationships between traits. The total effect of multiple paths on a variable is determined by the sum of effects across all incoming paths. The AMOS program compared the observed and model-implied covariance matrices using a maximum likelihood estimation, and overall fit was determined by a chi-square test. A model is rejected if it does not match the observed data (p <0.05) [24]. Three model fit criterion were used to assess whether the data adequately fit the proposed models. First, a chi-square value with a p-value >0.05 indicates a good model fit. The Comparative Fit Index (CFI) indicates a good model fit at values of>0.9. Root mean square error of approximation (RMSEA) values <0.05 indicate a good model fit; 0.05 < RMSEA < 0.08, a fair fit; and RMSEA > 0.10, a poor fit. The RMSEA accounts for the number of degrees of freedom in the model.
Statistical Analyses
Unpaired t-test assessed differences between the control and the GnRH-a groups at a significance level of p < 0.05 for stiffness, cortical area, polar moment of inertia (J), and percentage labeled surface—periosteum, total subperiosteal area, and bone length (GraphPadPrism v5.01; GraphPad Software, Inc.). Stiffness values for both the control and the GnRH-a groups were linearly regressed with geometric variables including void perimeter (Vd.Pm) and periosteal perimeter (T.Pm). Body weight for both control and GnRH-a groups were linearly regressed with stiffness and polar moment of inertia (J) (GraphPadPrism v5.01; GraphPad Software, Inc.).
Results
Hypothalamic suppression using GnRH-a injections suppressed the onset of puberty [29] and significantly reduced the stiffness of the femoral diaphysis (Fig. 1A). There was no significant difference in cortical bone area yet a significantly larger polar moment of inertia (J) and periosteal perimeter in the delayed puberty (GnRH-a) bones (Fig. 1B–D). The GnRH-a group had significantly shorter bones but no significant change in total subperiosteal area (Fig. 1E, F). Furthermore, there was a significant increase in periosteal labeled surface in the GnRH-a group and a decrease in relative cortical area (RCA; Fig. 1G, H).
Fig. 1.

Results of strength, geometry, and kinetic histomorphometry measurements for the control (n = 15) and experimental (GnRH-a) (n = 30) groups. A Stiffness; B cortical area (Ct.Ar); c polar moment of inertia (J); D periosteal perimeter; E total area; F femur length; G percentage labeled surface on the periosteal surface; H relative cortical area (RCA). All measurements are mean (SD). *Significantly different from control; p < 0.05
The difference in the goodness of fit between the control and the GnRH-a groups in the first model (Fig. 2) indicates a breakdown in the body weight and bone size relationship during delayed puberty. The model for the control group (Fig. 2A) had excellent goodness-of-fit indicators. The chi-square was nonsignificant (p = 0.493). The Comparative Fit Index 1.0; a value >0.9 indicates a good fit. The RMSEA was 0.00; a value <0.05 indicates a good model fit. The model indicated that 56% of the variation of Ct.Ar/ T.Ar is explained by body weight and bone size in the control group. Percentage ash content was not affected by body weight or Ct.Ar/T.Ar. A significant negative relationship was found between bone size (T.Ar/Length) and RCA (Ct.Ar/T.Ar). A 1-SD (standard deviation) increase in T.Ar/Length results in a 0.76-SD decrease in (Ct.Ar/T.Ar). A significant positive relationship was found between body weight and Ct.Ar/T.Ar, with a path coefficient of 0.52. In contrast, only 9% of the variation in Ct.Ar/T.Ar was explained by the model in the GnRH-a group (Fig. 2B). Hypothalamic suppression during puberty altered the covariation among these traits (body weight, Ct.Ar/T.Ar, and T.Ar/Length). The paths between body weight and Ct.Ar/T.Ar and between T.Ar/Length and Ct.Ar/T.Ar were no longer significant in the GnRH-a group.
Linear regression analysis of stiffness values and geometric bone traits in both the control and the GnRH-a groups yielded nonsignificant results except for void perimeter (Fig. 3). In the control group there was an inverse relationship between void perimeter and stiffness (R2 = 0.35, p = 0.02); as the void perimeter decreased the stiffness values increased (Fig. 3A). However, in the GnRH-a group a relationship between stiffness and void perimeter was not evident (R2 = 0.02, p = 1.0). A significant positive relationship between J and body weight was found in the GnRH-a group (R2 = 0.15, p = 0.03) (Fig. 3B). As body weight increased in the GnRH-a group the cortical area was distributed farther from the neutral axis. The adaptation of J did not result in increased stiffness values in the experimental group (Figs. 1A, 3D).
Fig. 3.

Stiffness values for both the control and the GnRH-a groups were regressed against geometric bone traits (void perimeter (A) and total perimeter (C)). A significant relationship between stiffness-void perimeter in the control group was found (R2 = 0.35, p = 0.02) compared to the nonsignificant relationship in the GnRH-a group (R2 = 0.00, p = 1.0). Polar moment of inertia (J) and stiffness were regressed against body weight. A significant relationship was found in the GnRH-a group (J) (R2 = 0.15, p = 0.03)
A second path analysis, completed to test the hypothesis that variability in stiffness was causally related to variability in body weight and to periosteal and endocortical surface size, demonstrated that these relationships were altered by delayed pubertal onset (Fig. 4). The model for the control group (Fig. 4A) had excellent goodness-of-fit indicators. The chi-square was nonsignificant (p = 1.0). The CFI was 1.0. The RMSEA was 0.00. Fifty-three percent of the variation in stiffness values was explained by this model and three paths were significant. A positive path between body weight and stiffness had a path coefficient of 0.44. The path coefficient was significant yet the bivariate regressions were not, in part due to the other confounding variables in the path model. A 1-SD increase in void perimeter resulted in a 0.64-SD decrease in stiffness, similar to the result of the linear regression (Fig. 3A). An increase in periosteal perimeter resulted in an increase in void perimeter with a path coefficient of 0.48. Only 12% of the stiffness variation is accounted for by this model in the GnRH-a group (Fig. 4B). The model fit remained good, however; the paths between body weight and void perimeter and stiffness were not significant. The path between periosteal perimeter and stiffness became a significant inverse relationship, with a path coefficient of −0.42.
Interestingly, the path between periosteal perimeter and the void perimeter remained significant, with the same path coefficient (0.48) (Fig. 4A, B). The relationship between the total area and the void area also illustrates a significant relationship between periosteal and endocortical geometries (Fig. 5). These data, coupled with the increase in J in the GnRH-a group and the increase in labeled surface on the periosteal surface, may indicate an adaptation mechanism involving a coupling of periosteal and endocortical surface expansion. There was no difference between the groups in a linear regression model, with R2 values of 0.83 and 0.64, respectively, for the control and GnRH-a groups. An increase in one surface resulted in an increase in the other surface.
Fig. 5.
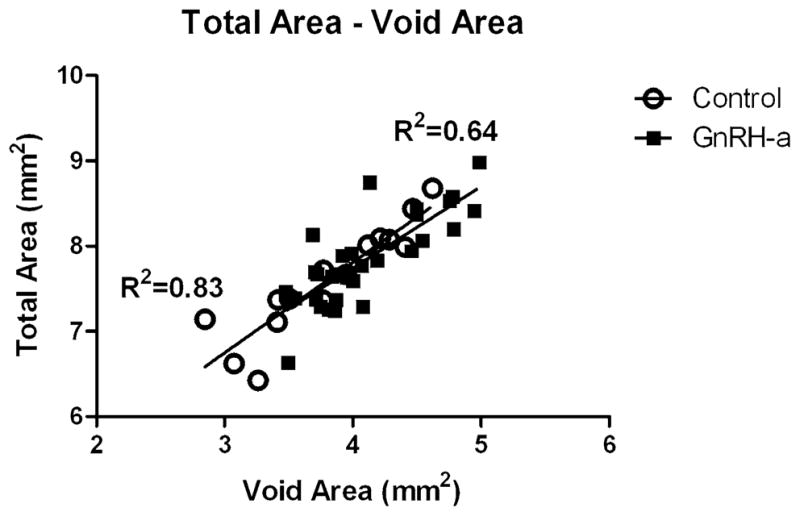
Total area for both the control and the GnRH-a groups was regressed against void area. A significant relationship was found in both the control and the GnRH-a groups (R2 = 0.83 and R2 = 0.64, levels, respectively; p < 0.0001)
The linear regression between total area and serum estradiol was not significant in the control group (R2 = 0.02, p = 0.67). But following hypothalamic suppression using GnRH-antagonist injections, after which estradiol levels were significantly suppressed, there was a significant relationship between total area and estradiol (R2 = 0.17, p = 0.03) (Fig. 6). The third path model (Fig. 7) was constructed to assess the effect of estradiol on both total subperiosteal area and relative cortical area in both the control and the GnRH-a groups. In the control group, 61% of the variation in relative cortical area (Ct.Ar/ T.Ar) was explained by body weight and a negative relationship with total area (Fig. 7A). The path coefficients between estradiol and Ct.Ar/T.Ar and total area were not significant. The model had excellent goodness-of-fit indicators. The chi-square was nonsignificant (p = 0.54). Only 17% of the variation in Ct.Ar/T.Ar was explained by these variables in the GnRH-a group. However, the paths between estradiol and total area (0.36) and Ct.Ar/T.Ar (0.44) were significant. The path between body weight and Ct.Ar/T.Ar was not significant and the path between total area and Ct.Ar/T.Ar remained significant but with a lower path coefficient: −0.47, compared to −0.80 in the control model (Fig. 7).
Fig. 6.
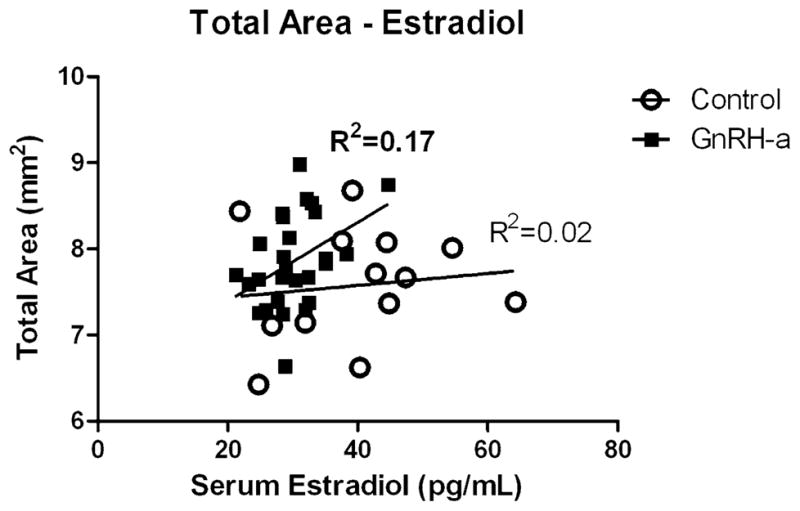
Total area for both the control and the GnRH-a groups was regressed against serum estradiol levels. A significant relationship between total area and estradiol was found in the GnRH-a group (R2 = 0.17, p = 0.03), compared to the nonsignificant relationship in the control group (R2 = 0.02, p = 0.67)
Discussion
Body Weight and Bone Size
Stiffness is significantly lower in a model of hypothalamic suppression using GnRH-a injections that significantly delayed the onset of puberty in female rats [23, 29]. The hypothesis that delayed puberty would increase strength values was rejected; however, changes in bone morphometry did occur. A significant increase in moment of inertia and periosteal perimeter and an increase in periosteal labeled surface were measured, yet the distribution of bone farther from the neutral axis did not rescue bone stiffness even with a significant increase in body weight in the GnRH-a group. Commonly it is assumed that with an increase in body weight, there will be an increased skeletal mass, and typically individuals with larger stature may need more bone mass. However, larger individuals have been found to have wider bones, not just an increase in bone mass, which would carry an increased metabolic cost [32]. Distributing bone material away from the neutral axis is a mechanism for larger individuals to develop a functional skeleton without large increases in bone mass. Recent studies using inbred mouse strains report that the amount of bone mass was inherited and constrained the adaptations available to construct a functional skeleton [1]. The current data support these results, as there was no difference in cortical area between control and experimental animals (Fig. 1B). The first path model also supports the relationship between body weight and bone size and cortical thickness in control animals (Fig. 2A); the covariation between body weight and bone size (T.Ar/ Length) accounted for 56% of the variation in relative cortical area (Ct.Ar/T.Ar). A similar relationship between these physical traits was found in both male and female mice of varying genetic backgrounds [25]. However, during a delay in pubertal onset by a suppression of the hypothalamus, the relationship between body weight and cortical thickness was altered (Fig. 2B). A sudden increase in body weight due to delayed puberty (an environmental stimulus) during growth altered the relationship among body weight, bone area, and bone robustness. Studies have reported body-weight-dependent geometric compensation for gender differences in bone material [33]. The current data suggest a breakdown in compensatory mechanisms during hypothalamic suppression evidenced by the decreased stiffness values. Increased body weight has been thought to act as an increase in mechanical load and significantly affect BMD [34]. However, conflicting data on the relationship of fat mass and BMD have been reported in humans [34], and in a congenic mouse strain a higher fat mass reduced the peak BMD [35].
An increase in body weight from an environmental change had a significant effect on mechanical strength in the current data analysis. A bivariate regression analysis did not result in a significant relationship between stiffness and body weight (Fig. 3D), however, a path model indicated that body weight had a significant contribution to stiffness values and that body weight and void perimeter explain 53% of the variance in stiffness in control animals. Body weight was not found to explain the variance in stiffness in the GnRH-a path model (Fig. 4B), but the path between periosteal perimeter and stiffness was significant, and interestingly there was an inverse relationship. An increase in total perimeter resulted in decreased stiffness values. The increased polar moment of inertia and periosteal labeled surface also were found to result in lower stiffness values. These data do not describe a mechanism for the altered relationship between body weight and stiffness or that changes in body weight directly affect bone strength. In the current analysis, the suppressed hypothalamus and estradiol levels resulted in an increased body weight similar to ovariectomy [36]; this increase in body weight may be indicative of a systemic change that altered bone metabolism. Body weight changes resulting from an environmental stimulus may not necessarily protect bone [36] but may be indicative of an underlying change in local or systemic bone homeostasis. However, the composition (lean or fat mass) of the weight increase needs further investigation, as evidence suggests a positive relationship between increases in lean body mass and bone mass.
Periosteal and Endocortical Surfaces
During growth the coordinated periosteal expansion and endocortical resorption result in a mechanically competent bone [32]. Periosteal expansion is a strategy that is theorized to maintain bone strength during the rapid loss of bone following menopause [37–39]. Studies of postmenopausal bone loss have identified correlations between endocortical diameter and periosteal diameter and hypothesized that decreased estrogen levels resulted in increased endocortical resorption, with a concomitant periosteal expansion. A bivariate regression in the current analysis resulted in a significant relationship between total area and void area in both the control and the GnRH-a groups. Following the GnRH-a injections body weight did not significantly affect stiffness yet the relationship between periosteal surface and endocortical surface remained constant (Fig. 4). In other words, the coordination between the two surfaces still models in a similar manner during delayed pubertal onset and under normal conditions. In the GnRH-a path model (Fig. 4B) the path between periosteal perimeter and stiffness became significant, indicating that an increase in periosteal perimeter of 1 SD resulted in a decrease in stiffness by 0.42 SD. However, the bivariate analysis was not significant (Fig. 3C). This is an example of how the relationship of traits can differ when tested in a model with confounding variables. Jepsen et al. [1] reported a significant relationship between body weight and cortical area in mice at 4, 8, and 16 weeks of age (R2 = 0.81, p < 0.05) yet the path in their model was not significant. The path between body weight and cortical area had a coefficient of 0.06. Their model suggests that this relationship is mediated by other factors such as tissue distribution and cortical thickness. These discrepancies between bivariate regression and path models indicate that the mechanism of interaction between two variables may not be completely understood. The bone added to the periosteal surface, which should theoretically increase bone strength, did not rescue the stiffness values in the current analysis, even though there was an increase in periosteal labeled surface suggesting an increase in osteoblast number and an increase in moment of inertia and periosteal perimeter that should translate into increased stiffness values. Yet there was not a significant increase in total subperiosteal area. Previous studies have also reported increased periosteal response and decreased mechanical strength. Tseng et al. [40] reported increases in bone geometry (cortical area and Iyy) associated with stiffness values that were not increased proportionally in mice with increased local expression of growth hormone. The mouse model for senescence (SAMP6) resulted in an increased femoral endocortical area (40%) and an increased moment of inertia (35%) but was significantly weaker (25%) [41]. However, similarly to the current data, SAMP6 mice were 15% heavier than control mice; therefore the bone sizes were appropriate relative to their increased body weight. Mov13 mice, which resulted in 50% less type 1 collagen, had lower measured failure loads at 8 weeks of age than predicted based on their bone size [42]. Multiple factors contribute to bone strength including the amount of bone, its distribution, and the quality of the bone tissue. Our data did not result in a significant relationship between ash content and bone morphology, possibly due to the use of a single genetic strain or because additional matrix compositional traits need to be utilized in the models to thoroughly assess the role bone composition in delayed puberty.
Estradiol and Bone Morphometry
Estradiol has often been associated with limiting periosteal formation in females. In the current model of delayed pubertal onset using GnRH-a injections, there was a significant suppression in serum estradiol levels as well as an increase in periosteal labeled surface as previous studies would predict [17, 18]. However, a bivariate regression did not result in a significant relationship between estradiol and total area in the control group but a significant relationship was found when estradiol levels were suppressed (Fig. 6). Evidence exists to support the concept of an estrogen “threshold”: interestingly it is data from estrogen receptor and aromatase-deficient men [43]; above the estrogen threshold there was no correlation with cortical vBMD in these men, but at low estradiol levels there was a correlation. This relationship was more difficult to identify in women, as the majority of premenopausal women are well above the estrogen threshold and postmenopausal women are below. The path models support the estrogen threshold concept; in control animals the path analysis did not result in a significant path between total area and serum estradiol levels (Fig. 7A). The model (Fig. 7A) explained 61% of the variance in relative cortical area, but as seen in the first path model (Fig. 2A) body weight and a variable representing bone size (total area) were the significant paths; estradiol did not add to the model. However, a significant path between estradiol and total area was found when the model was run with the GnRH-a group data. Although the model only explained 17% of the variance in RCA, the effect of estradiol on total area and relative cortical area was apparent. There was a significant positive path between estradiol and total area, which resulted in an inverse path with RCA. An increase in total area by 1 SD resulted in a decrease in RCA by 0.47 SD (Fig. 7B). There was a positive relationship with estradiol level and relative cortical area in the GnRH-a group, which had significantly lower estradiol levels compared to control animals, suggesting that bone is more compromised depending on the amount of estradiol suppression.
As with any analysis, limitations are associated with path analyses (structural equation modeling). First, the numbers of paths and variables that can be analyzed are limited by the number of samples in each group. Second, the models are developed based on prior knowledge of the biological system, and although there are goodness-of-fit measures that can assess the adequacy of any model, a model may have a unique solution and may not fit new data sets. There is an internal discrepancy in the comparison of the group mean data. The decreased stiffness occurs with an increase in periosteal perimeter and polar moment of inertia yet without an increase in total area. It would be expected that an increase in bone on the periosteal surface as indicated by an increase in labeled periosteal surface would increase the total size of the cross section of bone; that there was an increase in perimeter but not in total area is inconsistent. One explanation may be that the sample population was pre pubescent rats and they were in their peak growth phase. Modeling is the mechanism of large bone size and shape changes during growth in rats and humans [44, 45]. This growth is also accompanied by a “drift” or a posterior-lateral (P-L) shift of the bone (Fig. 8). The relative rates of resorption and formation on these surfaces will affect the cortical width, total cross-sectional area, moment of inertia, and thus bone strength [46]. Bone strength is based on the cellular activity of both the endocortical and the periosteal surfaces. The relative cellular activity on the periosteal and endocortical bone surfaces specifically during puberty affects bone size, a critical element of bone strength [47]. Therefore, if there was an increase in periosteal formation on the posterior-lateral surface, resorption on the anterior-medial surface may have occurred but was not measured for the current analysis. Modeling coupled with drift greatly complicates bone structure analysis.
Fig. 8.
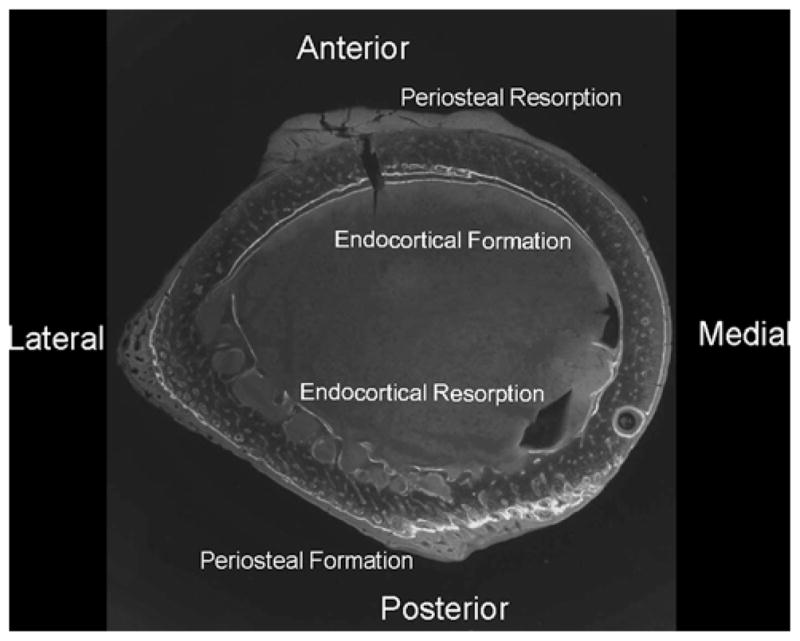
Femoral cross section illustrating the drift pattern from anterior-medial to posterior-lateral. Both the endocortical and the periosteal surfaces are forming bone, and the endocortical surface has both formation and resorption surfaces
In conclusion, a suppression of estrogen should be beneficial to mechanical strength in female bones; however, in clinical populations delayed puberty is associated with an increased incidence of stress fracture. Our model of delayed pubertal onset using GnRH-a injections resulted in a lower mechanical stiffness, an increased polar moment of inertia, an increase in labeled surface on the periosteum, and a constant cortical area compared to the control group. Path models developed and analyzed with these data compared body weight and bone geometry variables and resulted in similar results in terms of the percentage of variance explained as in previous studies [1, 25]. The relationship between body weight and bone size was altered during delayed puberty. The relationship between the periosteal and the endocortical surfaces was, however, maintained during delayed puberty. Furthermore, the relationship between periosteal surface and serum estradiol levels is only significant during the estrogen suppression. These data suggest that increases in body weight during or prior to puberty may not be protective of bone strength and that increases in bone’s robustness, perimeter, or polar moment of inertia may not always result in a mechanically stronger bone.
Acknowledgments
I thank Mona Al-Amin of the Social Science Data Library, Temple University, for her statistical expertise in path analysis.
References
- 1.Jepsen KJ, Hu B, Tommasini SM, et al. Phenotypic integration of skeletal traits during growth buffers genetic variants affecting the slenderness of femora in inbred mouse strains. Mammal Genome. 2009;20:21–33. doi: 10.1007/s00335-008-9158-1. [DOI] [PMC free article] [PubMed] [Google Scholar]
- 2.Kitano H. Systems biology: a brief overview. Science. 2002;295:1662–1664. doi: 10.1126/science.1069492. [DOI] [PubMed] [Google Scholar]
- 3.Golden NH. Osteoporosis prevention: a pediatric challenge. Arch Pediatr Adolesc Med. 2000;154:542–543. doi: 10.1001/archpedi.154.6.542. [DOI] [PubMed] [Google Scholar]
- 4.Bailey DA. The Saskatchewan pediatric bone mineral accrual study: bone mineral acquisition during the growing years. Int J Sports Med. 1997;18(Suppl 3):S191–S194. doi: 10.1055/s-2007-972713. [DOI] [PubMed] [Google Scholar]
- 5.Bailey DA, Martin AD, McKay HA, Whiting S, Mirwald R. Calcium accretion in girls and boys during puberty: a longitudinal analysis. J Bone Miner Res. 2000;15:2245–2250. doi: 10.1359/jbmr.2000.15.11.2245. [DOI] [PubMed] [Google Scholar]
- 6.Drinkwater BL, Nilson K, Chesnut CH, III, Bremner WJ, Shainholtz S, Southworth MB. Bone mineral content of amenorrheic and eumenorrheic athletes. N Engl J Med. 1984;311:277–281. doi: 10.1056/NEJM198408023110501. [DOI] [PubMed] [Google Scholar]
- 7.Pettersson U, Stalnacke B, Ahlenius G, Henriksson-Larsen K, Lorentzon R. Low bone mass density at multiple skeletal sites, including the appendicular skeleton in amenorrheic runners. Calcif Tissue Int. 1999;64:117–125. doi: 10.1007/s002239900589. [DOI] [PubMed] [Google Scholar]
- 8.Warren MP, Brooks-Gunn J, Fox RP, Lancelot C, Newman D, Hamilton WG. Lack of bone accretion and amenorrhea: evidence for a relative osteopenia in weight-bearing bones. J Clin Endocrinol Metab. 1991;72:847–853. doi: 10.1210/jcem-72-4-847. [DOI] [PubMed] [Google Scholar]
- 9.Warren MP, Brooks-Gunn J, Fox RP, Holderness CC, Hyle EP, Hamilton WG. Osteopenia in exercise-associated amenorrhea using ballet dancers as a model: a longitudinal study. J Clin Endocrinol Metab. 2002;87:3162–3168. doi: 10.1210/jcem.87.7.8637. [DOI] [PubMed] [Google Scholar]
- 10.Carbon R, Sambrook PN, Deakin V, et al. Bone density of elite female athletes with stress fractures. Med J Aust. 1990;153:373–376. doi: 10.5694/j.1326-5377.1990.tb125491.x. [DOI] [PubMed] [Google Scholar]
- 11.Loud KJ, Gordon CM, Micheli LJ, Field AE. Correlates of stress fractures among preadolescent and adolescent girls. Pediatrics. 2005;115:e399–e406. doi: 10.1542/peds.2004-1868. [DOI] [PubMed] [Google Scholar]
- 12.Myerson M, Gutin B, Warren MP, Wang J, Lichtman S, Pierson RN., Jr Total body bone density in amenorrheic runners. Obstet Gynecol. 1992;79:973–978. [PubMed] [Google Scholar]
- 13.Warren MP, Stiehl AL. Exercise and female adolescents: effects on the reproductive and skeletal systems. J Am Med Womens Assoc. 1999;54:115–120. 138. [PubMed] [Google Scholar]
- 14.Hogler W, Blimkie CJ, Cowell CT, et al. Sex-specific developmental changes in muscle size and bone geometry at the femoral shaft. Bone. 2008;42:982–989. doi: 10.1016/j.bone.2008.01.008. [DOI] [PubMed] [Google Scholar]
- 15.Garn SM, Nagy JM, Sandusky ST. Differential sexual dimorphism in bone diameters of subjects of european and african ancestry. Am J Phys Anthropol. 1972;37:127–129. doi: 10.1002/ajpa.1330370116. [DOI] [PubMed] [Google Scholar]
- 16.Tommasini SM, Nasser P, Jepsen KJ. Sexual dimorphism affects tibia size and shape but not tissue-level mechanical properties. Bone. 2007;40:498–505. doi: 10.1016/j.bone.2006.08.012. [DOI] [PubMed] [Google Scholar]
- 17.Turner RT, Vandersteenhoven JJ, Bell NH. The effects of ovariectomy and 17 beta-estradiol on cortical bone histomorphometry in growing rats. J Bone Miner Res. 1987;2:115–122. doi: 10.1002/jbmr.5650020206. [DOI] [PubMed] [Google Scholar]
- 18.Turner RT, Wakley GK, Hannon KS. Differential effects of androgens on cortical bone histomorphometry in gonadectomized male and female rats. J Orthop Res. 1990;8:612–617. doi: 10.1002/jor.1100080418. [DOI] [PubMed] [Google Scholar]
- 19.Kim BT, Mosekilde L, Duan Y, et al. The structural and hormonal basis of sex differences in peak appendicular bone strength in rats. J Bone Miner Res. 2003;18:150–155. doi: 10.1359/jbmr.2003.18.1.150. [DOI] [PubMed] [Google Scholar]
- 20.Jiang Y, Zhao J, Genant HK, Dequeker J, Geusens P. Long-term changes in bone mineral and biomechanical properties of vertebrae and femur in aging, dietary calcium restricted, and/or estrogen-deprived/-replaced rats. J Bone Miner Res. 1997;12:820–831. doi: 10.1359/jbmr.1997.12.5.820. [DOI] [PubMed] [Google Scholar]
- 21.Katsumata T, Nakamura T, Ohnishi H, Sakurama T. Intermittent cyclical etidronate treatment maintains the mass, structure and the mechanical property of bone in ovariectomized rats. J Bone Miner Res. 1995;10:921–931. doi: 10.1002/jbmr.5650100613. [DOI] [PubMed] [Google Scholar]
- 22.Peng Z, Tuukkanen J, Vaananen HK. Exercise can provide protection against bone loss and prevent the decrease in mechanical strength of femoral neck in ovariectomized rats. JBone Miner Res. 1994;9:1559–1564. doi: 10.1002/jbmr.5650091008. [DOI] [PubMed] [Google Scholar]
- 23.Yingling VR, Khaneja A. Short-term delay of puberty causes a transient reduction in bone strength in growing female rats. Bone. 2006;38:67–73. doi: 10.1016/j.bone.2005.07.001. [DOI] [PMC free article] [PubMed] [Google Scholar]
- 24.Grace JB. Structural equation modeling and natural systems. Cambridge University Press; Cambridge: 2006. [Google Scholar]
- 25.Jepsen KJ, Hu B, Tommasini SM, et al. Genetic randomization reveals functional relationships among morphologic and tissue-quality traits that contribute to bone strength and fragility. Mammal Genome. 2007;18:492–507. doi: 10.1007/s00335-007-9017-5. [DOI] [PMC free article] [PubMed] [Google Scholar]
- 26.Sharkey NA, Lang DH. Genes in context: probing the genetics of fracture resistance. Exerc Sport Sci Rev. 2007;35:86–96. doi: 10.1097/jes.0b013e31809ff2ca. [DOI] [PubMed] [Google Scholar]
- 27.Bower AL, Lang DH, Vogler GP, et al. QTL analysis of trabecular bone in BXD F2 and RI mice. J Bone Miner Res. 2006;21:1267–1275. doi: 10.1359/jbmr.060501. [DOI] [PubMed] [Google Scholar]
- 28.Li R, Svenson KL, Donahue LR, Peters LL, Churchill GA. Relationships of dietary fat, body composition, and bone mineral density in inbred mouse strain panels. Physiol Genomics. 2008;33:26–32. doi: 10.1152/physiolgenomics.00174.2007. [DOI] [PubMed] [Google Scholar]
- 29.Yingling VR, Taylor G. Delayed pubertal development by hypothalamic suppression causes an increase in periosteal modeling but a reduction in bone strength in growing female rats. Bone. 2008;42:1137–1143. doi: 10.1016/j.bone.2008.02.005. [DOI] [PMC free article] [PubMed] [Google Scholar]
- 30.Turner CH, Burr DB. Basic biomechanical measurements of bone: a tutorial. Bone. 1993;14:595–608. doi: 10.1016/8756-3282(93)90081-k. [DOI] [PubMed] [Google Scholar]
- 31.Brodt MD, Ellis CB, Silva MJ. Growing C57Bl/6 mice increase whole bone mechanical properties by increasing geometric and material properties. J Bone Miner Res. 1999;14:2159–2166. doi: 10.1359/jbmr.1999.14.12.2159. [DOI] [PubMed] [Google Scholar]
- 32.Zebaze RM, Jones A, Knackstedt M, Maalouf G, Seeman E. Construction of the femoral neck during growth determines its strength in old age. J Bone Miner Res. 2007;22:1055–1061. doi: 10.1359/jbmr.070329. [DOI] [PubMed] [Google Scholar]
- 33.Ferretti JL, Capozza RF, Mondelo N, Montuori E, Zanchetta JR. Determination of femur structural properties by geometric and material variables as a function of body weight in rats. Evidence of a sexual dimorphism. Bone. 1993;14:265–270. doi: 10.1016/8756-3282(93)90150-9. [DOI] [PubMed] [Google Scholar]
- 34.Reid IR. Obesity and osteoporosis. Ann Endocrinol (Paris) 2006;67:125–129. doi: 10.1016/s0003-4266(06)72567-7. [DOI] [PubMed] [Google Scholar]
- 35.Rosen CJ, Ackert-Bicknell CL, Adamo ML, et al. Congenic mice with low serum IGF-I have increased body fat, reduced bone mineral density, and an altered osteoblast differentiation program. Bone. 2004;35:1046–1058. doi: 10.1016/j.bone.2004.07.008. [DOI] [PubMed] [Google Scholar]
- 36.Zhao LJ, Liu YJ, Liu PY, Hamilton J, Recker RR, Deng HW. Relationship of obesity with osteoporosis. J Clin Endocrinol Metab. 2007;92:1640–1646. doi: 10.1210/jc.2006-0572. [DOI] [PMC free article] [PubMed] [Google Scholar]
- 37.Riggs BL, O’Fallon WM, Muhs J, O’Connor MK, Kumar R, Melton LJ., 3rd Long-term effects of calcium supplementation on serum parathyroid hormone level, bone turnover, and bone loss in elderly women. J Bone Miner Res. 1998;13:168–174. doi: 10.1359/jbmr.1998.13.2.168. [DOI] [PubMed] [Google Scholar]
- 38.Ahlborg HG, Johnell O, Turner CH, Rannevik G, Karlsson MK. Bone loss and bone size after menopause. N Engl J Med. 2003;349:327–334. doi: 10.1056/NEJMoa022464. [DOI] [PubMed] [Google Scholar]
- 39.Szulc P, Seeman E, Duboeuf F, Sornay-Rendu E, Delmas PD. Bone fragility: failure of periosteal apposition to compensate for increased endocortical resorption in postmenopausal women. J Bone Miner Res. 2006;21:1856–1863. doi: 10.1359/jbmr.060904. [DOI] [PubMed] [Google Scholar]
- 40.Tseng KF, Bonadio JF, Stewart TA, Baker AR, Goldstein SA. Local expression of human growth hormone in bone results in impaired mechanical integrity in the skeletal tissue of transgenic mice. J Orthop Res. 1996;14:598–604. doi: 10.1002/jor.1100140414. [DOI] [PubMed] [Google Scholar]
- 41.Silva MJ, Brodt MD, Ettner SL. Long bones from the senescence accelerated mouse SAMP6 have increased size but reduced whole-bone strength and resistance to fracture. J Bone Miner Res. 2002;17:1597–1603. doi: 10.1359/jbmr.2002.17.9.1597. [DOI] [PubMed] [Google Scholar]
- 42.Bonadio J, Jepsen KJ, Mansoura MK, Jaenisch R, Kuhn JL, Goldstein SA. A murine skeletal adaptation that significantly increases cortical bone mechanical properties. Implications for human skeletal fragility. J Clin Invest. 1993;92:1697–1705. doi: 10.1172/JCI116756. [DOI] [PMC free article] [PubMed] [Google Scholar]
- 43.Khosla S. Estrogen and bone: insights from estrogen-resistant, aromatase-deficient, and normal men. Bone. 2008;43:414–417. doi: 10.1016/j.bone.2008.05.005. [DOI] [PMC free article] [PubMed] [Google Scholar]
- 44.Rauch F, Travers R, Glorieux FH. Cellular activity on the seven surfaces of iliac bone: a histomorphometric study in children and adolescents. J Bone Miner Res. 2006;21:513–519. doi: 10.1359/jbmr.060108. [DOI] [PubMed] [Google Scholar]
- 45.Rauch F, Travers R, Glorieux FH. Intracortical remodeling during human bone development—a histomorphometric study. Bone. 2007;40:274–280. doi: 10.1016/j.bone.2006.09.012. [DOI] [PubMed] [Google Scholar]
- 46.Warden SJ, Fuchs RK, Castillo AB, Nelson IR, Turner CH. Exercise when young provides lifelong benefits to bone structure and strength. J Bone Miner Res. 2006;22(2):251–259. doi: 10.1359/jbmr.061107. [DOI] [PubMed] [Google Scholar]
- 47.Price C, Herman BC, Lufkin T, Goldman HM, Jepsen KJ. Genetic variation in bone growth patterns defines adult mouse bone fragility. J Bone Miner Res. 2005;20:1983–1991. doi: 10.1359/JBMR.050707. [DOI] [PubMed] [Google Scholar]