

Abstract
We explore the similarities and differences between the energy landscapes of proteins that have been selected by nature and those of some proteins designed by humans. Natural proteins have evolved to function as well as fold, and this is a source of energetic frustration. The sequence of Top7, on the other hand, was designed with architecture alone in mind using only native state stability as the optimization criterion. Its topology had not previously been observed in nature. Experimental studies show that the folding kinetics of Top7 is more complex than the kinetics of folding of otherwise comparable naturally occurring proteins. In this paper, we use structure prediction tools, frustration analysis, and free energy profiles to illustrate the folding landscapes of Top7 and two other proteins designed by Takada. We use both perfectly funneled (structure-based) and predictive (transferable) models to gain insight into the role of topological versus energetic frustration in these systems and show how they differ from those found for natural proteins. We also study how robust the folding of these designs would be to the simplification of the sequences using fewer amino acid types. Simplification using a five amino acid type code results in comparable quality of structure prediction to the full sequence in some cases, while the two-letter simplification scheme dramatically reduces the quality of structure prediction.
INTRODUCTION
There is considerable evidence that natural proteins have evolved to have minimally frustrated energy landscapes that are funneled towards the native state by native interactions that are stronger than alternative possibilities.1, 2, 3, 4, 5, 6 Natural protein folding is thus under thermodynamic not kinetic control. Residual frustration exists, and localized frustrated regions have been shown to be correlated with functional regions of proteins such as binding sites7 and regions that undergo partial local unfolding or reconfiguration during conformational changes necessary for allosteric regulation.8, 9 The overall low degree of frustration however distinguishes natural proteins from random heteropolymers, which have many globally unrelated low energy states. What about proteins that have been designed rationally by people with the aid of computers? Such designed sequences have also undergone a selection process, but one guided by humans and their preconceptions rather than nature and its harsh functional constraints. With the hope of controlling protein structure and functions, many methods have emerged for designing a sequence that folds reliably to a target structure. Some important and successful protein designs have focused on either stabilizing the target folded state alone, as in the Baker group's system of Top7,10 or on funneling the global landscape, as in Takada's design.11 Both design strategies can be consistent with the “principle of minimal frustration”1 if the pre-conceived ideas about the energetic force field employed in the design stage are good enough. In accord with the minimal frustration idea, robust protein design will generally also require destabilizing non-native states (explicit negative design)12 as well as ensuring native stability. Disfavoring the vast number of non-native states remains a challenge for making protein design routinely successful.
Top7 was designed in 2003 in the Baker laboratory at the University of Washington by minimizing a model free energy of a targeted single folded monomeric structure that was specifically chosen to be unlike any that had previously been observed for a natural protein.10 The design scheme started with a “sketch” of the topology and the initial sequences were generated by taking fragments from proteins with resolved structures such that the secondary structure agreed with the desired secondary structure elements of the design. They then iterated between Monte Carlo based sequence design and gradient based backbone optimization for multiple rounds, each time reoptimizing the lowest energy sequence/structure pairs found in the last round. The energy function used was a pairwise additive, implicit solvent fully atomistic model that contains hydrogen bonding and Lennard Jones terms, and gave special attention to tight packing of side chains. During the sequence optimization, most of the positions in the sequence were allowed to be mutated to any residue except for cysteine; only the surface residues of the β-strands were restricted to being polar residues. The resulting sequence had no significant homology to any known protein sequence. Despite having a novel topology and sequence, it was able to fold in the laboratory, and was found to be highly soluble and monomeric. The x-ray crystal structure of the synthesized Top7 is very similar to the targeted goal, with a root mean square deviation (RMSD) of 1.2 Å. It was noted that the crystal structure was more ordered on the C-terminal half. It was also found to be unusually stable, being still apparently folded at 98 °C. The equilibrium chemical denaturation showed a cooperative unfolding event with a midpoint around 6M Gu-HCl. At the time this was understood by some as demonstrating that extensive negative design and/or the explicit consideration of the kinetic process of folding was not necessary in order to design protein sequences that fold to unique structures.
In 2004, a study of the kinetics of several designed proteins, including Top7, was carried out.13 Besides Top7, the other proteins in the study were designed using a similar procedure to that which produced Top7, but were all designed to fold into topologies of particular natural proteins. Most of the redesigned proteins were found to fold faster than their natural counterparts. Top7 also folds quickly compared to many natural proteins of its size, but it was unusual in that, unlike most natural proteins and unlike the redesigned proteins with natural topologies, its folding exhibits complex multiphase kinetics that are essentially denaturant concentration independent under a range of folding conditions. To explain the difference in folding rates between the natural and redesigned proteins, it was suggested that perhaps natural selection favors high barriers to unfolding in order to disfavor aggregation in vivo. Three possible sources for the unique behavior of Top7 were noted: highly populated intermediates with buried hydrophobic residues, a shift of the transition state towards the unfolded state, or an increase in internal friction. Further experimental characterization in 200714 led to the conclusion that some non-native states of Top7 as well as native-like fragments of Top7 were stable at equilibrium. The kinetics were also further resolved, leading to the conclusion that one of the slow rearrangements corresponds to a transition between two collapsed states. One possible reason for the presence of multiple collapsed states was suggested, namely, that the optimization process leads to an expanded hydrophobic core. They also mention the possibility that the extreme regularity of Top7's β strands may make it easier for strand rearrangements to occur. Mutation studies helped to identify a subset of residues that are involved in a non-native intermediate as well as a different subset that was thought to be important to the transition state. In summary, this work demonstrated that not all protein sequences that can be crystallized have energy landscapes as smooth as those of most natural proteins.
Clearly then Top7 represents an interesting testing ground for protein folding theorists; some of the first serious simulation studies on this system were carried out in the Chan laboratory.15, 16 Using several variations on an essentially native-centric model, they were able to observe a stable intermediate with a folded C-terminal fragment, consistent with the previous experimental work. They initially concluded that the non-natural topology of Top7 was the dominant determining factor in its noncooperative folding, and speculated that perhaps some topologies were fundamentally uncooperative or that the artificial design procedure was not equal to that of natural evolution or selected for different traits. This initial study was followed up with a more thorough study of the simulated thermodynamics and kinetics of Top7 and S6 using a native-centric model that was perturbed by adding sequence-dependent hydrophobic interactions. They found that despite only having minor effects on the free energy profile, non-native hydrophobic interactions were absolutely essential to recreating something like the observed rollover in the folding arm of the chevron of Top7. In particular, they noted that 6 of the 7 residues mentioned as being important for non-native interactions in the experimental work of Baker et al.10, 12, 13, 23 and Watters et al.14 were indeed found to make significant non-native interactions in their simulations, with the exception being V81. They concluded that the long stretch of hydrophobic residues in the C-terminal helix of Top7 is an important contributor to its strange folding behavior. They reiterate the suggestion of Baker et al.10, 12, 13, 23 and Watters et al.14 that the regularity of the β-strands might favor incorrect pairings, but note that this would not be captured in their essentially native-centric model.
By comparing results from a structure-based model (SBM) and the Associative memory, Water mediated, Structure and Energy Model (AWSEM, an optimized predictive model), we have been able to investigate both topological and energetic factors to see about their relative impact using a fairly realistic energy function distinct from that used in the original design.
In early 2003, the Takada laboratory used a fully automated procedure inspired by energy landscape theory principles to design sequences for a target 3 helix bundle structure.11 The focus in this case was on crafting the global landscape into a funnel shape by explicit negative design against the vast number of unfolded configurations. This computationally daunting task necessitated the use of a coarse-grained model that did not emphasize tight side chain packing. The model is similar to AWSEM in that it uses a 3 atom per residue representation and explicit hydrogen bonds, but differs from AWSEM in its relatively simple hydrophobic interactions and context-dependent electrostatic interactions. Like AWSEM, Takada's model was originally developed for folding studies.17 This allowed the Takada group to base the design procedure on a set of structures coming from folding simulations. These structures were generated before the final sequence was fixed. The unfolded structures, below a certain threshold value of the number of native contacts, were used as the denatured ensemble, and a truncated and relaxed version of the protein G-related albumin binding domain (PDB ID: 1PRB) was used as the targeted structure. The sequence that corresponds to the natural protein 1PRB will be referred to as TakadaN in this paper, to emphasize the structural similarity to the designs. A Monte Carlo with simulated annealing search for optimal sequences was then performed with the Z-score as the function to be optimized. The putative sequences were then tested with folding simulations. When it was found that these sequences did not fold in simulation, a variant on the Z-score that, in addition to accounting for the gap between the unfolded state and target structure, employs the gap between the intermediate states and the target structure was used as an objective function to search for new sequences. A subset of the sequences optimized with respect to this “double Z-score” were found to fold quickly in simulation. Finally, the procedure was repeated with restrictions on the amino acid composition in order to ensure solubility, and three of the resulting sequences were chosen for experimental characterization. For the purposes of comparison, several sequences were generated for the target structure using only total energy of the native state as the objective function (while still using the same amino acid composition constraints), and the lowest of these was also experimentally characterized. All of the optimized sequences were found to have low sequence similarity to the native sequence of the target structure. Circular dichroism (CD) and nuclear magnetic resonance (NMR) experiments led them to conclude that one of the “double Z-score” optimized sequences (originally named DHB06, called TakadaZ in this study) had both stable secondary and tertiary structures. The energy optimized sequence (originally named DHBE, called TakadaE in this study) had similar amounts of secondary structure but a poorly resolved one-dimensional NMR spectrum. Diffusion measurements indicated that TakadaE was forming multimers in solution, which led to the conclusion that TakadaE may aggregate due to its lack of well defined tertiary structure. Finally, they noted that the other two Z-score optimized sequences that were experimentally characterized showed problems, either with packing or large fluctuations from the native state, in all-atom simulations whereas TakadaZ did not. They then concluded that screening designed sequences coming from coarse-grained models with all-atom simulations may be a useful way of determining beforehand which of the sequences will likely be well behaved in the laboratory.
If the problem of designing sequences to fold like proteins is understood as building in the signals necessary to fold starting from no sequence information, or from random sequences, then this immediately suggests another way of approaching the problem of determining what those signals are: gradually removing signals from natural protein sequences until folding fails. There are at least two reasonably controlled ways of accomplishing this. One interesting and practicable way is to gradually introduce more and more alanine mutations.18, 19 These studies allow us to learn tremendous amounts of detail about which parts of the sequence are important for which aspects of folding, e.g., thermodynamics and kinetics. Another equally interesting way to simplify sequences is to ask the question of how many amino acid types are necessary for a protein to fold on biological timescales. Homopolymers are unable to fold to a unique structure due to the degeneracy of collapsed conformations. If we were to introduce energetic heterogeneity to these collapsed conformations through a two-letter hydrophobic and polar code, we would begin to observe energetic discrimination among these states. However, a theoretical study has reported that two letter codes generally still give rise to many energetically low-lying non-native conformations.20 A two-letter hydrophobic/polar code can distinguish between any two states that have different degrees of segregation, but cannot go further. These theoretical considerations have been discussed further by Wolynes in Ref. 21. Although folded helical proteins generated with a three-letter code (Q, L, R) which undergo cooperative thermal denaturation have been reported,22 the Baker laboratory reported that a three-letter code was insufficient in their attempts to simplify the sequence of the SH3 domain.23 Rather, a five-letter code (I, K, E, A, G) was required in order to build two variants of the SH3 domain in which approximately 70% of the sequence was simplified. One of the resulting variants folded at a rate similar to the native sequence, while the other variant folded even faster, suggesting that evolution may emphasize thermodynamic control. In 1999, Wang reported theoretical efforts to produce a simplified code based on the concept of mismatch between a reduced interaction matrix and the Miyazawa-Jernigan matrix.24 This resulted in the same five-letter code employed by Baker.23 Sequences using the five-letter code appeared to be kinetically foldable in their model studies. However, Chan25 pointed out that 29% of the residues of the simplest sequence studied by Baker23 do not belong to the simplified IKEAG alphabet (there were, in fact, 14 amino acid types present in the sequence when all residue positions were counted). Later work by Wang26, 27 indicated that the minimum number of amino acid types required for a protein to encode its structure might be as large as ten, which would be consistent with theoretical work by Levy28 and Dill.29 For highly symmetric structures, at least for small proteins, the minimum required number of letters might be lower.30
In this study, we use AWSEM to study the effect of simplifying sequences of three designed proteins – Top7, TakadaZ, and TakadaE – as well as the effect of simplification on the behavior of two natural controls: S6 and TakadaN. For the purposes of simplification, we have employed the five-letter Miyazawa-Jernigan matrix scheme (MJ5),24 and the two-letter Blosum scoring scheme (BL2).27
APPROACHES
Systems investigated
Top7, the first protein to be designed to fold into a novel topology, has 92 residues and contains two α-helices packed on a five strand β-sheet with all anti-parallel strand pairings (see Figure 1a). The design process, which focused entirely on minimizing the free energy of the folded monomeric structure, did neither include explicit negative design against possible alternative conformations nor consider the kinetic process of protein folding. Top7 is unusually stable compared to natural proteins, and exhibits complex, multi-phase kinetics in its folding,13, 14 arising from the presence of several metastable intermediates. One intermediate state was found in simulation study to be more stable than either the folded or the unfolded states.15 Ribosomal protein S6 (PDB: 1RIS) was used as a comparison control system for Top7. S6 was chosen because of its similarity in length and secondary structure element composition to Top7 (Figure 1b), and also because it exhibits relatively simple, two-state kinetics as is quite common for natural proteins.31
Figure 1.

The crystal structures of Top7 (a) and S6 (b), and the truncated and relaxed 1PRB structure, denoted TakadaN (c). Coloring of the structures is according to residue index starting at the N-terminal (blue) and going to the C-terminal (red). Structures were generated using PyMOL.32
We have also studied two proteins designed by the Takada laboratory.11 These two sequences were designed to fold into the structure of the truncated protein G-related albumin binding domain (PDB: 1PRB), which has the first unstructured N-terminal 6 residues cut out. This protein has a three-helix bundle topology, shown in Figure 1c. The two Takada sequences were formed using different automated computational approaches: the first used a sophisticated Z-score based criterion to build a globally funneled landscape employing a rather good coarse-grained energy function, whereas the second focused only on optimizing interactions within the target structure. The Z-score design variant is denoted as TakadaZ (originally DHB06), and the sequence designed by minimizing the energy of the target structure alone is denoted as TakadaE (originally DHBE) in this paper. In our studies, the truncated protein G-related albumin binding domain, which was the structural template for the design, was used as the control system. We denote it as TakadaN. We performed a short annealing simulation with the “single memory” AWSEM (see Sec. 2B) at low temperature, starting from the truncated 1PRB, and used the final structure as the target structure for the calculation of Q values. The target structure deviates only slightly from the crystal structure, with a Cα RMSD of 2.4 Å that comes primarily from a tighter packing of the two terminal helices. This structure was also used for the Frustratometer analyses.
Models
Both the structure-based and predictive models are implemented in the LAMMPS molecular dynamics package.33 These models share a coarse-grained backbone description wherein the position and orientation of each amino acid residue are dictated by the positions of its Cα, Cβ, and O atoms (except Glycine, which lacks a Cβ atom). The model does not explicitly represent solvent molecules, so it is relatively rapid to simulate. Instead, the effects of solvent are modeled implicitly using the interaction terms in the Hamiltonian. This predictive model contains water-mediated interactions that go beyond the usual hydrophobicity dominated contact models.34 We believe it is likely that these interactions are somewhat more realistic than those employed to make the original designs, which were already quite good.
We employ a non-additive structure-based model to study the effect of topology on the landscapes of Top7, S6, and TakadaN. This model's Hamiltonian, shown in Eq. 1, contains a backbone term (Vbackbone) and a non-additive term (Vna), in which Ei is a pairwise-additive energy term and p is the non-additivity exponent as shown in Eq. 2. For this study, a value of p = 2.0 was used. Values of p in the range of 2.0–3.0 have been shown to produce protein-like levels of cooperativity when global and local folding events are considered.35, 36 Complete details of this model are available in Ref. 37:
| (1) |
| (2) |
AWSEM was used to predict the structures and to study the role of non-native contacts (energetic frustration) on the landscape and folding free energy profiles of the designed and natural proteins mentioned above. The complete AWSEM Hamiltonian is given in Eq. 3:
| (3) |
VFM is a bioinformatically based term, which depends on the fragment memories obtained from the alignment of 9-residue segments of the target sequence to a database of sequences corresponding to experimentally determined structures. Details of this model can be found in Ref. 38. A “single memory” model was also used for constructing free energy profiles so that effects of tertiary energy frustration alone could be quantified. In the “single memory” model, the fragments come directly from the experimentally determined structure (PDB) and the secondary structure bias is taken from the STRIDE39 assignment. In the “single memory” model, VFM, is based on an experimentally determined structure. All other parts of the model are fully transferable, including Vcontact, Vburial, and VHB. AWSEM with a “homologues excluded” fragment library, together with simulated annealing simulation was used for structure prediction. This “fragment memory” model uses the Protein Secondary Structure Prediction server JPRED prediction for its secondary structure bias.40 The alignments coming from locally similar but globally unrelated structures introduce the possibility of frustration at the level of secondary structures, but in all probability overestimates this effect.
Simulation and analysis methods
The Frustratometer7 has previously been used to measure and localize frustration in natural proteins by allowing us to computationally examine the changes in energy upon making mutations. The mutational frustration index, as described in Ref. 7, was used for all frustration calculations in this study. Roughly speaking, the mutational frustration index compares the stability of native interactions to a distribution of decoy interactions that are obtained by making mutations to the interacting residues themselves and the residues with which they are in contact. Frustration in general is the result of multiple competing interactions that cannot be simultaneously satisfied, and localizing frustration in the native structure of proteins can be useful in determining which parts of the protein are prone to local unfolding or misfolding. One way to represent localized frustration on a protein structure is to draw lines between residues in contact and color them according to their degree of frustration. In the resulting “frustratograms” (Figure 2), minimally frustrated contacts are shown in green and highly frustrated contacts are shown in red. For most natural proteins, minimally frustrated linkages constitute a connected stable folding core for the molecule. The fraction of minimally frustrated and highly frustrated contacts were also calculated and are given in Table 1. Top7 is mostly minimally frustrated. Its very few highly frustrated contacts are between polar residues on the outside of the β sheet. The native structure of S6 has a highly frustrated region between the C-terminal unstructured coil and the β sheet. The coil region between the first β strand and the first helix also makes highly frustrated contacts with the twisted region of the second and third β strands. All three Takada sequences have a large fraction of minimally frustrated interactions. Notably, similar to what was found for Top7, TakadaE has an unusually high fraction of minimally frustrated contacts, while the fraction of highly and minimally frustrated contacts for the natural protein TakadaN and the designed TakadaZ are nearly identical. The largest cluster of highly frustrated contacts in TakadaN coincides with the putative albumin binding site at the N-terminal.41 The frustratograms shown in Figure 2 and the frustration analysis in Table 1 were generated by the version of the Frustratometer that is implemented inside of AWSEM-MD, which is specifically designed to be consistent with the simulation Hamiltonian. Interactions within the range of fragment memory term VFM are therefore excluded. The Frustratometer web server42 includes these interactions.
Figure 2.

The frustratograms show calculated mutational frustration of Top7 (a), S6 (b), and TakadaN, TakadaZ, and TakadaE (c, d, and e, respectively). Minimally frustrated contacts are shown in green and highly frustrated contacts are shown in red. Figures were generated using Visual Molecular Dynamics (VMD).43
Table 1.
Summary of the mutational frustration analysis for all sequence/structure pairs studied. The columns show the fraction of minimally, highly, and neutrally frustrated interactions present in the native structure (or putative native structure in the case of TakadaZ and TakadaE).
| Minimally | Highly | Neutrally | ||
|---|---|---|---|---|
| S6 | FULL | 0.41 | 0.13 | 0.45 |
| MJ5 | 0.40 | 0.14 | 0.46 | |
| BL2 | 0.40 | 0.17 | 0.43 | |
| Top7 | FULL | 0.57 | 0.06 | 0.37 |
| MJ5 | 0.50 | 0.11 | 0.39 | |
| BL2 | 0.55 | 0.06 | 0.39 | |
| TakadaN | FULL | 0.49 | 0.06 | 0.45 |
| MJ5 | 0.48 | 0.08 | 0.44 | |
| BL2 | 0.44 | 0.00 | 0.56 | |
| TakadaZ | FULL | 0.49 | 0.05 | 0.46 |
| MJ5 | 0.55 | 0.07 | 0.38 | |
| BL2 | 0.50 | 0.00 | 0.49 | |
| TakadaE | FULL | 0.60 | 0.02 | 0.38 |
| MJ5 | 0.57 | 0.02 | 0.41 | |
| BL2 | 0.53 | 0.09 | 0.38 |
To survey the landscape of folding, we first employ simulated annealing simulations. These allow us to get an idea of how foldable a sequence is, and how robust the folding is to simplification of its sequence. These simulations were performed with a “homologues excluded” fragment library.38 To generate a starting structure, a simulation starting from the native structure that was obtained from the Protein Data Bank44 was first run at a high temperature (well above the folding temperature), resulting in a random extended conformation. Starting from these extended conformations and this high temperature, the temperature was slowly brought down to below the folding temperature over the course of 1 × 10⁷ steps, using a time step of 2 fs. Coordinates of the system were saved every 1000 steps. For each saved snapshot, Q and radius of gyration values relative to the native structure were calculated. Q is the fraction of pairwise distances within 1 Å of their distances in the native structure. The exact form of Q is given in Eq. 4:
| (4) |
Finally, structures were built from the last snapshot of each of these simulations, and the Cα RMSD was calculated for comparison to the experimentally determined structure in the cases of Top7 and S6, or the relaxed target structure in the cases of the three Takada sequences.
In order to sample along Q and calculate free energy profiles, we ran umbrella sampling simulations in which a harmonic bias (given in Eq. 5) was added to the Hamiltonian:
| (5) |
All free energy profiles and expectation values were calculated using the multi-state Bennett acceptance ratio (MBAR) method as implemented in the pyMBAR package.45 Samples were collected for a range of temperatures near the empirically determined folding temperature.
RESULTS
Top7 vs. S6
Since it has homogeneous interactions, the structure-based model allows us to evaluate the effects of topology alone on the folding of Top7. Figure 3 shows the two-dimensional free energy profiles of Top7 and S6 as a function of Q and radius of gyration computed using the non-additive structure-based model. There are two distinct low free energy regions, corresponding to the unfolded and folded states, in the free energy profiles of both Top7 and S6. Even for this single structure-based model corresponding to ideally funneled interactions, the free energy profile of Top7 is more complex than it is for the natural protein, S6, as reflected in the broad transition state region with multiple metastable states (Q values from 0.2 to 0.4). Structures at Top7's transition state have the C-terminal fragment preferentially formed, while the N-terminal fragment remains unfolded, whereas the narrower transition state region for S6 is more structurally homogeneous. The structure at the transition state of S6 has an overall correct topology, even though its secondary structures are incompletely formed. Compared to S6, which has two state folding kinetics in experiment,31 Top7 has intermediates with folded C-terminal fragments. These results are consistent with the previous simulation study15 as well as with experiments on Top7. These results strengthen the hypothesis that topological frustration plays a dominant role in the complex folding kinetics of Top7.
Figure 3.

Two-dimensional free energy profiles of S6 (a) and Top7 (b) computed using the non-additive structure-based model. The free energy profile of S6 is less complex with two distinct low free energy regions corresponding to the unfolded and folded states. Structure a1, a representative structure at the transition state of S6, has an overall correct topology, though its secondary structures are incompletely formed. The free energy profile of Top7 is more complex, with multiple metastable states near the transition state. Structures (b1 and b2) at Top7's transition state have the C-terminal fragment preferentially formed, while the N-terminal fragment remains unfolded.
The “single memory” model with transferable tertiary interactions was used to specifically study the role of tertiary energetic frustration on folding. The two-dimensional free energy profiles F(Q, rg) of S6 and Top7 (Figures 4a, 4b, respectively) are similar, though Top7 has a somewhat wider range of radii of gyration that are low in free energy. Both proteins still have an energetic bias towards native-like states as is shown in the F(Q, E) plots (Figures 4c, 4d, respectively) with a low free energy basin that extends from low Q and high energy to moderately high Q and low energy. Figure 5 shows the energy of the tertiary interactions as a function of Q for both Top7 and S6. The tertiary energy is defined as the sum of Vcontact and Vburial in Eq. 3. The tertiary energies of both proteins decrease as Q increases, and have approximately the same standard deviation, though Top7 has a slightly larger energy gap and is funneled to higher Q. The tertiary energy starts to flatten out at Q = 0.5 and Q = 0.7 for S6 and Top7, respectively.
Figure 4.

The two-dimensional free energy profile as a function of Q and the radius of gyration of S6 (a) and Top7 (b) are similar, though Top7 has a wider range of radii of gyration that are low in free energy. The two-dimensional free energy profile as a function of Q and energy of S6 (c) and Top7 (d) are also similar. All free energy profiles were calculated using the “single memory” model with transferable tertiary interactions.
Figure 5.

Plot of the tertiary energy term as a function of Q for Top7 (red line) and S6 (green dashed line). Standard deviation of the tertiary energy term (Δ Energy) is shown in the top right corner.
Next, we used AWSEM with fragment memories to quantify the combined roles of secondary and tertiary frustrations. Figure 8a shows the quality of structure prediction of Top7 and S6 over 20 simulated annealing runs. Top7 is better predicted, with overall better Q values than S6. The best predicted structure, with a Q value of 0.74 (Figure 6a), is the only well packed structure with the correct topology. Two of the energetically competitive structures are shown in Figure 6. We frequently observed swapping of the fourth and fifth β strands, an example of which is shown in Figure 6b. The structure in Figure 6c is a pseudo mirror image of the native structure, which also has an incorrect wiring of the first and third β strands. These structures are energetically competitive in our model because they are compact and retain a full complement of hydrogen bonds as well as a well formed hydrophobic core. Circular dichroism experiments in the Baker laboratory suggested that fragments consisting of helices and subsets of Top7's β strands, including some subsets in which none of the β strands participate in native pairings, are stable in solution. All of this is consistent with the observation of Baker et al.10, 12, 13, 23 and Watters et al.14 reiterated but unexplored by Chan, that Top7 might be prone to misfolding via mispairing of its β strands.
Figure 8.
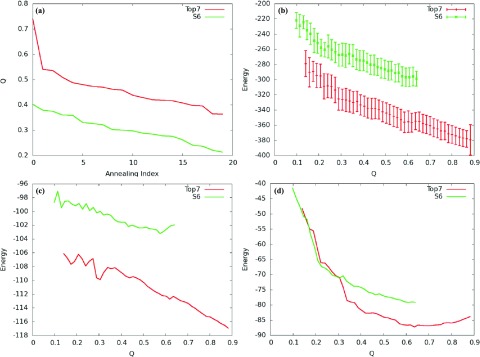
Final Q versus annealing index of Top7 and S6 structure prediction. Twenty independent simulated annealing simulations were conducted and their final Q values were plotted in the order of decreasing Q from left to right (a). Note that “annealing index” does not refer to the actual order in which the simulations were carried out. Plots of the expectation value of the total energy and its standard deviation (b), fragment memory energy (c), and tertiary energy (d) of Top7 and S6. Top7 is shown in red. S6 is shown in green.
Figure 6.

Top7: plot of predicted structures as a function of Q and energy. The crystal structure of Top7 is shown in the rectangle. (a) is a predicted structure of Top7, which is in good agreement with the Top7 x-ray crystal structure, with a Q = 0.74 and a RMSD = 2.09 Å. (b) and (c) are competitive low energy predicted structures of Top7 that have lower Q values, Q = 0.51, RMSD = 10.09 Å and Q = 0.40, RMSD = 9.46 Å, respectively. These structures have all of their secondary structures formed but have incorrect wirings of the β strands.
The quality of S6's structure prediction is low in comparison to most natural proteins we have studied previously;38 19 out of 20 predicted structures have a Q value below 0.4 (Figure 7). Predicted structures of S6 have an extra helix in place of the second β strand as seen in two representative structures in Figures 7a, 7b. Figure 7c shows a representative structure taken from an umbrella sampling simulation with a bias centered at Q = 0.60 using fragment memory AWSEM. This structure has overall correct topology, but its second β strand still has some helical character. This helical formation in predicted structures of S6 is apparently due to a discrepancy between JPRED's secondary structure prediction (which influences AWSEM's Ramachandran potential and β hydrogen bonding term) and S6's actual secondary structure. As shown in Table 2, the secondary structure prediction of JPRED assigned the second β strand region to be coil.
Figure 7.

S6: plot of predicted structures as a function of Q and energy. The crystal structure of S6 is shown in the rectangle. (a) is a predicted structure of S6 which has Q = 0.40 and a RMSD = 9.18 Å. (b) is a predicted structure which has the lowest energy with Q = 0.33, RMSD = 9.91 Å. (c) shows a representative structure taken from an umbrella sampling simulation with a bias centered at Q = 0.6.
Table 2.
Sequences and secondary structure information. Beneath each sequence, its respective JPRED secondary structure prediction is given. “H,” “E,” and “-” correspond to α-helix, β-strand, and coil, respectively. The STRIDE assignment was converted into this representation by mapping all “AlphaHelix” assignments to “H” and all “Strand” assignments to “E.” All other types of STRIDE assignments were mapped to “-.”
| Top7 | |
| STRIDE | -EEEEEEEE----EEEEEEEE---HHHHHHHHHHHHHHHH---EEEEEEE---HHHHHHHHHHHHHHHHHHH---EEEEEEE--EEEEEEE- |
| FULL | DIQVQVNIDDNGKNFDYTYTVTTESELQKVLNELMDYIKKQGAKRVRISITARTKKEAEKFAAILIKVFAELGYNDINVTFDGDTVTVEGQL |
| --EEEEEE--------EEEEEE--HHHHHHHHHHHHHHHH----EEEEEEE---HHHHHHHHHHHHHHHHH-----EEEEE---EEEEE--- | |
| MJ5 | EIKIKIKIEEKGKKIEIAIAIAAEKEIKKIIKEIIEIIKKKGAKKIKIKIAAKAKKEAEKIAAIIIKIIAEIGIKEIKIAIEGEAIAIEGKI |
| --EEEEEE-----EEEEEEEEE-HHHHHHHHHHHHHHHHH----EEEEEEE--HHHHHHHHHHHHHHHHHHH---EEEEEE---EEEEE--- | |
| BL2 | SISISISISSSSSSISISISISSSSSISSIISSIISIISSSSSSSISISISSSSSSSSSSISSIIISIISSISISSISISISSSSISISSSI |
| -EEEEEEEE-----EEEEEEEE----HHHHHHHHHHEEE------EEEEEEE--------HHHHHHHHHH--EEEEEEEEEE---EEE---- | |
| S6 | |
| STRIDE | -EEEEEEEEE-----HHHHHHHHHHHHHHHHHH--EEEEEEEEEEEEEEEEE--EEEEEEEEEEEEE----HHHHHHHHH----EEEEEEEE----- |
| FULL | MRRYEVNIVLNPNLDQSQLALEKEIIQRALENYGARVEKVEELGLRRLAYPIAKDPQGYFLWYQVEMPEDRVNDLARELRIRDNVRRVMVVKSQEPF |
| ----EEEEEE-----HHHHHHHHHHHHHHHHH---EEEEE-----------------EEEEEEEEE----HHHHHHHHH-----EEEEEEEEE---- | |
| MJ5 | IKKIEIKIIIKGKIEKKKIAIEKEIIKKAIEKIGAKIEKIEEIGIKKIAIGIAKEGKGIIIIIKIEIGEEKIKEIAKEIKIKEKIKKIIIIKKKEGI |
| ----EEEEEE-----HHHHHHHHHHHHHHHHH---EEEEE-----------------EEEEEEEEE---HHHHHHHHHH-----EEEEEEEEE---- | |
| BL2 | ISSISISIIISSSISSSSISISSSIISSSISSISSSISSISSISISSISISISSSSSSIIIIISISISSSSISSISSSISISSSISSIIIISSSSSI |
| ---EEEEEEEE------EEEEEEHHHH-HHHHH-----EEEEEEEEEEEEEEE-----EEEEEEEEE----EEEEE-EEEEE---HEEEEEE----- | |
| TakadaN | |
| STRIDE | --HHHHHHHHHHH------HHHHHHHHH---HHHHHHHHHHHH---- |
| FULL | LKNAKEDAIAELKKAGITSDFYFNAINKAKTVEEVNALKNEILKAHA |
| --HHHHHHHHHHHH----HHHHHHHH-----HHHHHHHHHHHHH--- | |
| MJ5 | IKKAKEEAIAEIKKAGIAKEIIIKAIKKAKAIEEIKAIKKEIIKAAA |
| --HHHHHHHHHHHH----HHHHHHHHH----HHHHHHHHHHHHHH-- | |
| BL2 | ISSSSSSSISSISSSSISSSIIISSISSSSSISSISSISSSIISSSS |
| --------EEEE-------EEEEEEE-----EEEEEEE--------- | |
| TakadaZ | |
| STRIDE | --HHHHHHHHHHH------HHHHHHHHH---HHHHHHHHHHHH---- |
| FULL | RGNDAKKAAARWKDRKFKFKAFIHRMDSFGAITEIHKAASAYAKKFG |
| ----HHHHHHHH----HHHHHHHHH------HHHHHHHHHHH----- | |
| MJ5 | KGKEAKKAAAKIKEKKIKIKAIIAKIEKIGAIAEIAKAAKAIAKKIG |
| ----HHHHHHHHHH-HHHHHHHHHHHHHHHHHHHHHHHHHHHHH--- | |
| BL2 | SSSSSSSSSSSISSSSISISSIISSISSISSISSISSSSSSISSSIS |
| -----------EE--EEEHHHHHHHH-----EEEE------------ | |
| TakadaE | |
| STRIDE | --HHHHHHHHHHH------HHHHHHHHH---HHHHHHHHHHHH---- |
| FULL | AYKFAETFFEQWKKFGWQIKYFLEYMRRAGGAKKFYEMIRRWIKEGW |
| --HHHHHHHHHHHHH--HHHHHHHHHHH-----HHHHHHHHHHH--- | |
| MJ5 | AIKIAEAIIEKIKKIGIKIKIIIEIIKKAGGAKKIIEIIKKIIKEGI |
| --HHHHHHHHHHHHHEEEEEEHHHHHHH----HHHHHHHHHHHH--- | |
| BL2 | SISISSSIISSISSISISISIIISIISSSSSSSSIISIISSIISSSI |
| -----HHHHHHHHHHHHHHHHHHEEEE------HHHHHHHHHHH--- |
Both Top7 and S6 have energetic biases toward native-like states in the fragment memory AWSEM, as seen in the calculations of expectation values of the total, fragment memory, and tertiary energy terms (Figures 8b, 8c, 8d, respectively). The formation of highly native-like states is somewhat disfavored in S6 due to the aforementioned non-native helix formation induced by the (incorrect) assumed secondary structure bias. Top7 has a large energy gap in both the tertiary and fragment memory energy terms. According to analysis using the frustratometer, Top7 has a higher fraction of minimally frustrated contacts and lower fraction of highly frustrated contacts than S6 (Table 1), consistent with Top7's unnaturally large hydrophobic core.
TakadaN vs. TakadaZ vs. TakadaE
Figure 9a shows the two-dimensional free energy profile for TakadaN as a function of Q and the radius of gyration obtained using the structure-based model. Since the structures of TakadaN and the designs are essentially the same, these results would also apply to these systems. The unfolded and folded states are shown as two low free energy regions separated by a well defined transition state, indicating that the target structure is not topologically frustrated.
Figure 9.

The two-dimensional free energy profile of TakadaN as a function of Q and the radius of gyration (a) was computed by using the non-additive structure-based model. The two-dimensional free energy profiles of TakadaN (b), TakadaE (c), and TakadaZ (d) were computed by using the “single memory” model. All free energy profiles were calculated at the same temperature.
To see the effects of tertiary energetic frustration which might distinguish the artificial designs from the natural protein, the free energy profile as a function of Q and energy was also calculated using the “single memory” AWSEM for the three Takada sequences at the same temperature and are shown in Figures 9b, 9c, 9d. Free energy profiles of TakadaZ and TakadaE (Figures 9c, 9d) are more complex than the free energy profile of TakadaN. The free energy profile of TakadaN (Figure 9b) is funneled to a Q value of 0.75, which is the highest Q value among the three sequences having a common structure, which is consistent with it being the sequence that was used to obtain the relaxed structure. The tertiary energy as a function of Q is shown in Figure 10. TakadaE has a larger energy gap than both TakadaN and TakadaZ, and its energetic variance is also the largest among the three sequences. For the AWSEM energy function, TakadaZ has a variance comparable to the variance of TakadaN, though its energy gap is slightly smaller. The natural protein, TakadaN, has its energy funneled smoothly to a high Q value, and a small variance.
Figure 10.

Plot of the tertiary energy as a function of Q for TakadaN (red line), TakadaZ (green dashed line), and TakadaE (blue dotted-dashed line). Standard deviation of the tertiary energy (Δ Energy) is shown in the top right corner.
Next, predictions were performed with fragment memory AWSEM. TakadaN has the best predicted structures found by simulated annealing as shown in Figure 11a. Expectation values of the total, fragment memory, and tertiary energy terms are calculated and plotted as shown in Figures 11b, 11c, 11d. The thermal average of the total energy of all three Takada sequences is well funneled. The energy gap of TakadaE is comparable to TakadaN and is larger than the energy gap of TakadaZ, while the variance in the energies is similar for all three constructs. This explains why TakadaE is better predicted than TakadaZ with AWSEM. Thus, while the Z-score was optimized in the original design with the original energy function, the Z-score is not so highly optimized when the AWSEM potential is used. JPRED's secondary structure prediction for the TakadaE sequence is also more similar to that of TakadaN's sequence than is TakadaZ's (as shown in Table 2), indicating that its secondary structure propensities match the target structure more closely. Figure 12 shows the plots of final simulated structures as a function of Q and energy. TakadaZ and TakadaE have predicted structures that are scattered over a larger range of Q and energy. TakadaN has less scattered predicted structures, with 13/20 structures clustered at high Q and low energy. For each of these plots, a predicted structure which has the highest Q value and a predicted structure which has the lowest energy are shown. In all cases, the lowest energy structures (as well as the highest Q structures) correspond to a correctly predicted overall fold; deviations come mostly in the form of partially formed secondary structures and differences in the details of helix-helix packing.
Figure 11.
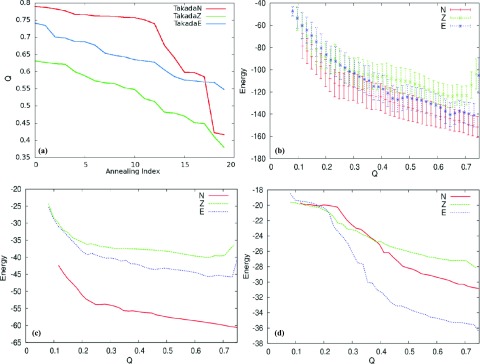
Plot of Q versus annealing index of the three Takada sequences (a). Plots of the expectation value of the total energy (b), the fragment memory energy (c), and the tertiary energy (d). TakadaN is shown in red, Takada Z is shown in green, and TakadaE is shown in blue.
Figure 12.

Plots indicating where the final simulated annealed structures lie as a function Q and energy for TakadaZ (a), TakadaE (b), and TakadaN (c). Predicted structures are shown on the right alongside a view of the target structure that has been rotated in order to highlight the differences. In all cases, the lowest energy structures (as well as the highest Q structures) correspond to a correctly predicted overall fold; deviations come mostly in the form of partially formed secondary structures and differences in the details of helix-helix packing.
How robust is folding to sequence simplification?
Figure 13 shows the quality of structure prediction of the five proteins using various simplification schemes as compared to the structure prediction performed by simulated annealing on the full sequence. The exact sequences used and their corresponding JPRED secondary structure predictions are given in Table 2. In all five cases, simplifying the sequences using only two amino acid types results in predicted structures with uniformly lower Q values when compared to the predictions using the full encoding or the five-letter sequence codes. The simplified sequence using the five-letter Miyazawa-Jernigan matrix scheme yields structure predictions comparable in quality to those for the full sequence in the case of S6 and TakadaE (Figures 13a, 13b, respectively). TakadaZ is actually better predicted when its sequence is reduced to five letters (Figure 13c). The quality of structure prediction is slightly reduced when the sequence is reduced to five-letter level in the case of Top7, and is significantly reduced in the case of the natural protein TakadaN (Figures 13d, 13e, respectively).
Figure 13.

Q versus annealing index is plotted with decreasing Q from left to right, summarizing the quality of structure prediction upon simplification of the sequences: S6 (a), TakadaE (b), Top7 (c), TakadaZ (d), and TakadaN (e). The full sequence is shown in red, the five-letter (MJ5) simplified sequence is shown in green, and the two-letter (BL2) simplified sequence is shown in blue.
It is typical for proteins to have ≈40% minimally frustrated contacts and 10% highly frustrated contacts (by the “mutational” measure).7 These statistics are consistent with the frustration patterns of the full sequence of S6 (41% minimally frustrated contacts/13% highly frustrated contacts), while the full sequence of Top7 yields a structure with larger fraction of minimally frustrated contacts and fewer highly frustrated contacts (57% and 6%, respectively) than is normal for natural proteins; see Table 1. The fraction of tertiary interactions that are minimally frustrated remains high and the fraction of highly frustrated interactions remains low for Top7 and S6 when the five-letter simplified encoding is employed. The fraction of highly frustrated contacts in Top7 increases from 5% to 10%, contributing to a decrease in the quality of predicted structures when its sequences are simplified using the MJ5 scheme. There is no significant change in the frustration signals of S6 at the level of MJ5 simplification, which results in a comparable quality of structure prediction. TakadaE and TakadaN also show little change in the tertiary frustration signals when they are reduced to the MJ5 code, whereas TakadaZ actually has an increase in the fraction of minimally frustrated contacts.
The local structure frustration can also be important in determining the quality of structure prediction, as is illustrated in the case of TakadaN. The expectation value of the total energy for its MJ5 simplified sequence has a local minimum along Q around Q = 0.4 and a global minimum at much higher Q (Figure 14). The origin of this trap can be seen in the expectation value of the fragment memory energy term, which has a wide global minimum between Q = 0.25 and Q = 0.4, indicating the presence of competing non-native secondary structures. This makes it difficult for the reduced sequence to fold into the native structure; indeed, only 5/20 fixed-length simulated annealing simulations were able to reach the correct overall fold.
Figure 14.
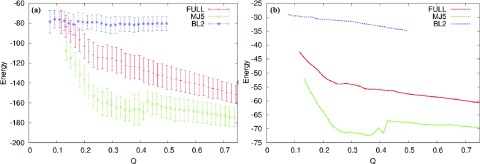
Plots of the expectation value of the total energy (a) and fragment memory energy (b) of TakadaN at different levels of simplification. The full sequence is shown in red, the five-letter (MJ5) simplification is shown in green, and the two-letter (BL2) simplification is shown in blue.
DISCUSSION
Our study of Top7 indicates that Top7 has a good thermodynamic design as reflected in the local frustration and correct structure prediction. Nevertheless, the non-natural topology of Top7 by itself leads to multiple intermediates that are found using a non-additive structure-based model. These intermediates have folded C-terminal fragments, while the N-terminal fragment remains disordered. These results are consistent with previous experimental13, 14 and simulation15 studies.
The role of energetic frustration in the folding of Top7 was also examined by using both “single memory” and fragment memory versions of AWSEM. The average contact energy in the “single memory” model, and the average fragment memory, tertiary, and total energies in the fragment memory model all decrease up to high values of Q. However, we find in our simulated annealing simulations several non-native structures that are energetically competitive with the best predicted structure. Although the average energy appears to be well funneled in umbrella sampled data, the existence of these low-energy non-native structures in the simulated annealing simulations indicates kinetic complications with Top7 in our model. Furthermore, the predicted non-native structures are characterized by non-native β strand pairing. Baker and colleagues10, 12, 13, 23 and Watters et al.14 suggest that canonical nature of four of the five β strands may be conducive to strand swapping. Also, the middle and slow phases observed in the Chevron plot of Top7 are reported to correspond to states in which no additional surface area is buried, but rather structural rearrangements between collapsed states.14 The predicted non-native states of Top7 in our model are consistent with both of these ideas. The Z-score of Top7 according to AWSEM looks as though it should be sufficient to exclude possible alternative conformations by chance in the approximation that the molten globule is largely unstructured. Nevertheless, the highly regular and symmetric structure of Top7 apparently allows a small number of discrete competitor states to be significantly populated in solution. The simulated annealing results of AWSEM suggest these are a few structures that are competitive at a coarse-grained level that were not excluded by the elements of heuristic design that were employed to constrain the optimization of the Top7 sequence. These specific competitor structures in the coarse-grained simulations may have energetic packing issues when considered in full atomistic detail.
The truncated natural template of Takada's two designed sequences, TakadaN, has a funneled energy landscape and was found to have the highest quality of structure prediction using AWSEM. Unlike the nicely funneled energy profile for TakadaN using AWSEM, TakadaE and TakadaZ have complex features in their free energy profiles and there is scattered clustering of predicted structures from the simulated annealing runs. TakadaE is slightly better predicted than TakadaZ is, likely because of its larger energy gap and similar energetic variance using the fragment memory predictive model.
We have attempted to assess to what extent funneling and frustration in the energy landscape are changed by simplifying the sequences to five (MJ5) and to only two (BL2) amino acid types. Simplified sequences using the five-letter Miyazawa-Jernigan matrix scheme produce predicted structures with comparable quality to predicted structures using the full sequences, except in the case of TakadaN, which when simplified now has an energetic trap at around Q = 0.4 as a result of competing secondary structures. With the exception of TakadaZ, predictions of full sequences are of better quality than their corresponding MJ5 simplified sequence. This result is consistent with the Frustratometer analysis described previously.
Simplifying to a two-letter scheme generally gives lower quality results, as expected from the arguments laid out earlier in this work. These poorer results are partially the result of the sensitivity of the AWSEM to the input JPRED secondary structure predictions, which influence both the Ramachandran potential and β hydrogen bonding terms of the AWSEM potential. JPRED predictions for simplified sequences using the MJ5 mapping agree for the most part with those of the full sequences, consistent with the structure prediction results described previously. With the exceptions of TakadaE and Top7, the JPRED predictions for simplified sequences using the BL2 mapping are drastically different from the JPRED predictions based on the full sequence. Incorrect assignment of residues, as being β is the most common anomaly, often resulting in deformed secondary structure in poorly predicted structures (structures not shown). JPRED predictions of BL2 simplified sequences for Top7 and TakadaE are notably more similar to those of the full sequence. Many of the predicted structures of the Top7 BL2 sequence have correctly formed secondary structure. Nevertheless, incorrect pairing of β strands is still frequently observed. This is expected as the energetic heterogeneity of the full sequence that potentially encodes the specificity of pairing has been completely lost in simplification.
Our results suggest that a five-letter code may contain sufficient information for structure prediction of de novo designed sequences but may not be sufficient for natural proteins. TakadaN showed the most dramatic change in prediction quality upon MJ5 simplification, due to local sequence frustration. It remains unclear how many flavors of amino acids are required to fold simplified sequences of natural proteins with as much accuracy as their native sequence. In contrast to some natural proteins, the three designed proteins examined in this work can be folded using a smaller number of amino acid types. Evolution has tuned natural sequences over millions of years to both fold and function. Though de novo designed sequences are indeed proving to be intelligently designed, being able to fold into stable structures, they also seem to be less sensitive to simplification, perhaps implying that they are relying on less subtle signals than natural proteins.
ACKNOWLEDGMENTS
We are grateful to Diego Ferreiro and Joachim Lätzer, who carried out preliminary calculations on Top7 several years ago, spearheading this more complete investigation. The project described was supported by Grant No. R01 GM44557 from the National Institute of General Medical Sciences. The content is solely the responsibility of the authors and does not necessarily represent the official views of National Institute of General Medical Sciences or the National Institutes of Health. Additional support was also provided by the D. R. Bullard-Welch Chair at Rice University. This work was also supported in part by the Data Analysis and Visualization Cyberinfrastructure funded by National Science Foundation (NSF) under Grant No. OCI-0959097 and the Shared University Grid at Rice funded by NSF under Grant No. EIA-0216467, and a partnership between Rice University, Sun Microsystems, and Sigma Solutions, Inc.
References
- Bryngelson J. D. and Wolynes P. G., Proc. Natl. Acad. Sci. U.S.A. 84, 7524 (1987). 10.1073/pnas.84.21.7524 [DOI] [PMC free article] [PubMed] [Google Scholar]
- Bryngelson J. D., Onuchic J. N., Socci N. D., and Wolynes P. G., Proteins 21, 167 (1995). 10.1002/prot.340210302 [DOI] [PubMed] [Google Scholar]
- Onuchic J. N., Luthey-Schulten Z., and Wolynes P. G., Annu. Rev. Phys. Chem. 48, 545 (1997). 10.1146/annurev.physchem.48.1.545 [DOI] [PubMed] [Google Scholar]
- Wolynes P. G., Philos. Trans. R. Soc. London, Ser. A 363, 453 (2005). 10.1098/rsta.2004.1502 [DOI] [PubMed] [Google Scholar]
- Onuchic J. N. and Wolynes P. G., Curr. Opin. Struct. Biol. 14, 70 (2004). 10.1016/j.sbi.2004.01.009 [DOI] [PubMed] [Google Scholar]
- Oliveberg M. and Wolynes P. G., Q. Rev. Biophys. 38, 245 (2005). 10.1017/S0033583506004185 [DOI] [PubMed] [Google Scholar]
- Ferreiro D. U., Hegler J. A., Komives E. A., and Wolynes P. G., Proc. Natl. Acad. Sci. U.S.A. 104, 19819 (2007). 10.1073/pnas.0709915104 [DOI] [PMC free article] [PubMed] [Google Scholar]
- Ferreiro D. U., Hegler J. A., Komives E. A., and Wolynes P. G., Proc. Natl. Acad. Sci. U.S.A. 108, 3499 (2011). 10.1073/pnas.1018980108 [DOI] [PMC free article] [PubMed] [Google Scholar]
- Miyashita O., Onuchic J. N., and Wolynes P. G., Proc. Natl. Acad. Sci. U.S.A. 100, 12570 (2003). 10.1073/pnas.2135471100 [DOI] [PMC free article] [PubMed] [Google Scholar]
- Kuhlman B., Dantas G., Ireton G. C., Varani G., Stoddard B. L., and Baker D., Science 302, 1364 (2003). 10.1126/science.1089427 [DOI] [PubMed] [Google Scholar]
- Jin W., Kambara O., Sasakawa H., Tamura A., and Takada S., Structure 11, 581 (2003). 10.1016/S0969-2126(03)00075-3 [DOI] [PubMed] [Google Scholar]
- Koga N., Tatsumi-Koga R., Liu G., Xiao R., Acton T. B., Montelione G. T., and Baker D., Nature 491, 222 (2012). 10.1038/nature11600 [DOI] [PMC free article] [PubMed] [Google Scholar]
- Scalley-Kim M. and Baker D., J. Mol. Biol. 338, 573 (2004). 10.1016/j.jmb.2004.02.055 [DOI] [PubMed] [Google Scholar]
- Watters A. L., Deka P., Corrent C., Callender D., Varani G., Sosnick T., and Baker D., Cell 128, 613 (2007). 10.1016/j.cell.2006.12.042 [DOI] [PubMed] [Google Scholar]
- Zhang Z. and Chan H. S., Biophys. J. 96, L25 (2009). 10.1016/j.bpj.2008.11.004 [DOI] [PMC free article] [PubMed] [Google Scholar]
- Zhang Z. and Chan H. S., Proc. Natl. Acad. Sci. U.S.A. 107, 2920 (2010). 10.1073/pnas.0911844107 [DOI] [PMC free article] [PubMed] [Google Scholar]
- Fujitsuka Y., Takada S., Luthey-Schulten Z. A., and Wolynes P. G., Proteins: Struct., Funct., Bioinf. 54, 88 (2004). 10.1002/prot.10429 [DOI] [PubMed] [Google Scholar]
- Kuroda Y. and Kim P. S., J. Mol. Biol. 298, 493 (2000). 10.1006/jmbi.2000.3622 [DOI] [PubMed] [Google Scholar]
- Islam M. M., Sohya S., Noguchi K., Yohda M., and Kuroda Y., Proc. Natl. Acad. Sci. U.S.A. 105, 15334 (2008). 10.1073/pnas.0802699105 [DOI] [PMC free article] [PubMed] [Google Scholar]
- Yue K., Fiebig K. M., Thomas P. D., Chan H. S., Shakhnovich E. I., and Dill K. A., Proc. Natl. Acad. Sci. U.S.A. 92, 325 (1995). 10.1073/pnas.92.1.325 [DOI] [PMC free article] [PubMed] [Google Scholar]
- Wolynes P. G., Nat. Struct. Mol. Biol. 4, 871 (1997). 10.1038/nsb1197-871 [DOI] [PubMed] [Google Scholar]
- Davidson A. R., Lumb K. J., and Sauer R. T., Nat. Struct. Biol. 2, 856 (1995). 10.1038/nsb1095-856 [DOI] [PubMed] [Google Scholar]
- Riddle D. S., Santiago J. V., Bray-Hall S. T., Doshi N., Grantcharova V. P., Yi Q., and Baker D., Nat. Struct. Biol. 4, 805 (1997). 10.1038/nsb1097-805 [DOI] [PubMed] [Google Scholar]
- Wang J. and Wang W., Nat. Struct. Mol. Biol. 6, 1033 (1999). 10.1038/14918 [DOI] [Google Scholar]
- Chan H. S., Nat. Struct. Biol. 6, 994 (1999). 10.1038/14876 [DOI] [PubMed] [Google Scholar]
- Fan K. and Wang W., J. Mol. Biol. 328, 921 (2003). 10.1016/S0022-2836(03)00324-3 [DOI] [PubMed] [Google Scholar]
- Li T., Fan K., Wang J., and Wang W., Protein Eng. 16, 323 (2003). 10.1093/protein/gzg044 [DOI] [PubMed] [Google Scholar]
- Murphy L. R., Wallqvist A., and Levy R. M., Protein Eng. 13, 149 (2000). 10.1093/protein/13.3.149 [DOI] [PubMed] [Google Scholar]
- Thomas P. D. and Dill K. A., Proc. Natl. Acad. Sci. U.S.A. 93, 11628 (1996). 10.1073/pnas.93.21.11628 [DOI] [PMC free article] [PubMed] [Google Scholar]
- Wolynes P. G., Proc. Natl. Acad. Sci. U.S.A. 93, 14249 (1996). 10.1073/pnas.93.25.14249 [DOI] [PMC free article] [PubMed] [Google Scholar]
- Haglund E., Lindberg M. O., and Oliveberg M., J. Biol. Chem. 283, 27904 (2008). 10.1074/jbc.M801776200 [DOI] [PubMed] [Google Scholar]
- DeLano W. L., The PyMOL Molecular Graphics System, DeLano Scientific, San Carlos, CA, USA, 2002; see http://www.pymol.org.
- Plimpton S., J. Comp. Phys. 117, 1 (1995). 10.1006/jcph.1995.1039 [DOI] [Google Scholar]
- Papoian G. A., Ulander J., and Wolynes P. G., J. Am. Chem. Soc. 125, 9170 (2003). 10.1021/ja034729u [DOI] [PubMed] [Google Scholar]
- Craig P. O., Lätzer J., Weinkam P., Hoffman R. M., Ferreiro D. U., Komives E. A., and Wolynes P. G., J. Am. Chem. Soc. 133, 17463 (2011). 10.1021/ja207506z [DOI] [PMC free article] [PubMed] [Google Scholar]
- Schafer N. P., Hoffman R. M., Burger A., Craig P. O., Komives E. A., and Wolynes P. G., PloS ONE 7, e50635 (2012). 10.1371/journal.pone.0050635 [DOI] [PMC free article] [PubMed] [Google Scholar]
- Eastwood M. P. and Wolynes P. G., J. Chem. Phys. 114, 4702 (2001). 10.1063/1.1315994 [DOI] [Google Scholar]
- Davtyan A., Schafer N. P., Zheng W., Clementi C., Wolynes P. G., and Papoian G. A., J. Phys. Chem. B 116, 8494 (2012). 10.1021/jp212541y [DOI] [PMC free article] [PubMed] [Google Scholar]
- Heinig M. and Frishman D., Nucleic Acids Res. 32, W500 (2004). 10.1093/nar/gkh429 [DOI] [PMC free article] [PubMed] [Google Scholar]
- Cuff J. A., Clamp M. E., Siddiqui A. S., Finlay M., and Barton G. J., Bioinformatics 14, 892 (1998). 10.1093/bioinformatics/14.10.892 [DOI] [PubMed] [Google Scholar]
- Johansson M. U., de Château M., Wikström M., Forsén S., Drakenberg T., and Björck L., J. Mol. Biol. 266, 859 (1997). 10.1006/jmbi.1996.0856 [DOI] [PubMed] [Google Scholar]
- Jenik M., Parra R. G., Radusky L. G., Turjanski A., Wolynes P. G., and Ferreiro D. U., Nucleic Acids Res. 40, W348 (2012). 10.1093/nar/gks447 [DOI] [PMC free article] [PubMed] [Google Scholar]
- Humphrey W., Dalke A., and Schulten K., J. Mol. Graphics 14, 33 (1996). 10.1016/0263-7855(96)00018-5 [DOI] [PubMed] [Google Scholar]
- Berman H. M., Westbrook J., Feng Z., Gilliland G., Bhat T., Weissig H., Shindyalov I. N., and Bourne P. E., Nucleic Acids Res. 28, 235 (2000). 10.1093/nar/28.1.235 [DOI] [PMC free article] [PubMed] [Google Scholar]
- Shirts M. R. and Chodera J. D., J. Chem. Phys. 129, 124105 (2008). 10.1063/1.2978177 [DOI] [PMC free article] [PubMed] [Google Scholar]