Abstract
The accurate determination of the biological effects of low doses of pollutants is a major public health challenge. DNA microarrays are a powerful tool for investigating small intracellular changes. However, the inherent low reliability of this technique, the small number of replicates and the lack of suitable statistical methods for the analysis of such a large number of attributes (genes) impair accurate data interpretation. To overcome this problem, we combined results of two independent analysis methods (ANOVA and RELIEF). We applied this analysis protocol to compare gene expression patterns in Saccharomyces cerevisiae growing in the absence and continuous presence of varying low doses of radiation. Global distribution analysis highlights the importance of mitochondrial membrane functions in the response. We demonstrate that microarrays detect cellular changes induced by irradiation at doses that are 1000-fold lower than the minimal dose associated with mutagenic effects.
INTRODUCTION
Estimation of health risks associated to low doses of genotoxic components in the environment is a public health challenge. For example, the assessment of a ‘safety limit’ on exposure to ionizing radiation is the object to permanent debates for new environmental policies and laws. Actually, the possible effects of ionizing radiation capture the imagination of the public. The mining and processing of radioactive materials for use in medicine, power generation, consumer products and industry inevitably generate emissions and waste. Not only is there an ever-present danger of an accident, like the fire at Chernobyl Center 3, but the widespread use of nuclear power and the accumulation of nuclear waste raise questions concerning the possible harmful effects of low doses of radiation released by these sites. The threshold dose concept, designed to account for negative effects being observed only above a certain threshold dose, remains controversial. Now that complete genome sequences and methods for genome-wide analysis of the transcriptome, such as microarrays, are available, it is possible to study the gene expression pattern in response to changes in environment (1,2). Most studies of this type have been carried out with high doses of genotoxic agents or in drastically changed growth conditions such as glucose (3), oxygen (4) or amino acid (5) starvation. In this study, we monitored transcriptional changes induced in yeast populations growing in an environment with low level of radiation. We develop a new data analysis method, combining the results of two independent methods, to accurately detect small changes in the whole transcriptome. We demonstrate that microarray-based transcriptional analysis is a powerful tool to detect biological effects of environmental modifications.
MATERIALS AND METHODS
Strains and growth conditions
The diploid Saccharomyces cerevisiae strain D7 (trp5-12/trp5-27, ilv1-92/ilv1-92, ade2-40,119/ade2-40,119) was used in all experiments (6). Exponentially growing cells were used to inoculate standard rich glucose (YPD) medium at 30°C, to a density of 2 × 10⁴ cells/ml. Cells were cultured for 20 h, without shaking, in a thin layer of medium (4 mm) to facilitate oxygenation. The culture plate was placed on a layer of agarose containing various amounts of 32P, to reproduce a radioactive environment (β-rays, 1.71 MeV) with low dose rates. The dose rate emitted by the 32P radioactive layer was directly proportional to the isotope concentration since the thickness of the layer was larger (>1 cm) than the mean track length (0.79 cm in water) of the electrons. We estimate a correlation of 2 mGy/h per µCi/ml of 32P, taking into account an attenuation of 72% due to the distance of the cells from the radioactive surface (1.2 mm). Most of the electrons (99.4%) were absorbed by the cells and the media. After 20 h of culture, cells were observed under a microscope. They were counted and the frequency of budding cells was measured. For all the dose rates tested, the density of cells at the end of the culture period was 2–5 × 10⁷ cells/ml, with ∼30% budding cells. The frequency of recombinants and mutants was estimated as described by Zimmermann et al. (6) by measuring plating efficiency on solid minimal medium (YNB, Difco) supplemented with adenine and tryptophan (Ilv– mutants) or with all amino acids except tryptophan (Trp+ recombinants).
Microarray analysis
Microarray slides were made by Corning (23 microarrays) and Hitachi (10 microarrays), using patented techniques. Most of the ORFs of S.cerevisiae (6135 Corning; 5804 Hitachi) were represented on the microarrays. Total RNA was extracted from cells cultured in various conditions by the phenol and glass beads method. Fluorescently-labeled first-strand cDNA was synthesized by reverse transcription (2 h at 42°C) with the superscript II enzyme (Life Technology), with 20 µg of total RNA treated with DNase I (2.5 µg) and primed with 3.5 µg (dT)7 oligomer in the presence of Cy3-dUTP or Cy5-dUTP (Amersham) for the Corning microarrays and using indirect labeling kit (Fairplay™ Microarray Labeling, Stratagene) for the Hitachi microarrays. RNA was digested with 4 U of RNase H and 5 U of RNase A, at 37°C for 15 min. Labeled cDNA was separated from unbound fluorescence by filtration through a microfilter (Qiagen). The Cy3- and Cy5-labeled cDNAs were pooled, denatured and mixed with 40 µl of hybridization buffer [25% formamide (omitted for Hitachi microarrays), 5× SSC, 0.1% SDS], 0.66 µg/µl yeast tRNA and 0.66 µg/µl (dA)7. Mixtures were hybridized overnight in a Corning hybridization chamber, in a 42°C water bath. The slides were then removed from the chamber, washed for 5 min in 2× SSC, 0.1% SDS at 42°C, four times for 1 min each in 0.1× SSC, four times for 1 min each in 0.1× SSC, and then twice with water at room temperature. For all hybridizations, a Cy-3 fluorescently-labeled cDNA control population was prepared from the same pool of RNA extracted from five independent cultures in rich medium.
Hybridized microarrays were scanned using a Genepix 4000B machine (Axon Instruments). Separate images were acquired for each type of fluorescence, at a resolution of 10 µm per pixel. Images were analyzed with Genepix pro 3.0 (Axon), after manual rectification of the outline of each spot. The median values for both types of fluorescence were used for each spot. A quality control standard (QCS) was estimated, calculating the difference between the median pixel values within the spot (spot) and in the background (bkgrd), corrected with the square root of the sum of the standard deviations (stdev).

Data with non-significant QCS values for both types of fluorescence were considered to be missing.
Normalization for cDNA microarray data
Data from cDNA microarrays are influenced by many experimental parameters other than differential expression, resulting in systematic variations in the measured intensities. These parameters cannot easily be quantified by standard quantification methods. To compare measurements from different microarray experiments, the measured intensities must be normalized. The main assumption underlying normalization is that there is a functional coherence between a true biological difference and the corresponding measured values. The calculation of crude ratios of signal intensity in intensity-dependent dye normalization methods seems preferable to global methods such as mean or median normalization. We used the location and scale normalization procedures originally developed by Yang et al. (7). These methods correct for intensity and spatial dye biases, by use of a robust local regression. They use the Splus LOWESS function (Insightful) to perform robust local regression. We applied these methods to obtain a scaled within-print-group normalization to account for spatial dependence in dye biases, with scale adjustment between the blocks. To make this method more robust, we did not consider saturating points (with saturating fluorescence intensities) when estimating LOWESS fits. However, as these points contain relevant information, all measured intensities were normalized with the estimated LOWESS curves. The normalized data for each spot were defined as the estimation of the relative expression levels in experiments with irradiated populations (I values) and non-irradiated populations (NI values). Each set of normalized data corresponding to one microarray will be referred as an instance.
Statistical analysis
We used three global analysis methods to select the most differentially expressed genes, namely SAM (8), ANOVA (analysis of variance) (9,10) and RELIEF (11,12) standard versions of SAM and ANOVA were used in the experiments, whereas we optimized the RELIEF algorithm for high dimensional data. SAM and ANOVA are parametric methods that assume that the data for each class are normally distributed. (Note that we performed one ANOVA per gene.) They are based on the Student’s t-test and calculate the threshold at which the null hypothesis (13,14) (i.e. that the two groups of data are drawn from the same distribution) can be rejected. These methods measure a distance between two normal distributions estimated from the data. Strictly speaking, they only apply when the variances within each class are equal, which is questionable in our context. However, SAM partly corrects this by introducing an additional constant to the variance in the denominator of the formula for the relative difference in gene expression. In contrast, RELIEF is a non-parametric method that considers each instance as a point in the attribute space (here a 6135-dimensional space). RELIEF calculates, for each instance, the mean distance to its k-nearest neighbors in another class and the mean distance to its k-nearest neighbors in the same class. It compares these distances for a given gene (for a given instance) by considering the associated dimension (here the relative gene expression of this gene). RELIEF then calculates the weight of this gene by averaging across all instances. The weight of a gene is thus a function of the variation of its relative expression level within each class compared to the variation between classes. Indeed, the correlation between class and relative gene expression seems to be stronger if the intra-class variation is small compared to the extra-class variation. In a way, this weight measures the ability of one given gene to distinguish between classes. The parameter k controls the trade-off between sensitivity and robustness to noise (in our case, k = 3 was empirically determined to be the best choice).
To estimate the significance of the correlation measured by RELIEF between relative gene expression and class, we compared it to the correlation obtained when the classes are arbitrarily assigned to the instances. We labeled instances such that one class contained 12 experiments and the other one contained six experiments, in accordance with the original distribution. We repeated this procedure a thousand times to obtain the average number of genes with a correlation level greater than a given threshold. The same procedure was applied for ANOVA.
The data management was facilitated by the use of the ‘AMADEA’ software (Isoft Corp.). Promoter sequences were analyzed by use of the RSA tool (http://rsat.ulb.ac.be/rsat/). The transcription factors were identified in the SCPD database (http://cgsigma.cshl.org/jian/).
RESULTS
Experimental design
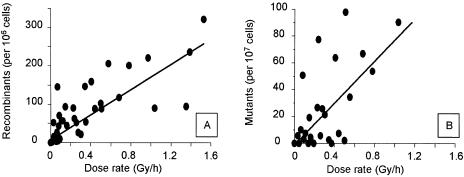
To generate a homogeneous and controlled low-level radiation environment, we used a layer containing a controlled amount of radionuclide as an emitter. Diploid S.cerevisiae cells were allowed to grow exponentially for 12 divisions (20 h) in the presence of various dose rates of radiation. None of the dose rates tested (<2 Gy/h) affected cell growth. Indeed, the number of living cells and the frequency of budding cells were similar in populations growing with and without irradiation. We first estimated the range of doses that induced genetic changes such as mutations or recombination events. As already observed with acute irradiation, the frequencies of recombination and mutation events increased with the dose rate (Fig. 1). However, we did not observe any mutagenic effects at dose rates below 100 mGy/h. We then investigated the possibility that lower doses could induce transcriptional changes that do not result in genetic modifications. For this purpose, we compared the expression profiles of six independent irradiated (I) cultures that were exposed to a dose rate of 15–20 mGy/h for 20 h with those of 12 independent cultures grown without radiation (not irradiated, NI). We used DNA microarrays to characterize the gene expression patterns in the two sets of cultures (I and NI). The same control cDNA mixture, prepared from a pool of independent cultures grown without irradiation, was used in all experiments. For each spot, we calculated the ratio of normalized quantitative values obtained for the two types of fluorescence. We combined results of two independent analysis methods to determine the maximal number of ‘informative’ genes corresponding to the best correlation between the two methods and the minimal level of ‘false positive’. The expression levels of these genes estimated by microarray analysis of populations exposed to various dose rates were used to determine the lower dose of irradiation inducing detectable transcriptional changes.
Figure 1.
Comparison of the frequencies of recombination (A) and mutation (B) events induced by continuous irradiation at different dose rates. The recombinant frequency and the mutation frequency were measured as described in Materials and Methods for each independent culture exposed for 20 h to the dose rate of radiation indicated in Abcissa.
Estimation of the ‘significance’ of the transcriptional changes in exposed populations
As massive amounts of data were generated, data analysis methods were required to determine whether changes in relative gene expression were significant. Unfortunately, unsupervised clustering (Hierarchical clustering; 15) of relative changes in gene expression did not cluster culture conditions according to treatment group (data not shown). Recently, Cheok et al. encountered a similar problem when trying to study the effects of a drug in human leukaemia cells (16). We thus used methods able to rank genes according to their ability to distinguish between our growth conditions. We used a standard ANOVA (17) and the recently advocated technique SAM (8). The two methods gave relatively similar results (see Supplementary Material Table S1). They calculate for each gene a quantile function of Fisher statistics with a high score corresponding to a significant difference in expression between I and NI samples. However, these standard statistical techniques relying on the t-test are based on assumptions that are not fully relevant to this context. Indeed, ANOVA and SAM assume that the data for relative gene expression across cultures follow a Gaussian distribution. Moreover, these techniques are sensitive to various types of noise that are frequent in microarray data. As they look at each gene in isolation, they may not pick up very important correlations between genes involved in the same or related biological processes. We therefore used a dedicated version of RELIEF (11), an attribute estimation technique that does not make any assumptions about the distribution or the independency of the genes. This method calculates the weight of a gene as a function of the variation of its relative expression level within each class compared to the variation between classes.
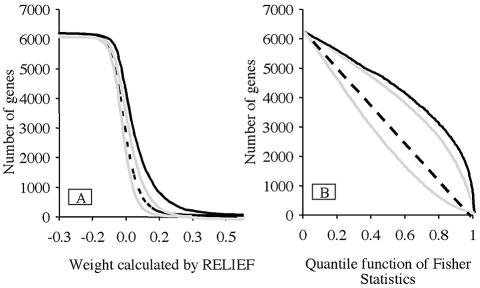
To determine the statistical significance of the biological effect of radiation, we measured the correlation between the relative expression level of each gene and the class, and we compared it to the null hypothesis (absence of correlation). If there is a true correlation between relative gene expression and class, then, for a given correlation level, more genes should appear to be correlated in experiments than in the null hypothesis conditions. Indeed, we observed a marked difference between the experimental and randomized curves. The experimental curves were out of the 95% confidence interval (Fig. 2) when analysis was performed using either RELIEF (Fig. 2A) or ANOVA (Fig. 2B). Our results strongly support the conclusion that gene expression profiles differ in irradiated populations and non-irradiated ones.
Figure 2.
Scatter plots of relative differences in gene expression. Scatter plot of the genes as a function of their weight calculated with the RELIEF (A) or their P value calculated with ANOVA (B) are represented for experimental data (black) or random distribution of the experiments (dotted line). High scores represent significant difference in gene expression between I and NI samples. The random distribution was obtained by 1000 experimental permutations of the experimental data. The gray lines indicate the 95% confidence intervals of the random distribution.
A new method of global analysis highlights the induction of mitochondrial processes
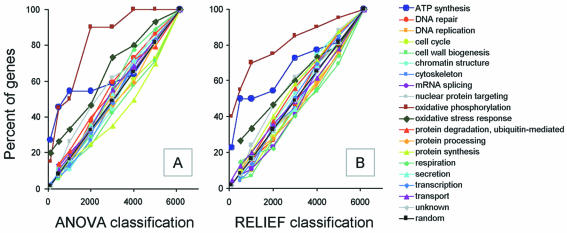
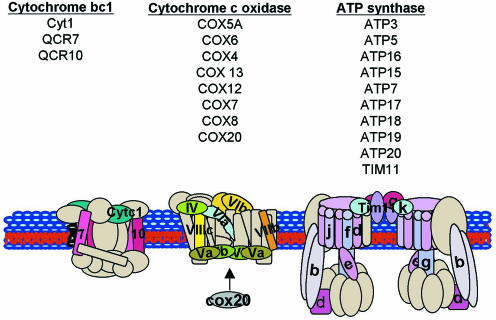
We designed a global graphic analysis method to identify the main processes affected by irradiation. The method was based on the assumption that if the induced response involves a biological process associated with the activity of a set of genes, then a large proportion of these genes should be found to be relevant in our ranking of gene significance. In other words, these correlated and relevant genes should appear more frequently at the highest ranks than should genes associated with unaffected biological processes, which should be uniformly distributed throughout the ranking. To identify the cellular processes that are most affected by irradiation, we therefore plotted, for both rankings (ANOVA and RELIEF), the frequency of genes belonging to a given biological process occurring within the n top ranked genes with various values of n, producing a so-called ‘distribution function’ (Fig. 3). Only processes involving more than 15 genes were considered. Most of the processes included involved genes that were randomly distributed throughout the ranking (only some are presented on Fig. 3). In contrast, with both rankings, three processes appeared to be clearly over-represented among the highest ranks: oxidative phosphorylation, ATP synthesis and oxidative stress (Fig. 4). These three processes all take place on the inner membrane of mitochondria and cooperate to produce ATP and to control the reactive oxygen intermediates produced during respiration and upon exposure to radiation. Thus, we demonstrate that a global analysis can be used to identify processes that are involved in the specific cellular response to irradiation.
Figure 3.
Identification of the cellular processes affected. Genes were ranked by RELIEF (A) and by ANOVA (B) and grouped according to the cellular process involved. The ordinate corresponds to the percentage of genes involved in a given process with a rank below the value indicated on the abscissa.
Figure 4.
Schematic diagram of the oxidative phosphorylation pathway. The proteins shown in cream were not induced by continuous exposure to ionizing radiation. The numbers indicate the names of the subunits in the protein complex. The names of the CIIR genes encoding the proteins in each complex are reported.
Combining two analysis methods to spot genes responding to low dose exposure
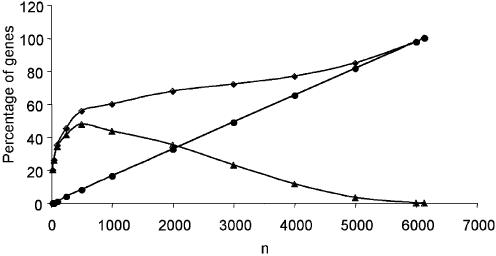
We wanted to analyze the genes involved in the response to irradiation in more detail. The main difficulty encountered was choosing a threshold of probability or weight beyond which the number of genes that are falsely considered as being informative of the growth conditions is too high. For example, a conventional method consists in setting a minimal fold change in gene intensity. Using such a method, we found that the expression of only 86 of the 6135 genes was altered by a factor two or more in the I populations as compared to the NI populations. However, only half of these 86 genes were among the top ranked genes according to RELIEF (corresponding to a weight >0.2) or ANOVA (corresponding to a P value <0.01). We consider that the 2-fold change method is insufficient, because it does not take into account the intra-class variance. The failure of this method to discover significant genes has already been reported by Tusher (8) and by Townsend (18). As it is difficult to know which ranking is the most accurate, we decided to combine the two rankings (given by the ANOVA and RELIEF methods) and we select genes that were identified as being informative of the growth conditions by both methods. We first examined the correlation between both rankings by calculating the percentage of common genes for different numbers of top ranked genes (Fig. 5). The curve shows a very unique shape with a maximum for the 500 top ranked genes, which corresponds to the highest correlation between the two rankings. We found 278 common genes in the 500 top ranked genes. These genes were named ‘Continuous Irradiation-Induced Response’ (CIIR) genes (Supplementary Material, Table S1). The probability of having such a large number of genes common to both lists by chance is almost 0 (P < 10–160 according to the hypergeometric law). The CIIR genes were identified according to their I/NI ratio (calculated for each gene by dividing the mean of the I values by the mean of the NI values). Genes with an I/NI ratio greater than 1 were considered to be induced and genes with an I/NI ratio lower than 1 were considered to be repressed. About half the CIIR genes (118) were accordingly classified as being repressed and the others (160) as being induced.
Figure 5.
Analysis of the correlation between the ANOVA and RELIEF rankings as a function of the size of the gene set. The percentage of common genes was calculated for different numbers of top ranked genes (n, in abscissa) by ANOVA and RELIEF (diamonds). The percentage of ‘false’ common genes in two independent random drawings of size n was calculated by applying the hypergeometric law (circles). The difference between the two curves indicates the percentage of correlated top ranked genes between the ANOVA and RELIEF rankings (triangles).
To identify potential transcription factors that could be involved in the response to continuous exposure to low dose rate of radiation, we looked for common sequence motifs in the 800 nucleotides immediately upstream from the coding region of the 278 CIIR genes. Among the six-nucleotide motifs found in the regulatory regions only one motif (agcgga) was present significantly more frequently (P < 0.0003 in a chi-square test) than in the entire genome. This motif was found upstream from 38 induced genes (AGP1, ATP19, COX4, COX6, CUP1-1, CUP1-2, CYT1, FUN34, FYV6, GDH2, IRA2, LSM2, MET28, MIR1, MRPL38, NHP6B, PEX4, PRM4, PTR3, RIB4, SDS23, SOD1, SPL2, VRP1, VTC1, YHB1, YNG1, YBR230C, YBR262C, YCL046W, YEL006W, YER071C, YHR121W, YIL057C, YJR078W, YKR088C, YLR262C-A and YPL261C). The (agcgga) motif is bound by three different transcription factors, including CUP2, which regulates the response to copper ions, and HSE/HSF, which is activated by stress conditions resulting in the formation of abnormal proteins. Very little is known about the third factor (UAS2CHA) that binds the (agcgga) motif, except that it seems to be involved in the cell cycle.
We examined the cellular distributions of the proteins encoded by the CIIR genes using the Snyder database (http://bioinfo.mbb.yale.edu/genome/yeast/localization.cgi). No specific trend was observed for the products of the repressed genes. In contrast, the genes induced by continuous irradiation tended to encode mitochondrial proteins: 34% of the induced CIIR gene products (55/160) compared to only 12% of all the localized proteins (710/5882). Interestingly, 20 of the 55 mitochondrial CIIR proteins have no known function. The mitochondrial CIIR genes included 21 genes coding for proteins involved in oxidative phosphorylation, ATP synthesis and oxidative stress. In contrast, the number of CIIR genes encoding nuclear proteins was lower (15%) than the relative abundance (27%) of these proteins in the cell (19). These results suggest that most of the protein changes induced by continuous irradiation occur outside the nucleus.
The responses to low dose continuous exposure and to acute irradiation are partially different
It is currently assumed that the effects of low doses can be estimated by extrapolating the data obtained for much higher doses. We tested this hypothesis by studying the transcriptional response induced by a short (2 min) but intense (100 Gy/min) period of irradiation. At this radiation dose, 75% of cells survived and the cell cycle was arrested for 4 h (data not shown) (20). As the transcriptional response to acute irradiation was sequential, with early and late inductions, we followed the kinetics of the transcriptional response for 5 h (six time points were analyzed). We analyzed the expression profiles of the 278 CIIR genes and we found that 65 CIIR genes were induced by both continuous and acute exposure and 42 were repressed by both treatments (Supplementary Material, Table S1). Most of the genes involved in ATP synthesis, oxidative phosphorylation, Cu2+ ion homeostasis and electron transport were induced by both treatments, confirming the key role of these processes in the response to irradiation. Interestingly, the transcriptional levels of 64% of the CIIR genes (177 genes: 96 induced and 81 repressed) did not change after exposure to 200 Gy (Supplementary Material, Fig. S1). This suggests that the transcriptional response to continuous exposure differs from that induced by short exposure to a high dose rate.
Transcriptional changes can be detected at dose rates as low as 0.1 mGy/h
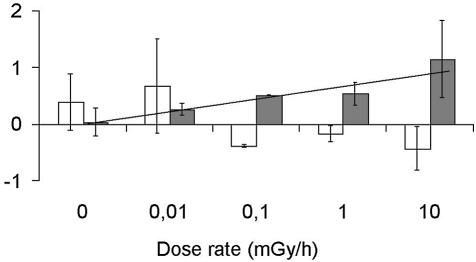
CIIR genes were selected by comparing non-irradiated populations and populations exposed to doses of 10–20 mGy/h. These dose rates are higher than the mean level of radiation in the environment. We therefore carried out 14 assays with dose rates of between 0.01 and 10 mGy/h. We estimated global changes in the population exposed to these low doses by calculating separately for each microarray the mean values (induction factor or repression factor) of the relative expression of all the induced or repressed CIIR genes respectively. The induction factor depends on the dose received by the cells, and decreases with dose rate (Fig. 6). At dose rates as low as 0.1 mGy/h, the average induction factor was significantly higher than that of the non-irradiated populations. In contrast, the repression factor appeared to be less predictable and was not clearly correlated with dose rate. However, the results obtained for this factor were similar to those obtained for the induction factor, with values clearly changing at a dose rate of 0.1 mGy/h.
Figure 6.
Induction factors and repression factors as a function of dose rate. The factors were calculated for experiments with various doses as the mean value for expression ratio of the induced (black boxes) and repressed (gray boxes) CIIR genes. The mean value and variance of factors from several experiments are reported for each dose rate analyzed.
DISCUSSION
This study describes a new method to identify when gene expression is specifically modified by extra cellular conditions. Genome-wide expression analysis using cDNA microarrays has been widely used to explore remodelling of gene expression in response to changes in environment. The high variability inherent to this technology requires the use of dedicated statistical methods essential for drawing reliable inferences from microarray data. In this work we compared two independent analysis methods, one based on classical Student’s t-test and the other being an attribute estimation technique, for their ability to discriminate transcription program between exposed populations and non-exposed populations. Both methods indicate that transcriptional change is significant between the two populations and highlight the specific induction of genes involved in oxidative phosphorylation and ATP synthesis processes. However the careful analysis of the list of genes ranked as the more relevant by the two methods show that both methods differ in their ranking. Only half of the relevant genes were ranked in the 500 more significant by both methods (see Supplementary Material, Table S1). It is difficult to determine at this stage, if the genes selected by only one analysis method are irrelevant. We chose to reduce the number of relevant genes to those selected by both methods. Doing so, we reduce the number of ‘false positive’ to 16% of the genes considered as significant (Fig. 5). This result indicates that groups of genes rather than individuals should be considered for further analysis.
The two methods we used come to agreement on the main functions altered by growth under low radiation. They point out the induction of numerous genes coding for proteins of the inner mitochondrial membrane. This finding highlights the important role of mitochondria in response to irradiation. Numerous drugs have been shown to target mitochondria. Most of them induce long-term defects in mitochondrial DNA (rho– mutants). We measured the frequency of mitochondrial mutants by testing growth of colonies on a glucose-limited medium (21). The irradiated cell population contained <0.2% ‘petite’ as did the non-irradiated control. This result indicates that mutagenesis of mitochondrial proteins cannot explain the transcriptional change observed in the exposed populations.
The detection of transcriptional changes in response to low doses of radiation raises questions concerning the nature of the signal detected in these conditions. Indeed, the amount of DNA damage is negligible at these dose rates (about one DNA damage/yeast genome/mGy). Ionizing radiation causes a temporary increase in intracellular free radical concentration due to the radiolysis of water. It has been shown recently that the oxidatively damaged proteins accumulate with replicative age being retained in the mother cells during cytokinesis (22). The cumulative effects of dose exposure in growing cells could be partially explained by the asymmetric inheritance of damaged proteins. On another hand, we cannot exclude that oxidative intermediates may accumulate in the growth medium. Several studies on mammalian cells have shown that reactive oxygen species (ROS) are released by cells after irradiation. A radiation-induced ‘bystander’ effect has been observed in cells treated with growth medium from gamma-irradiated cultures (23,24). The authors of these studies observed changes in intracellular calcium levels, mitochondrial membrane potential and ROS levels. However, it is not clear how such a process occurs in cultures exposed to low doses of radiation since the doses currently used to detect the bystander effect (0.5 Gy–5 Gy) are much higher than those used in our study. Moreover, the bystander effect has never been observed in yeast (probably because of the low permeability of yeast cell walls and the lack of cell contact). It is generally believed that intracellular ROS are primarily produced by the mitochondria. Given the harmful effects of ROS, numerous protective mechanisms are likely to have evolved to limit oxidant production and release. One possible way of decreasing mitochondrial oxidant production is to increase metabolic uncoupling between oxygen consumption and ATP generation. Such uncoupling produces heat and decreases the amount of oxygen gas released (25). Cells could use a similar mechanism to eliminate the intracellular free radicals induced by ionizing radiation.
Our results suggest that estimating induction and repression factors might be a useful way of assessing the level of exposure of a population. The distribution of the radiation-induced damages in the population is stochastic and the number of cells that are not damaged should increase as the dose decreases. Thus, as the irradiated population is heterogeneous, we can assume that the decrease in the induction factor with the dose is probably due to the decrease in the proportion of ‘responding’ cells in the population, rather than to the decrease in the level of the response in each cell.
In conclusion, we have devised a new method that can be used to detect the biological effects of pollutants in the environment. This method is based on the measurement of transcriptional changes and the combination of the results of two analysis techniques. It is 1000 times more sensitive than the detection of genetic mutations. It is noteworthy that this work provides no evidence as to whether continuous exposure to low-dose radiation is harmful or beneficial for life. It simply demonstrates that unicellular organisms, such as yeast, detect low levels of radiation in the environment and respond by modifying their transcriptional activity.
SUPPLEMENTARY MATERIAL
Supplementary Material, including the list of genes and functions present on the microarray and the table of CIIR genes, are available at NAR Online. Raw data are available at http://microarrays.curie.fr/publications/Mdutreix. The version of Relief developed for this research will be available at the following URL http://www.Iri.fr/~chris/bioinfo/BioRelief.
Acknowledgments
ACKNOWLEDGEMENTS
The authors gratefully acknowledge the ‘Consensus’ research group for stimulating discussions, and the Genopole® and the DRIDF for financially supporting our group meetings. They thank M. Pierre for technical assistance. This work was supported by l’Institut National de Recherche et de Sécurité (convention no. 5011888), the CNRS, the ACI nanostructures (N67-01), the Curie Institute, the Association pour la Recherche sur le Cancer (5659) and Biogen no. 74 (BioIngénierie 2001).
REFERENCES
- 1.DeRisi J.L., Iyer,V.R. and Brown,P.O. (1997) Exploring the metabolic and genetic control of gene expression on a genomic scale. Science, 278, 680–686. [DOI] [PubMed] [Google Scholar]
- 2.Yale J. and Bohnert,H.J. (2001) Transcript expression in Saccharomyces cerevisiae at high salinity. J. Biol. Chem., 276, 15996–16007. [DOI] [PubMed] [Google Scholar]
- 3.Ferea T.L., Botstein,D., Brown,P.O. and Rosenzweig,R.F. (1999) Systematic changes in gene expression patterns following adaptive evolution in yeast. Proc. Natl Acad. Sci. USA, 96, 9721–9726. [DOI] [PMC free article] [PubMed] [Google Scholar]
- 4.terLinde J.J., Liang,H., Davis,R.W., Steensma,H.Y., van Dijken,J.P. and Pronk,J.T. (1999) Genome-wide transcriptional analysis of aerobic and anaerobic chemostat cultures of Saccharomyces cerevisiae. J. Bacteriol., 181, 7409–7413. [DOI] [PMC free article] [PubMed] [Google Scholar]
- 5.Natarajan K., Meyer,M.R., Jackson,B.M., Slade,D., Roberts,C., Hinnebusch,A.G. and Marton,M.J. (2001) Transcriptional profiling shows that Gcn4p is a master regulator of gene expression during amino acid starvation in yeast. Mol. Cell. Biol., 21, 4347–4368. [DOI] [PMC free article] [PubMed] [Google Scholar]
- 6.Zimmermann F.K., Kern,R. and Rasenberger,H. (1974). A yeast strain for simultaneous detection of induced mitotic crossing over, mitotic gene conversion and reverse mutation. Elsevier Scientific Publishing Company, Amsterdam, The Netherlands, pp. 381–388. [Google Scholar]
- 7.Yang Y.H., Dudoit,S., Luu,P., Lin,D.M., Peng,V., Ngai,J. and Speed,T.P. (2002) Normalization for cDNA microarray data: a robust composite method addressing single and multiple slide systematic variation. Nucleic Acids Res., 30, 27–28. [DOI] [PMC free article] [PubMed] [Google Scholar]
- 8.Tusher V.G., Tibshirani,R. and Chu,G. (2001) Significance analysis of microarrays applied to the ionizing radiation response. Proc. Natl Acad. Sci. USA, 98, 5116–5121. [DOI] [PMC free article] [PubMed] [Google Scholar]
- 9.Pavlidis P. and Noble,W. (2001) Analysis of strain and regional variation in gene expresion in mouse brain. Genome Biol., 2, 1–14. [DOI] [PMC free article] [PubMed] [Google Scholar]
- 10.Sahai H. (2000) The Analysis of Variance. Birkhauser, Boston, MA. [Google Scholar]
- 11.Kononenko I. (1994) Estimating attributes: analysis and extensions of RELIEF. Proc. of the European Conf. on Machine Learning, ECML-94. pp. 171–182. [Google Scholar]
- 12.Kira K. and Rendell,L. (1992) A practical approach to feature selection. In Sleeman,D. and Edwards,P. (eds), Proceedings of the International Conference on Machine Learning. Morgan Kaufmann, Aberdeen, UK, pp. 249–256. [Google Scholar]
- 13.Roberts C.J., Nelson,B., Marton,M.J., Stoughton,R., Meyer,M.R., Bennett,H.A., He,Y.D., Dai,H., Walker,W.L., Hughes,T.R. et al. (2000) Signaling and circuitry of multiple MAPK pathways revealed by a matrix of global gene expression profiles. Science, 287, 873–880. [DOI] [PubMed] [Google Scholar]
- 14.Galitski T., Saldanha,A.J., Styles,C.A., Lander,E.S. and Fink,G.R. (1999) Ploidy regulation of gene expression. Science, 285, 251–254. [DOI] [PubMed] [Google Scholar]
- 15.Eisen M.B., Spellman,P.T., Brown,P.O. and Botstein,D. (1998) Cluster analysis and display of genome-wide expression patterns. Proc. Natl Acad. Sci. USA, 95, 14863–14868. [DOI] [PMC free article] [PubMed] [Google Scholar]
- 16.Cheok M.H., Yang,W., Pui,C.H., Downing,J.R., Cheng,C., Naeve,C.W., Relling,M.V. and Evans,W.E. (2003) Treatment-specific changes in gene expression discriminate in vivo drug response in human leukemia cells. Nature Genet., 34, 85–90. [DOI] [PubMed] [Google Scholar]
- 17.Turner J.R. and Thayer,J. (2001) Introduction to Analysis of Variance: Design, Analysis and Interpretation. Sage Publications Ltd, London, UK. [Google Scholar]
- 18.Townsend J.P. and Hartl,D.L. (2002) Bayesian analysis of gene expression levels: statistical quantification of relative mRNA level across multiple strains or treatments. Genome Biol., 3, RESEARCH0071. [DOI] [PMC free article] [PubMed] [Google Scholar]
- 19.Kumar A., Agarwal,S., Heyman,J.A., Matson,S., Heidtman,M., Piccirillo,S., Umansky,L., Drawid,A., Jansen,R., Liu,Y. et al. (2002) Subcellular localization of the yeast proteome. Genes Dev., 16, 707–719. [DOI] [PMC free article] [PubMed] [Google Scholar]
- 20.Mercier G., Denis,Y., Marc,P., Picard,L. and Dutreix,M. (2001) Transcriptional induction of repair genes during slowing of replication in irradiated Saccharomyces cerevisiae. Mutat. Res., 487, 157–172. [DOI] [PubMed] [Google Scholar]
- 21.Ferguson L.R. and von Borstel,R.C. (1992) Induction of the cytoplasmic ‘petite’ mutation by chemical and physical agents in Saccharomyces cerevisiae. Mutat. Res., 265, 103–148. [DOI] [PubMed] [Google Scholar]
- 22.Aguilaniu H., Gustafsson,L., Rigoulet,M. and Nystrom,T. (2003) Asymmetric inheritance of oxidatively damaged proteins during cytokinesis. Science, 299, 1751–1753. [DOI] [PubMed] [Google Scholar]
- 23.Little J.B. (2000) Radiation carcinogenesis. Carcinogenesis, 21, 397–404. [DOI] [PubMed] [Google Scholar]
- 24.Lyng F.M., Seymour,C.B. and Mothersill,C. (2002) Early events in the apoptotic cascade initiated in cells treated with medium from the progeny of irradiated cells. Radiat. Prot. Dosimetry, 99, 169–172. [DOI] [PubMed] [Google Scholar]
- 25.Skulachev V.P. (1996) Role of uncoupled and non-coupled oxidations in maintenance of safely low levels of oxygen and its one-electron reductants. Q. Rev. Biophys., 29, 169–202. [DOI] [PubMed] [Google Scholar]
Associated Data
This section collects any data citations, data availability statements, or supplementary materials included in this article.


