

Abstract
Understanding the patterns of gene flow of an endangered species metapopulation occupying a fragmented habitat is crucial for landscape-level conservation planning and devising effective conservation strategies. Tigers (Panthera tigris) are globally endangered and their populations are highly fragmented and exist in a few isolated metapopulations across their range. We used multi-locus genotypic data from 273 individual tigers (Panthera tigris tigris) from four tiger populations of the Satpura–Maikal landscape of central India to determine whether the corridors in this landscape are functional. This 45 000 km2 landscape contains 17% of India's tiger population and 12% of its tiger habitat. We applied Bayesian and coalescent-based analyses to estimate contemporary and historical gene flow among these populations and to infer their evolutionary history. We found that the tiger metapopulation in central India has high rates of historical and contemporary gene flow. The tests for population history reveal that tigers populated central India about 10 000 years ago. Their population subdivision began about 1000 years ago and accelerated about 200 years ago owing to habitat fragmentation, leading to four spatially separated populations. These four populations have been in migration–drift equilibrium maintained by high gene flow. We found the highest rates of contemporary gene flow in populations that are connected by forest corridors. This information is highly relevant to conservation practitioners and policy makers, because deforestation, road widening and mining are imminent threats to these corridors.
Keywords: Panthera tigris, central India, gene flow, connectivity, landscape genetics, non-invasive genetic analysis
1. Introduction
Dispersal and gene flow in a metapopulation maintain local demographic and genetic variation, and increase the probability of species persistence [1–3]. Persistence of wide-ranging animals occupying fragmented landscapes depends on matrix quality and the ability of individuals to move among habitat patches [4], and corridors facilitate movement of individuals between habitat patches [5–9]. Tigers (Panthera tigris) are the apex predator of Asian forest ecosystems. They are a conservation-dependent species, whose survival requires a sufficient quantity of large prey and vast swaths of contiguous forest habitat [10]. Tigers now occupy only 7% of their global historical range, which is fragmented into 76 metapopulations, called tiger conservation landscapes (TCL) [10]. The forest patches in each TCL are assumed to remain linked through structural (forest) corridors, but the functionality of these corridors in sustaining gene flow has not been established. Structural corridors are elements of the landscape that physically connect isolated habitat patches. Functionality of structural corridors can be ascertained by examining the behavioural response of the individuals of a species and facilitation of their ecological processes such as movement, dispersal and gene flow through them [11–12].
Very few empirical studies have estimated gene flow in cat species [13–16] and none, to our knowledge, has investigated historical gene flow. For tigers specifically, there is no published information available about landscape-level gene flow, meaning we do not know enough about how habitat connectivity may influence genetic diversity and population persistence in a metapopulation context. Our study explores the historical and current pattern of gene flow within a group of four global priority TCLs (TCL 50: Kanha–Phen, TCL 51: Pachmari–Satpura–Bori, TCL 52: Melghat and TCL 53: Pench) that forms a critically important metapopulation of tigers in the Central Indian Highlands of India (figure 1). This spatially heterogeneous metapopulation is large enough to sustain a viable breeding population of tigers, but the intervening matrix and corridors are under heavy human pressure [17,18]. These four TCLs were not thought to be connected with each other based on known dispersal limits of tigers and thus classified as separate demographic populations in classification of TCL [10]. The Kanha–Pench and Satpura–Melghat TCLs are connected by forest corridors, whereas the Pench–Melghat and Pench-Satpura TCLs have fragmented forest patches between them.
Figure 1.

Satpura–Maikal landscape in central India and land cover in 1700 and 2000 CE. The Satpura–Maikal landscape (right side) and its location in India (inset). Red dots represent the locations of the individual tigers identified in each tiger reserve (orange boundary) and corridors using multi-locus genotype data. The two figures on the left side are Anthrome 2.0-generated maps of land cover for the years 1700 and 2000 in the Satpura–Maikal landscape and show the dramatic change in the landscape in the past 300 years.
Dispersal and gene flow are key requirements to ensure persistence of metapopulations [19]. Structural habitat patches or corridors that connect various demes in a metapopulation facilitate dispersal of individuals, re-colonizing patches in case of local extinctions [2]. When populations are depressed, dispersal followed by successful breeding may result in gene flow and genetic rescue [19]. In the context of connectivity and its effect on gene flow, we hypothesize that four TCLs in our study area are genetically connected with each other based on the presence of structural corridors among them. We also investigate historical gene flow pattern in this metapopulation to decipher the complex evolutionary process that explains the observed patterns of contemporary genetic structure.
Humans have altered the terrestrial biosphere in overwhelming proportions in the last few centuries [20,21]. Placing people in the map brings out the fact that more than 75% of ice-free land on the Earth has signs of human-induced alterations and less than 25% remains pristine [22]. We were also keen to explore the effect of human-induced change in land-cover and land-use patterns in our study area in central India and its correlation with change in gene flow among its tiger metapopulation.
Historically, tiger habitat in central India was largely contiguous owing to the extensive forest cover; currently, tiger populations in this landscape are limited to a few forest patches [10,18]. Thus, we hypothesized that the historical gene flow in tiger metapopulations of central India would be high compared with contemporary gene flow. We also predicted that forest corridors linking viable tiger populations maintained historical levels of gene flow, and empirically compared the gene flow between tiger populations connected by forest corridors with those that did not have contiguous corridors between them.
The first step to understanding the genetic configuration of a metapopulation is to examine any genetic structure in it followed by investigating the processes, for example, gene flow that influences the pattern of genetic structure. We investigated and found low levels of genetic structure in the tiger metapopulation of the Satpura–Maikal landscape [17]. Analysis and comparison of historical and contemporary gene flow patterns provide information about the configuration of gene exchange and relationships among tiger populations that occupy this landscape.
2. Material and methods
(a). Study area and sampling
Our study area, in the Satpura–Maikal landscape in central India, covers approximately 45 000 km2 (21.15–22.8° N and 76.5–81.05° E; figure 1). The Satpura Range is one of the oldest mountain ranges in the world and, together with the Vindhyachal Range in the north and the Maikal Range in the east, forms the catchments for the Narmada and the Tapti rivers and their tributaries. Our study sites were the five tiger reserves of this landscape: Kanha tiger reserve (Kanha), Bori–Satpura tiger reserve (Satpura), Melghat tiger reserve (Melghat), Pench MP (Madhya Pradesh) and Pench Mh (Maharashtra) tiger reserves (combined we refer to these two as Pench; they are geographically connected to each other but located in different states), along with the forest corridors connecting these reserves. Kanha is connected to Pench and located towards the east of the landscape, whereas Melghat has a corridor common with Satpura and lies to the west of the landscape. Pench and Satpura also have forest connectivity between them. The connectivity between Kanha–Pench and Satpura–Melghat tiger reserves is largely contiguous forest cover, whereas the connectivity between Pench–Melghat and Pench–Satpura tiger reserves is stepping-stone connectivity of varying degrees through the isolated forest patches along the corridor. In the case of the Kanha–Satpura pair, there is some forest cover adjacent to both reserves in the direction of the corridor, but the central region is devoid of good forest cover (see the electronic supplementary material, figure S1). Tiger presence has been reported in Kanha–Pench and Satpura–Melghat corridors during our study. The intervening landscape matrix in this landscape is composed of agricultural land and fragmented forest patches, interspersed with numerous small villages and towns.
We conducted systematic sampling by carrying out extensive surveys covering 15 000 km of forest trails and roads in these five tiger reserves and the corridors between them to collect non-invasive genetic samples. We identified tiger faecal samples by their size and associated signs, such as scrapes and pugmarks in the field. Hair and claw samples were also collected, opportunistically, from trees marked by tigers and from kill sites. Sample locations were recorded with a GPS (Garmin Inc.) along with habitat information. Samples were preserved in 100% ethanol and stored at room temperature until DNA was extracted.
(b). Genotyping and population genetic parameters
We genotyped 1411 felid faecal samples, 66 hair samples and four claw samples from four populations using seven felid-specific microsatellite markers and identified 273 individual tigers. Further details about sampling, DNA extraction and amplification, species and individual identification, genetic diversity estimation and tests for Hardy–Weinberg equilibrium (HWE; table 1) and population subdivision (table 2) are described in Sharma et al. [17].
Table 1.
Global measures of genetic diversity at seven microsatellite loci in tiger metapopulation (n = 273 individual tigers) of the Satpura–Maikal landscape. (A, alleles per locus; AR, allelic richness; Ho, observed heterozygosity; He, expected heterozygosity; FIS, inbreeding coefficient.)
| all populations (n = 273) |
|||||
|---|---|---|---|---|---|
| locus | A | AR | Ho | He | FIS |
| F42 | 12 | 8.08 | 0.49 | 0.82a | 0.4 |
| F43 | 10 | 5.45 | 0.69 | 0.75 | 0.07 |
| FCA279 | 15 | 9.4 | 0.69 | 0.87a | 0.19 |
| FCA441 | 7 | 5.93 | 0.59 | 0.79a | 0.26 |
| FCA628 | 14 | 9.96 | 0.7 | 0.84a | 0.18 |
| FCA672 | 15 | 9.57 | 0.75 | 0.85 | 0.1 |
| E7 | 14 | 5.93 | 0.66 | 0.76 | 0.08 |
| mean | 12.43 | 7.76 | 0.65 | 0.81 | 0.18 |
| s.d. | 2.99 | 1.96 | 0.09 | 0.05 | 0.12 |
aSignificant values for HWE following Bonferroni correction (α = 0.5).
Table 2.
Pairwise FST (below diagonal) and geographical distance (distance through forest connectivity in km; above diagonal) values for the four study populations.
| Kanha | Pench | Satpura | Melghat | |
|---|---|---|---|---|
| Kanha | — | 145 | 275 | 370 |
| Pench | 0.008a | — | 115 | 155 |
| Satpura | 0.014a | 0.015a | — | 125 |
| Melghat | 0.015a | 0.025a | 0.008a | — |
aFST values are significant (α = 0.05).
(c). Gene flow estimation
We parsed out the gene flow configuration using a suite of software programs that use a coalescent method and Bayesian approach with Markov chain Monte Carlo (MCMC) sampling to detect the rate of interpopulation exchange of migrants at historical and contemporary timescales. A strong signal of isolation by distance (IBD) has been shown to bias gene flow estimates [23]. However, we have previously determined that there is no evidence of IBD in this metapopulation [17].
(i). Estimation of contemporary gene flow
We estimated the average number of migrants (Nm) using the private allele method [24] as implemented in Genepop [25]. Geneclass v. 2.0 [26] was used to detect first-generation migrants, applying the likelihood-based test statistics Lh/Lmax, using Bayesian criterion and Monte Carlo resampling [27] with 10 000 simulated individuals at an alpha value of 0.01.
We used Bayesass v. 1.3 [28] to estimate levels of contemporary gene flow which we assume to be over the last five to seven generations (i.e. 25–35 years), given a generation time of 5 years for tigers [29]. This software uses a Bayesian approach with MCMC sampling to estimate recent migration rates (m = proportion of population consisting of genetic migrants). This method does not assume the population to be in HWE or migration–drift equilibrium. The program was run for 3 × 10⁷ iterations of which 107 were burn-in. Multiple runs were performed with different seed numbers and delta values to confirm the final parameter that would accept 40–60% of changes to the total chain length, and ensure the convergence and consistency among runs.
(ii). Estimation of historical gene flow
We used Migrate-n v. 3.2.7 [30] to estimate levels of historical gene flow (approx. 4Ne generations in the past) and effective population size. Migrate uses a coalescent method with MCMC to estimate the mutation-scaled parameter for effective population size (θ = 4Neµ, where Ne is effective population size and µ is mutation rate) and migration rate (M = m/µ, where m is immigration rate). A mutation rate of 1 × 10⁻² was assumed in parameter estimation [31]. A Bayesian inference with both models infinite allele model and stepwise mutation model (SMM) was used for parameter estimation. We compared the results and found no significant difference in these two models in migration rates (p = 0.33, one-tailed paired t-test; electronic supplementary material, figure S2), and report the migration rates from SMM model while comparing with contemporary gene flow rates. All starting values were optimized by multiple test runs, adjusted for subsequent runs. The final run recorded 1 × 10⁶ genealogies at a sampling increment of 50 iterations, following a burn-in of 5 × 10⁴. We used four heated chains with temperatures, 1.0, 1.5, 3.0 and 6.0, to ensure sufficient sampling of genealogical space. Migrate assumes that populations are in migration–drift equilibrium but does not require them to be in HWE. Concordance of historical and contemporary migration rates was checked using a Mantel test [32] with 10 000 permutations in ZT [33]. We used OneSamp [34] to estimate the contemporary effective population size.
We used the program 2MOD [35] to investigate the processes that led to the contemporary population structure. This program uses coalescent-based MCMC and compares the relative likelihood of two models of population history (pure drift versus gene flow). The pure drift model assumes that the ancestral populations were panmictic and gradually diverged into independent populations by drift only, without any gene flow. The gene flow or migration–drift equilibrium model assumes that the contemporary states of allele frequencies within populations are maintained by a relative balance between random mutation and gene flow.
(d). Population divergence and history
To estimate divergence times and population history, we used the coalescent-based approximate Bayesian computation (ABC) algorithm in the program DIY-ABC [36]. This algorithm simulates datasets for each of a specified set of scenarios of historic and/or demographic events and compares summary statistics from these with that of the observed data. The posterior probability and distribution of parameters of each scenario are estimated and alternative scenarios can be compared. We applied different scenarios with various splitting and admixture events based on the history of tiger populations and their genetic structure in central India to explain contemporary population structure. We used wide priors (10–10 000) for all parameters during simulations. The generalized SMM was applied with default values. For each simulated dataset, all four within- and five of the seven default among-populations summary statistics were calculated. We simulated 1 × 10⁶ datasets for each explored scenario. The 500 and 10 000 sets with summary statistics that were most similar to the observed data were identified through the direct and logistic regression rejection steps of the algorithm, respectively, and used for ABC estimation of parameters. The DIY-ABC program assumes that populations evolve independently without migration between the historic and demographic events, therefore we used a hierarchical ABC analysis to obtain the most accurate and pertinent model of evolutionary history for our data (see the electronic supplementary material, figure S3a,b).
(e). Land-cover change detection analysis
We used Anthrome v. 2.0 dataset [22] to estimate change on land use and land cover in our study area. Anthrome (anthropogenic biomes) data project the interplay of human density, agriculture and urban land use and its effect on terrestrial biomes. The global patterns of these anthropogenic transformations were classified using an a priori anthrome classification algorithm, and global terrestrial biomes were divided into 19 anthrome classes that can be broadly classified into wild (two subclass), seminatural (four subclass) and used (13 subclass), based on the intensity of human use. These data are available at 5′ resolution at century intervals from 1700 to 2000 CE and can be used to estimate the coarse-scale change in land cover and land use in any area of the world. We used ArcGIS v. 9.2 to delineate the extent of our study area in the global Anthrome v. 2.0 data and calculated the area of three major land-cover/land-use classes (dense settlement, villages and croplands, and seminatural wildlands) for all four data layers from the year 1700 to 2000 CE (see the electronic supplementary material, figure S4). We compared the change in these major land-cover/land-use classes from 1700 to 2000 CE to estimate the extent and magnitude of deforestation and expansion of human influence in our study area.
(f). Comparing corridors
To test the hypothesis that the degradation or loss of structural corridors results in reduced gene flow, we performed a pairwise t-test between the rates of contemporary and historical gene flow by classifying corridors into two groups of intact and degraded corridors. Gene flow at different timescales was compared for those tiger reserves that are still connected by intact forest corridors (Kanha–Pench, Satpura–Melghat and Pench–Satpura pairs). These corridors are also known to have had tigers in the recent past (within the last 10 years). In the other set, the corridors have been severely degraded in the past century and are dominated by croplands and human-dominated matrix (corridors between Kanha–Satpura, Kanha–Melghat and Melghat–Pench pairs). We also tested the power of the paired t-test comparisons with a power analysis in the program G*Power v. 3.1.5 [37].
3. Results
(a). Population and individual-based migrants
The global FST value among all population pairs was low (0.013 ± 0.006 s.d.; table 2), which is equivalent to approximately 10 effective migrants (Nm) per generation in the entire metapopulation. Moreover, individual-based likelihood test statistics identified six first-generation migrants (see the electronic supplementary material, table S5).
(b). Historical and contemporary gene flow
Both historical and contemporary gene flow was high, but the historical gene flow rate (Mh: mean 0.1 ± 0.06 s.d.) was significantly higher (p = 0.045, one-tailed paired t-test) than that of the contemporary gene flow rate (Mc: mean 0.065 ± 0.068 s.d.). Although they are correlated (r = 0.47, p = 0.0001, Mantel test), the magnitude and direction of gene flow varies in the two time periods (figure 2). Historically, there was high gene flow from Kanha to Melghat and Satpura and from Pench to Satpura and Melghat, with Kanha and Pench acting as source populations. Currently, only Pench is acting as a source population, and gene flow from Pench to Kanha and Satpura is very high. A comparison of contemporary and historical patterns reveals that gene flow between the Pench–Satpura and Melghat–Satpura pairs remains similar, whereas there has been a 47–70% reduction in gene flow between Kanha–Satpura, Pench–Melghat and Kanha–Melghat. The highest contemporary gene flow is between Pench and Kanha. Assessment of the likelihood of alternative models to explain population history supports a migration–drift equilibrium model (85.6%, Bayes factor = 5.95), which signifies the role of gene flow in averting population subdivision compared with random drift.
Figure 2.
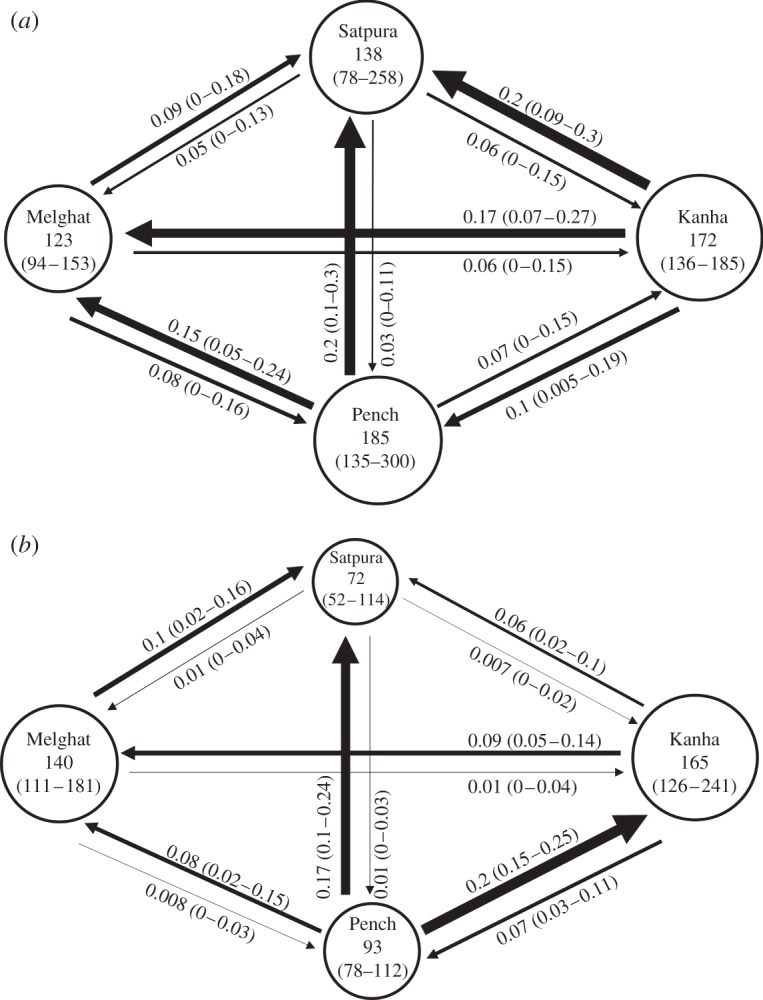
(a) Historical and (b) contemporary gene flow pattern in the Satpura–Maikal landscape. The arrows show the direction of gene flow and their thickness represents the magnitude of gene flow, which is also shown numerically along the arrows, with the 95% CI in parentheses. Circle size represents effective population size (Ne). The value inside the circle is Ne with the 95% CI in parentheses.
(c). Population history and genetic subdivision
Historical habitat loss, fragmentation and demographic dynamics leave their signature on the genetic structure of the species of concern [2]. We used the ABC method to compare the alternative evolutionary scenario of population demographic history with our data and to estimate population divergence [36]. Because the ABC method assumes the absence of migration after population divergence, we used a hierarchical ABC analysis with three levels to obtain the most parsimonious model of evolutionary history for our data (figure 3 and the electronic supplementary material, table S6). In the first hierarchical level of ABC analysis, we compared seven alternative evolutionary scenarios that were formulated on the basis of available information on the history of the tiger population, its habitat and current genetic structure in this landscape. We estimated posterior probability and parameters with all seven alternative scenarios to explain the population history and divergence time, and then, in the second hierarchical level of ABC analysis, the four best scenarios were re-analysed with known parameter information to select the best among those four scenarios. In the third hierarchical level of ABC analysis, we again tested the best-selected scenario from second level with a wide range of known parameter (divergence time) information.
Figure 3.

The schematic diagram of hierarchical ABC analysis to compare various evolutionary history and divergence scenarios generated and tested using the program DIY-ABC. (a) Level 1 has wide priors for divergence times for all seven scenarios. (b) Level 2 has the following prior (t1 = 40 generations, t2 = 200 generations and t3 = 2000 generations) for divergence time for all four scenarios. (c) Level 3 has different values for divergence time for each of the three scenarios (Sc1: t1 = 40, t2 = 200, t3 = 2000; Sc2: t1 = 20, t2 = 100, t3 = 1000; Sc3: t1 = 70, t2 = 140, t3 = 4000). The best scenarios selected at each level are marked by underline and bold fonts.
The most appropriate scenario selected with the highest posterior probability (Pp = 0.517) in the first level was also the simplest of all (figure 3 and the electronic supplementary material, table S6), and assumes that the four extant tiger populations of the Satpura–Maikal landscape simultaneously diverged from a single ancestral population with no migration events after divergence. The parameter estimation with this model shows that these four populations started diverging at t = 138 generations ago, i.e. 690 years, assuming a 5-year generation time for tigers [29]. The next best scenarios selected (figure 3) with the second, third and fourth highest Pp (0.153, 0.149 and 0.097, respectively) are based on the assumption that the ancestral population first diverged into two, and subsequently into four and those populations 2 and 4 (Pench and Melghat) have varied admix proportions owing to migration from populations 1 and 3 (Kanha and Satpura). Based on what we know about the genetic structure of tigers in this landscape [17], the second ranked scenario from level 1 (Pp = 0.153) seems to provide the best explanation, given our data.
In the second hierarchical level of ABC analysis, we used the four scenarios with highest Pp value from level 1 and plugged in the historical a priori information about divergence time (t1 = 40 generations, t2 = 200 generations and t3 = 2000 generations) to compare them. Scenario 4 was selected (Pp = 0.77; figure 3 and the electronic supplementary material, table S6) as the best model at level 2. We used this scenario in the third hierarchical level of ABC analysis to simulate three scenarios with different values for divergence time (Sc1: t1 = 40, t2 = 200, t3 = 2000; Sc2: t1 = 20, t2 = 100, t3 = 1000; Sc3: t1 = 70, t2 = 140, t3 = 4000) to check which one of them explains the cryptic information in our data most accurately. Scenario 1 in level 3 was selected as the best model based on the highest Pp (0.50) value (figure 3; see the electronic supplementary material, for additional information on three hierarchical levels of ABC analysis).
(d). Historical events affecting tiger populations
The divergence times as estimated from the best scenario selected at level 3 of hierarchical ABC analysis translate into three distinct points of demographic change or divergence in the tiger metapopulation of central India. The first one dates to approximately 10 000 years BP, which agrees with the time of the entry of tigers into the Indian subcontinent estimated using biogeographical modelling and molecular analysis [38,39]. The next change was about 700 years BP when the panmictic population of tigers in central India started dividing into two clusters owing to anthropogenic forest fragmentation and habitat loss, when, during the twelfth and thirteenth centuries (the early Muslim era in India), riverine valleys and surrounding forest tracts were cleared for agriculture [40,41]. Forest fragmentation accelerated in the eighteenth and nineteenth centuries (the British era), when the central Indian forests were cleared to meet the British Empire's growing demands for timber, mainly for building railroads and ships [41,42]. This habitat loss along with rampant hunting of tigers during the British era drastically reduced the tiger population [41,43]. This point of time is evident in their evolutionary history marked at about 200 years ago, when four admixed but distinct geographical populations persisted in the areas that were either not arable or inaccessible.
(e). Temporal change in land use and land cover
Our hypothesis of extensive habitat loss and fragmentation in central India is further supported by the Anthrome v. 2.0 data [22] that map and characterize global anthropogenic transformation of the terrestrial biosphere from 1700 to 2000 CE. The Anthrome data analysis for our study area revealed that the Satpura–Maikal landscape has lost 78% of its forest cover to farmlands and urbanization (figures 1 and 4). In the last 300 years, there was 22-fold increase in agricultural area and 25-fold increase in urbanization. The human population in India has grown 10-fold since 1700 CE [44].
Figure 4.
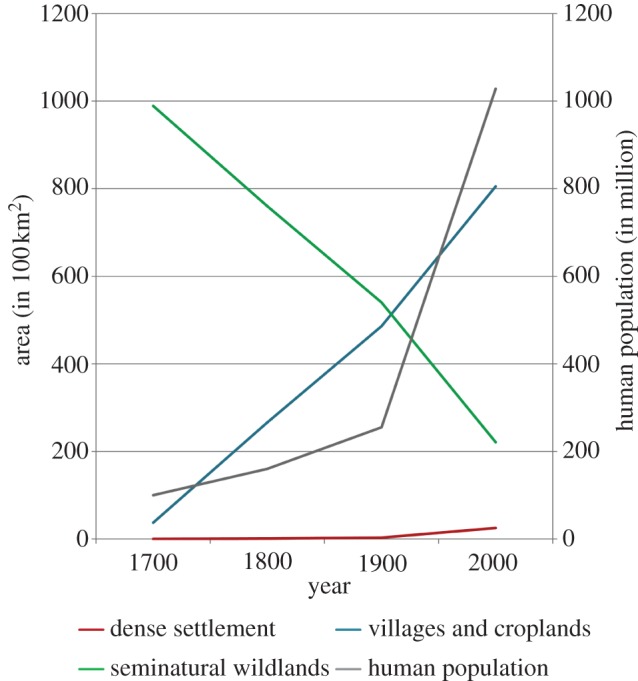
Change in land cover and human population in the Satpura–Maikal landscape in the last 300 years (1700–2000).
(f). Comparing corridors
We found a significant reduction in gene flow (p = 0.001, power = 1, one-tailed paired t-test) between the tiger reserve pairs with degraded corridors (Kanha–Satpura, Kanha–Melghat and Melghat–Pench), whereas there is no significant change in gene flow (p = 0.46, power = 0.39, one-tailed paired t-test) for those tiger reserves that are still connected by forest corridors (Kanha–Pench, Satpura–Melghat and Pench–Satpura).
4. Discussion
Although historical gene flow in the tiger metapopulation of central India has mitigated the drift-induced subdivision and has been in a state of migration–drift equilibrium, contemporary gene flow has been reduced. A comparison of the spatial pattern of remnant forest patches and the pattern of contemporary gene flow further confirms that there is a drastic reduction in gene flow among those tiger reserve pairs (Kanha–Satpura, Pench–Melghat and Kanha–Melghat) that have lost forest connectivity. Gene flow has been maintained at the same scale between the remaining tiger reserve pairs owing to the existing functional corridor between them. These results support our hypothesis about genetic connectivity of the predefined TCLs owing to presence of functional corridors. Based on the significant gene flow between TCL pairs, we suggest consolidating these pairs into a genetically connected single metapopulation. We also advise reclassifying the tiger landscape taxonomy in the light of genetic connectivity and gene flow information into genetic TCL (G-TCLs).
One of the major caveats of estimating historical gene flow rates using Migrate is the potential bias owing to fluctuating populations over the time that affect and bias measures of effective population size. But with our analysis of historical gene flow and effective population size, we can only go back to about 4Ne generations, which translate to about 2400–3700 years (generation time for tigers in approx. 5 years). The only severe decline in tiger population reported in India in this time frame was in the past century when there was about a 50-fold decline in the countrywide tiger population, but the population has never fallen to a few individuals [43]. Also, we did not detect a genetic signature of a bottleneck in our metapopulation [17], which only appears in a population that has undergone a dramatic decline (10–1000-fold) in effective population size to a very few remaining individuals [45,46]. A demographic decline does not necessarily result in a bottleneck, and other factors such as the duration of population decline, pre-bottleneck genetic diversity, generation time, recovery rates and gene flow rates from other populations can affect the probability of detecting a population bottleneck [47–49].
The genetic diversity of tigers in India has remained high even after a recent (approx. 150 years) 10-fold decline in the effective population size [43]. The contemporary populations from our study area also have high allelic diversity (table 1). Most of the regional tiger populations were still supposed to be connected with each other by structural corridors during and after the population decline, thus maintaining a high metapopulation Ne. Both theoretical and empirical studies report that the hierarchical structure and asymmetric gene flow maintain high levels of genetic diversity and high metapopulation Ne [50].
The program Migrate estimates gene flow over a long time period and there is little correlation between Ne and M, in contrast to Ne and Nm that have a strong dependence [51]. An assumption of Migrate is that the populations have been in immigration–drift equilibrium and have had relatively constant population sizes [30]. Our analysis in 2-MOD confirms that these four tiger populations have been in migration–drift equilibrium and current levels of genetic structure are a result of equilibrium between migration and drift.
A caveat of estimating historical migration rates using Migrate is dependence of migration rates on microsatellite mutation rates [30]. Depending on mutation rates, the migration rates may change by several orders of magnitude [30]. Estimations of mutation rates are not available for any cat species [31]. Mutation rates are also locus specific and can evolve at different rates and direction even in closely related species [52]. It has been found that mutation rates in microsatellite loci are inversely related to their motif sizes, and dinucleotides appear to have mutation rates 1.5–2 times higher than that of tetranucleotides [53]. Microsatellite mutation rate has a linear relationship with number of repeats in a microsatellite locus [54] that is estimated between 10 × 10−3 and 10 × 10−2 above a repeat length of 100 base pairs. We selected a mutation rate of 10 × 10−2 for our analysis, because five of our chosen loci were dinucleotides and the most common allele length for all of them was above 100 base pairs. The cumulative allele size of these loci ranged from 82 to 255 base pairs [17]. If we select a lower mutation rate, then the parameters (Ne and m) will vary by an order of magnitude.
The extent and rate of habitat loss and fragmentation indicate that population subdivision is an ongoing process in the tiger metapopulation of central India. Anthropogenic interventions transform the landscape much faster than the genetic composition of its inhabitants, and subsequently a time lag can be seen in the emergence of genetic effects relative to the timing of the initial disturbance [55–57]. In the light of this information, we argue that these tiger populations either evaded the more severe effects of habitat fragmentation-induced genetic subdivision owing to corridor-mediated gene flow and substantially large effective population size, or there is a delay in response to the appearance of those effects owing to long generation time in tigers, as seen in other species [58,59]. In either case, our study shows a significant reduction in gene flow at a contemporary timescale. Furthermore, even if this reduction in levels of gene flow is not owing to changes in landscape patterns and habitat loss, it should not diminish the importance of maintaining and preserving corridors for the future persistence of this metapopulation.
Protected areas are important for conservation [60], but the quality of the intervening matrix also matters to achieve greater conservation returns [61], because wide-ranging species, for instance tigers, are more vulnerable in this matrix [62]. The functional status of corridors in central India is declining rapidly owing to fragmentation, mining, road widening, railroad construction and urbanization [17,18,63]. We found that the Kanha–Pench corridor still has a few tigers, the Satpura–Melghat corridor lost all except one within four years (2006–2010), and no tigers were found in other corridors [17]. Local population extinctions are described as a more sensitive indicator of the loss of biological capital than species extinctions are [64]. Corridors facilitate animal movement and are crucial for re-colonizing areas where populations have gone locally extinct and eventually maintaining the metapopulation dynamics [65]. A study on tiger occupancy conducted in a Himalayan foothills landscape found reduction in tiger occupancy owing to presumed loss in functionality of a regional corridor [66]. Another study on the leopard metapopulation of central India reiterates the importance of corridors in maintaining gene flow at landscape level [67].
We have presented compelling evidence to suggest that these corridors are effective and functional in maintaining gene flow. These corridors play an important role in maintaining genetic variation and persistence of tigers in this landscape. Reconnecting broken corridors and maintaining existing ones in a politically sensitive and logistically feasible way is a big challenge for conservation biologists and policy makers.
Acknowledgements
We thank the Principal Chief Conservator of Forests (Wildlife) Madhya Pradesh and Maharashtra for granting research permission. We are grateful to the Field Directors of all five tiger reserves (Kanha, Satpura, Melghat, Pench MP and Mh) for providing logistical help. We thank Yogesh S. Shouche and Hitendra Munot of the National Center for Cell Sciences, Pune, India, for providing laboratory space and facilitating the laboratory work. At the Smithsonian Conservation Biology Institute (SCBI), Robert Fleischer and Nancy Rotzel of the Center for Conservation and Evolutionary Genetics and Libby Dougan of the Conservation Ecology Center offered research and logistical support. Susan Lumpkin and Rob Baldwin provided useful suggestions and editorial input to improve the manuscript. We thank the associate editor and two anonymous reviewers for comments that greatly improved the quality of this manuscript.
This study was approved by the forest department of India, research permits PCCF-MP:Technical-559 dated 11 February 2009; PCCF-Mh: Desk-22(8)/3053/08-09 dated 27 January 2009.
Funding statement
Support for this study was provided by the Smithsonian Conservation Biology Institute (SCBI), Friends of the National Zoo (FONZ), Kathryn Fuller Science for Nature Fund of World Wildlife Fund (WWF) and International Bear Association (IBA). Support for manuscript preparation was provided by a dissertation completion grant from George Mason University.
References
- 1.Slatkin M. 1987. Gene flow and the geographic structure of natural populations. Science 236, 787–792 (doi:10.1126/science.3576198) [DOI] [PubMed] [Google Scholar]
- 2.Keyghobadi NKN. 2007. The genetic implications of habitat fragmentation for animals. Can. J. Zool. 85, 1049–1064 (doi:10.1139/Z07-095) [Google Scholar]
- 3.Marko PB, Hart MW. 2011. The complex analytical landscape of gene flow inference. Trends Ecol. Evol. 26, 448–456 (doi:10.1016/j.tree.2011.05.007) [DOI] [PubMed] [Google Scholar]
- 4.Fahrig L. 2003. Effects of habitat fragmentation on biodiversity. Annu. Rev. Ecol. Evol. Syst. 34, 487–515 (doi:10.1146/annurev.ecolsys.34.011802.132419) [Google Scholar]
- 5.Hale ML, Lurz PWW, Shirley MDF, Rushton S, Fuller RM, Wolff K. 2001. Impact of landscape management on the genetic structure of red squirrel populations. Science 293, 2246–2248 (doi:10.1126/science.1062574) [DOI] [PubMed] [Google Scholar]
- 6.Mech SG, Hallett JG. 2001. Evaluating the effectiveness of corridors: a genetic approach. Conserv. Biol. 15, 467–474 (doi:10.1046/j.1523-1739.2001.015002467.x) [Google Scholar]
- 7.Bennett AF. 2003. Linkages in the landscape: the role of corridors and connectivity in wildlife conservation. Cambridge, UK: IUCN [Google Scholar]
- 8.McRae BH, Beier P. 2007. Circuit theory predicts gene flow in plant and animal populations. Proc. Natl Acad. Sci. USA 104, 19 885–19 890 (doi:10.1073/pnas.0706568104) [DOI] [PMC free article] [PubMed] [Google Scholar]
- 9.Carroll C, McRae BH, Brookes A. 2012. Use of linkage mapping and centrality analysis across habitat gradients to conserve connectivity of gray wolf populations in western North America. Conserv. Biol. 26, 78–87 (doi:10.1111/j.1523-1739.2011.01753.x) [DOI] [PubMed] [Google Scholar]
- 10.Dinerstein E, et al. 2007. The fate of wild tigers. BioScience 57, 508–514 (doi:10.1641/B570608) [Google Scholar]
- 11.Theobald DM. 2006. Exploring functional connectivity of landscapes using landscape networks. In Connectivity conservation (eds Crooks KR, Sanjayan M.), pp. 416–443 Cambridge, UK: Cambridge University Press [Google Scholar]
- 12.Baldwin RF, Perkl RM, Trombulak SC, Burwell WBI. 2010. Modeling ecoregional connectivity. In Landscape-scale conservation planning (eds Trombulak SC, Baldwin RF.), pp. 349–367 New York, NY: Springer [Google Scholar]
- 13.Schwartz MK, Mills LS, McKelvey KS, Ruggiero LF, Allendorf FW. 2002. DNA reveals high dispersal synchronizing the population dynamics of Canada lynx. Nature 415, 520–522 (doi:10.1038/415520a) [DOI] [PubMed] [Google Scholar]
- 14.McRae BH, Beier P, Dewald LE, Huynh LY, Keim P. 2005. Habitat barriers limit gene flow and illuminate historical events in a wide-ranging carnivore, the American puma. Mol. Ecol. 14, 1965–1977 (doi:10.1111/j.1365-294x.2005.02571.x) [DOI] [PubMed] [Google Scholar]
- 15.Riley SPD, Pollinger JP, Sauvajot RM, York EC, Bromley C, Fuller TK, Wayne RK. 2006. A southern California freeway is a physical and social barrier to gene flow in carnivores. Mol. Ecol. 15, 1733–1741 (doi:10.1111/j.1365-294X.2006.02907.x) [DOI] [PubMed] [Google Scholar]
- 16.Row JR, Gomez C, Koen EL, Bowman J, Murray DL, Wilson PJ. 2012. Dispersal promotes high gene flow among Canada lynx populations across mainland North America. Conserv. Genet. 13, 1259–1268 (doi:10.1007/s10592-012-0369-3) [Google Scholar]
- 17.Sharma S, Dutta T, Maldonado JE, Wood TC, Panwar HS, Seidensticker J. 2013. Spatial genetic analysis reveals high connectivity of tiger (Panthera tigris) populations in the Satpura–Maikal landscape of Central India. Ecol. Evol. 3, 48–60 (doi:10.1002/ece3.432) [DOI] [PMC free article] [PubMed] [Google Scholar]
- 18.Jhala YV, Qureshi Q, Gopal R, Sinha PR. 2011. Status of the tigers, co-predators, and prey in India. Dehradun, India: National Tiger Conservation Authority, Govt of India. New Delhi, and Wildlife Institute of India [Google Scholar]
- 19.Couvet D. 2002. Deleterious effects of restricted gene flow in fragmented populations. Conserv. Biol. 16, 369–376 (doi:10.1046/j.1523-1739.2002.99518.x.) [Google Scholar]
- 20.Sanderson EW, Jaiteh M, Levy MAK, Redford H, Wannebo AV, Woolmer G. 2002. The human footprint and the last of the wild. BioScience 52, 891–904 (doi:10.1641/0006-3568(2002)052[0891:THFATL]2.0.CO;2) [Google Scholar]
- 21.Woolmer G, Trombulak SC, Ray JC, Doran PJ, Anderson MG, Baldwin RF, Morgan A, Sanderson EW. 2008. Rescaling the human footprint: a tool for conservation planning at an ecoregional scale. Landscape Urban Plan. 87, 42–53 (doi:10.1016/j.landurbplan.2008.04.005) [Google Scholar]
- 22.Ellis EC, Klein Goldewijk K, Siebert S, Lightman D, Ramankutty N. 2010. Anthropogenic transformation of the biomes, 1700 to 2000. Glob. Ecol. Biogeogr. 19, 589–606 (doi:10.1111/j.1466-8238.2010.00540.x) [Google Scholar]
- 23.Slatkin M. 1993. Isolation by distance in equilibrium and non-equilibrium populations. Evolution 47, 267–279 (doi:10.2307/2410134) [DOI] [PubMed] [Google Scholar]
- 24.Slatkin M. 1985. Gene flow in natural populations. Annu. Rev. Ecol. Syst. 16, 393–430 (doi:10.1146/annurev.ecolsys.16.1.393) [Google Scholar]
- 25.Raymond M, Rousset F. 1995. GENEPOP (v. 1.2): population genetics software for exact tests and ecumenicism. J. Hered. 86, 248–249 [Google Scholar]
- 26.Piry S, Alapetite A, Cornuet JM, Paetkau D, Baudouin L, Estoup A. 2004. GENECLASS2: a software for genetic assignment and first-generation migrant detection. J. Hered. 95, 536–539 (doi:10.1093/jhered/esh074) [DOI] [PubMed] [Google Scholar]
- 27.Paetkau D, Slade R, Burden M, Estoup A. 2004. Genetic assignment methods for the direct, real-time estimation of migration rate: a simulation-based exploration of accuracy and power. Mol. Ecol. 13, 55–65 (doi:10.1046/j.1365-294X.2004.02008.x) [DOI] [PubMed] [Google Scholar]
- 28.Wilson GA, Rannala B. 2003. Bayesian inference of recent migration rates using multilocus genotypes. Genetics 163, 1177–1191 [DOI] [PMC free article] [PubMed] [Google Scholar]
- 29.Smith JLD, McDougal C. 1991. The contribution of variance in lifetime reproduction to effective population size in tigers. Conserv. Biol. 5, 484–490 (doi:10.1111/j.1523-1739.1991.tb00355.x) [Google Scholar]
- 30.Beerli P, Felsenstein J. 2001. Maximum likelihood estimation of a migration matrix and effective population sizes in n subpopulations by using a coalescent approach. Proc. Natl Acad. Sci. USA 98, 4563–4568 (doi:10.1073/pnas.081068098) [DOI] [PMC free article] [PubMed] [Google Scholar]
- 31.Driscoll CA, Menotti-Raymond M, Nelson G, Goldstein D, O'Brien SJ. 2002. Genomic microsatellites as evolutionary chronometers: a test in wild cats. Genome Res. 12, 414–423 (doi:10.1101/gr.185702) [DOI] [PMC free article] [PubMed] [Google Scholar]
- 32.Mantel N. 1967. The detection of disease clustering and a generalized regression approach. Cancer Res. 27, 209–220 [PubMed] [Google Scholar]
- 33.Bonnet E, Van de Peer Y. 2002. ZT: a software tool for simple and partial Mantel tests. J. Stat. Softw. 7, 1–12 [Google Scholar]
- 34.Tallmon DA, Koyuk A, Luikart G, Beaumont MA. 2008. Computer programs: ONesAmp: a program to estimate effective population size using approximate Bayesian computation. Mol. Ecol. Resour. 8, 299–301 (doi:10.1111/j.1471-8286.2007.01997.x) [DOI] [PubMed] [Google Scholar]
- 35.Ciofi C, Bruford MW. 1999. Genetic structure and gene flow among Komodo dragon populations inferred by microsatellite loci analysis. Mol. Ecol. 8, S17–S30 (doi:10.1046/j.1365-294X.1999.00734.x) [DOI] [PubMed] [Google Scholar]
- 36.Cornuet JM, Ravigné V, Estoup A. 2010. Inference on population history and model checking using DNA sequence and microsatellite data with the software DIYABC (v1. 0). BMC Bioinformatics 11, 401 (doi:10.1186/1471-2105-11-401) [DOI] [PMC free article] [PubMed] [Google Scholar]
- 37.Faul F, Erdfelder E, Buchner A, Lang A-G. 2009. Statistical power analyses using G*Power 3.1: tests for correlation and regression analyses. Behav. Res. Methods 41, 1149–1160 (doi:10.3758/BRM.41.4.1149.) [DOI] [PubMed] [Google Scholar]
- 38.Kitchener AC, Dugmore AJ. 2000. Biogeographical change in the tiger, Panthera tigris. Anim. Conserv. 3, 113–124 (doi:10.1017/S1367943000000810) [Google Scholar]
- 39.Luo SJ, et al. 2004. Phylogeography and genetic ancestry of tigers (Panthera tigris). PLoS Biol. 2, e442 (doi:10.1371/journal.pbio.0020442) [DOI] [PMC free article] [PubMed] [Google Scholar]
- 40.Kumar D, Raychaudhuri T, Desai M. 1983. The Cambridge economic history of India. Cambridge, UK: Cambridge University Press Archive [Google Scholar]
- 41.Rangarajan M. 1996. Fencing the forest: conservation and ecological change in India's central provinces, 1860–1914. Delhi, India: Oxford University Press [Google Scholar]
- 42.Forsyth J. 1871. The highlands of central India: notes on their forests and wild tribes, natural history and sports. London, UK: Chapman and Hall [Google Scholar]
- 43.Mondol S, Karanth KU, Ramakrishnan U. 2009. Why the Indian subcontinent holds the key to global tiger recovery. PLoS Genet. 5, e1000585 (doi:10.1371/journal.pgen.1000585) [DOI] [PMC free article] [PubMed] [Google Scholar]
- 44.Registrar General, India 2011. Census of India 2011 provisional population totals–India data sheet, Office of the Registrar General Census Commissioner. India: Indian Census Bureau [Google Scholar]
- 45.Girod C, Vitalis R, Leblois R, Freville H. 2011. Inferring population decline and expansion from microsatellite data: a simulation-based evaluation of the Msvar method. Genetics 188, 165–179 (doi:10.1534/genetics.110.121764) [DOI] [PMC free article] [PubMed] [Google Scholar]
- 46.Peery MZ, Kirby R, Reid BN, Stoelting R, Doucet-Bëer E, Robinson S, Vásquez-Carrillo C, Pauli JN, Palsbøll PJ. 2012. Reliability of genetic bottleneck tests for detecting recent population declines. Mol. Ecol. 21, 3403–3418 (doi:10.1111/j.1365-294X.2012.05635.x) [DOI] [PubMed] [Google Scholar]
- 47.Cornuet JM, Luikart G. 1996. Description and power analysis of two tests for detecting recent population bottlenecks from allele frequency data. Genetics 144, 2001–2014 [DOI] [PMC free article] [PubMed] [Google Scholar]
- 48.Garza JC, Williamson EG. 2001. Detection of reduction in population size using data from microsatellite loci. Mol. Ecol. 10, 305–318 (doi:10.1046/j.1365-294x.2001.01190.x) [DOI] [PubMed] [Google Scholar]
- 49.Williamson-Natesan EG. 2005. Comparison of methods for detecting bottlenecks from microsatellite loci. Conserv. Genet. 6, 551–562 (doi:10.1007/s10592-005-9009-5) [Google Scholar]
- 50.Morrissey MB, de Kerckhove DT. 2009. The maintenance of genetic variation due to asymmetric gene flow in dendritic metapopulations. Am. Nat. 174, 875–89 (doi:10.1086/648311) [DOI] [PubMed] [Google Scholar]
- 51.Beerli P. 2004. Effect of unsampled populations on the estimation of population sizes and migration rates between sampled populations. Mol. Ecol. 13, 827–836 (doi:10.1111/j.1365-294X.2004.02101.x) [DOI] [PubMed] [Google Scholar]
- 52.Rubinsztein DC, Amos W, Leggo J, Goodburn S, Jain S, Li SH, Margolis RL, Ross CA, Ferguson-Smith MA. 1995. Microsatellite evolution-evidence for directionality and variation in rate between species. Nat. Genet. 10, 337–43 (doi:10.1038/ng0795-337) [DOI] [PubMed] [Google Scholar]
- 53.Chakraborty R, Kimmel M, Stivers DN, Davison LJ, Deka R. 1997. Relative mutation rates at di-, tri-, and tetranucleotide microsatellite loci. Proc. Natl Acad. Sci. USA. 94, 1041–1046 (doi:10.1073/pnas.94.3.1041) [DOI] [PMC free article] [PubMed] [Google Scholar]
- 54.Seyfert AL, Cristescu ME, Frisse L, Schaack S, Thomas WK, Lynch M. 2008. The rate and spectrum of microsatellite mutation in Caenorhabditis elegans and Daphnia pulex. Genetics 178, 2113–2121 (doi:10.1534/genetics.107.081927) [DOI] [PMC free article] [PubMed] [Google Scholar]
- 55.Tilman D, May RM, Lehman CL, Nowak MA. 1994. Habitat destruction and the extinction debt. Nature 371, 65–66 (doi:10.1038/371065a0) [Google Scholar]
- 56.Holzhauer SIJ, Ekschmitt K, Sander A-C, Dauber J, Wolters V. 2006. Effect of historic landscape change on the genetic structure of the bush-cricket Metrioptera roeseli. Landscape Ecol. 21, 891–899 (doi:10.1007/s10980-005-0438-9) [Google Scholar]
- 57.Orsini L, Corander J, Alasentie A, Hanski I. 2008. Genetic spatial structure in a butterfly metapopulation correlates better with past than present demographic structure. Mol. Ecol. 17, 2629–2642 (doi:10.1111/j.1365-294X.2008.03782.x) [DOI] [PubMed] [Google Scholar]
- 58.Richmond JQ, Reid DT, Ashton KG, Zamudio KR. 2008. Delayed genetic effects of habitat fragmentation on the ecologically specialized Florida sand skink (Plestiodon reynoldsi). Conserv. Genet. 10, 1281–1297 (doi:10.1007/s10592-008-9707-x) [Google Scholar]
- 59.McCoy ED, Richmond JQ, Mushinsky HR, Britt EJ, Godley JS. 2010. Long generation time delays the genetic response to habitat fragmentation in the threatened Florida sand skink. J. Herpetol. 44, 641–644 (doi:10.1670/09-089.1) [Google Scholar]
- 60.Bruner AG, Gullison RE, Rice RE, Da Fonseca GAB. 2001. Effectiveness of parks in protecting tropical biodiversity. Science 291, 125–128 (doi:10.1126/science.291.5501.125) [DOI] [PubMed] [Google Scholar]
- 61.Prugh LR, Hodges KE, Sinclair ARE, Brashares JS. 2008. Effect of habitat area and isolation on fragmented animal populations. Proc. Natl Acad. Sci. USA 105, 20 770–20 775 (doi:10.1073/pnas.0806080105) [DOI] [PMC free article] [PubMed] [Google Scholar]
- 62.Woodroffe R, Ginsberg JR. 1998. Edge effects and the extinction of populations inside protected areas. Science 280, 2126–2128 (doi:10.1126/science.280.5372.2126) [DOI] [PubMed] [Google Scholar]
- 63.Rathore CS, Dubey Y, Shrivastava A, Pathak P, Patil V. 2012. Opportunities of habitat connectivity for tiger (Panthera tigris) between Kanha and Pench national parks in Madhya Pradesh, India. PLoS ONE 7, e39996 (doi:10.1371/journal.pone.0039996) [DOI] [PMC free article] [PubMed] [Google Scholar]
- 64.Ceballos G, Ehrlich PR. 2002. Mammal population losses and the extinction crisis. Science 296, 904–907 (doi:10.1126/science.1069349) [DOI] [PubMed] [Google Scholar]
- 65.Gonzalez A, Lawton JH, Gilbert FS, Blackburn TM, Evans-Freke I. 1998. Metapopulation dynamics, abundance, and distribution in a microecosystem. Science 281, 2045–2047 (doi:10.1126/science.281.5385.2045) [DOI] [PubMed] [Google Scholar]
- 66.Harihar A, Pandav B. 2012. Influence of connectivity, wild prey and disturbance on occupancy of tigers in the human-dominated Western Terai Arc Landscape. PLoS ONE 7, e40105 (doi:10.1371/journal.pone.0040105) [DOI] [PMC free article] [PubMed] [Google Scholar]
- 67.Dutta T, Sharma S, Maldonado JE, Wood TC, Panwar HS, Seidensticker J. In press. Gene flow and demographic history of leopards (Panthera pardus) in the Central Indian Highlands. Evol. Appl. (doi:10.1111/eva.12078) [DOI] [PMC free article] [PubMed] [Google Scholar]