

Abstract
Autophagy is implicated in many functions of mammalian cells such as organelle recycling, survival and differentiation, and is essential for the maintenance of T and B lymphocytes. Here, we demonstrate that autophagy is a constitutive process during T cell development. Deletion of the essential autophagy genes Atg5 or Atg7 in T cells resulted in decreased thymocyte and peripheral T cell numbers, and Atg5-deficient T cells had a decrease in cell survival. We employed functional-genetic and integrative computational analyses to elucidate specific functions of the autophagic process in developing T-lineage lymphocytes. Our whole-genome transcriptional profiling identified a set of 699 genes differentially expressed in Atg5-deficient and Atg5-sufficient thymocytes (Atg5-dependent gene set). Strikingly, the Atg5-dependent gene set was dramatically enriched in genes encoding proteins associated with the mitochondrion. In support of a role for autophagy in mitochondrial maintenance in T lineage cells, the deletion of Atg5 led to increased mitochondrial mass in peripheral T cells. We also observed a correlation between mitochondrial mass and Annexin-V staining in peripheral T cells. We propose that autophagy is critical for mitochondrial maintenance and T cell survival. We speculate that, similar to its role in yeast or mammalian liver cells, autophagy is required in T cells for the removal of damaged or aging mitochondria and that this contributes to the cell death of autophagy-deficient T cells.
Keywords: T cells, cell differentiation and development, transgenic/knockout mice, ATG5, mitochondria
Introduction
Macroautophagy (herein autophagy) is a multistep process by which portions of cytoplasm and/or organelles are sequestered in a double membrane structure (autophagosome) and delivered to lysosomes for degradation.1 Autophagy has been implicated in many cellular functions, including cell survival during starvation and stress, cell death and cellular differentiation.1,2 However, the factors that determine whether the induction of autophagy contributes to cell survival or cell death in specific cell types are incompletely understood.3 The molecular mechanism of autophagosome formation is evolutionarily conserved and requires two ubiquitin-like conjugation systems. One system generates conjugates of the proteins ATG5 and ATG12, which associate with ATG16 and are essential for elongation of the isolation membrane.1,4 The ATG5-ATG12 conjugate has E3 ubiquitin ligase-like activity for the second ubiquitin-like system, the ATG8 (LC3) conjugation system.5 The second system results in the formation of LC3 conjugated to phosphatidylethanolamine (LC3-II), which can be readily differentiated from unconjugated LC3 (LC3-I) based on their electrophoretic mobilities.1 Both systems require the enzyme ATG7, which has E1-like activity.4 Mice deficient in either of the autophagy genes Atg5 or Atg7 die in the first day after birth.6,7
Autophagy plays a critical role in the development and survival of lymphocytes. It has been reported that autophagy contributes to cell death in T cells after growth factor withdrawal.8 Additional studies suggest that autophagy is an important death pathway in T cells lacking FADD activity, caspase-8 or Irgm-1.9,10 However, other studies show that deletion of the autophagy gene Atg5 results in decreased survival of T lymphocytes.11 A similar result is observed in B-1a B cells when Atg5 is deleted in B cells,12 suggesting that autophagy plays a critical survival role in specific subsets of lymphoid cells. In addition, this process is also required in thymic epithelial cells for normal MHC-II peptide presentation and thymocyte selection.13 Because autophagy and autophagy genes have many different roles in regulating the cellular environment, it is unclear how autophagy promotes lymphocyte survival.
One function of autophagy is the degradation of organelles to maintain cellular homeostasis.14,15 Many recent studies have suggested that autophagy is important in the maintenance of mitochondria. Deletion of autophagy genes in yeast or murine liver, β-islet cells, embryonic fibroblasts or macrophages results in the accumulation of damaged mitochondria.7,16-18 Similarly, inhibition of autophagy in mammalian fibroblasts leads to increased mitochondrial mass.19,20 Finally, imaging studies have revealed that opening of the mitochondrial permeability transition pore induces autophagy and the subsequent degradation of depolarized mitochondria.21,22 Together, these studies indicate that autophagy is important for the clearance of damaged mitochondria, which accumulate in the absence of autophagy and can cause alterations in cellular biology.
Here we use three different approaches to study the role of autophagy in T cells in vivo. We demonstrate that autophagy is a constitutive process in developing and mature T cells and that Atg5 and Atg7 are required for thymocyte development and peripheral T cell homeostasis. Using Atg5-deficient T cells and integrative computational analysis, we identify a thymocyte-specific transcriptional signature associated with deficiency of Atg5 in T cells and provide evidence that Atg5 is required for the survival and mitochondrial maintenance of peripheral T cells.
Results
Atg5 and Atg7 are required for the maintenance of developing and mature T lymphocytes
As a first step to understand the role of autophagy in T cells, we measured the levels of LC3-II as one marker of autophagic activity in developing and mature T lineage cells. We sorted thymic and peripheral T lineage subsets and probed the lysates with anti-LC3 antibodies. We observed robust LC3-II bands in all T cell subsets, indicating that autophagy is an active process in all stages of T cell development (Fig. 1A). To confirm that autophagy is an ongoing process in T cells, we cultured thymoyctes for 4 hours in the presence of increasing concentrations of chloroquine. Chloroquine results in an accumulation of LC3-II in actively autophagic cells.23,24 As expected, LC3-II levels increased in a chloroquine dose-dependent manner (Fig. 1B), indicating that autophagy was ongoing in these cells.

Figure 1. Constitutive autophagy in all subsets of wild-type T cells. (A) Lysates from FACS-sorted C57BL/6 thymus cells and MACS-bead sorted peripheral T cells were probed with antibodies against LC3 and β-actin. Representative blot from four independent experiments shown. (B) Lysates from C57BL/6 thymocytes cultured for 4 hours with the indicated concentrations of chloroquine were probed with antibodies against LC3 and β-actin. Representative blot from three independent experiments shown. (C) Lysates from Atg5+/+ or Atg5−/− chimeras or C57BL/6 control thymocytes were probed with antibodies against ATG5, LC3 or β-actin. Representative blot from two independent experiments shown. (D) Lysates from Atg5+/+ and Atg5−/− SV40-transformed murine embryonic fibroblasts and from Atg5F/F Cre+ and Atg5F/F Cre− thymocytes were probed with antibodies against ATG5 and β-actin. Representative blot from three independent experiments shown. (E) Lysates from Atg7F/F Cre+ and Atg7F/F Cre− thymocytes were probed with antibodies against ATG7 and β-actin. Representative blot from two independent experiments shown.
Recent reports indicate that the autophagy gene Atg5 is essential for normal T cell homeostasis,11 however the mechanism by which Atg5 controls T cell survival and/or proliferation remains unknown. To address these issues, we generated two different mouse models to delete Atg5 in T cells. First, we used recombination activating gene (Rag)-1-deficient complementation11,12,25 with E15.5-18.5 fetal liver cells from Atg5−/− or Atg5+/+ embryos.6 We note that mice reconstituted with Atg5−/− fetal liver cells have decreased viability compared to Atg5+/+ reconstituted control mice (Suppl. Fig. 1), however surviving young adult chimera mice appear generally healthy, permitting analysis of T cell development in this model. As an alternative approach, we generated Atg5-deficient T cells by breeding mice with conditionally targeted (floxed) Atg526 alleles to lck-Cre transgenics (Atg5F/F Cre+). In these experiments, Atg5F/F Cre− mice were used as controls.
We first confirmed that T cells from these two mouse systems lack the ATG5 protein. Thymocyte lysates from Atg5−/− chimeras showed no detectable ATG5 protein expression (Fig. 1C). We also were unable to detect LC3-II (Fig. 1C), indicating that autophagy is abrogated in the absence of ATG5 in T cells. ATG5 levels were also reduced in Atg5F/F Cre+ thymocytes (Fig. 1D), however residual levels of the protein were still detectable upon overexposure of the membrane, in spite of efficient recombination of the Atg5Flox locus in thymocytes from Atg5F/F Cre+ mice (Supp. Fig. 2).
We next analyzed the in vivo phenotype of Atg5-deficient T cells. In agreement with a previously published report,11 thymus cellularity of Atg5-deficient chimeric mice analyzed between 6 and 13 weeks post fetal liver transfer was decreased approximately 2.4-fold compared to controls (Table 1), although there were no discernable alterations in the percentages of DN, DP, CD4+ SP and CD8+ SP (Fig. 2). Moreover, both the percentages and total numbers of CD4+ and CD8+ T cells in the lymph nodes and spleens of Atg5−/− chimeric mice were decreased compared to Atg5+/+ chimeras (Fig. 2 and Table 1). A similar reduction in total numbers of thymocytes and peripheral T cells was observed in Atg5F/F Cre+ mice compared to littermate controls (Fig. 2 and Table 1). We conclude that the decrease in T cell numbers is a result of T cell-intrinsic effects of the loss of Atg5.
Table 1. Loss of T cells in Atg5−/−, Atg5F/F Cre+ and Atg7F/F Cre+ mice.
| Atg5 +/+ | Atg5−/− | p value | Atg5F/F Cre− | Atg5F/F Cre+ | p value | Atg7F/F Cre− | Atg7F/F Cre+ | p value | |
|---|---|---|---|---|---|---|---|---|---|
|
Thymus |
160.9 ± 9.9 |
66.8 ± 8.0 |
p < 0.0001 |
165.0 ± 12.2 |
108.7 ± 9.1 |
p = 0.0004 |
155.1 ± 19.8 |
89.8 ± 11.6 |
p = 0.0104 |
| |
(n = 41) |
(n = 44) |
|
(n = 25) |
(n = 29) |
|
(n = 8) |
(n = 9) |
|
|
Lymph Nodes |
|
|
|
|
|
|
|
|
|
|
CD4+ |
13.6 ± 0.9 |
1.3 ± 0.3 |
p < 0.0001 |
9.1 ± 0.9 |
4.3 ± 1.0 |
p = 0.0011 |
7.5 ± 1.5 |
2.3 ± 0.4 |
p = 0.0056 |
| |
(n = 34) |
(n = 37) |
|
(n = 16) |
(n = 20) |
|
(n = 7) |
(n = 7) |
|
|
CD8+ |
7.5 ± 0.6 |
0.9 ± 0.6 |
p < 0.0001 |
5.6 ± 0.6 |
2.1 ± 0.6 |
p = 0.0005 |
5.1 ± 1.1 |
0.6 ± 0.1 |
p = 0.0020 |
| |
(n = 34) |
(n = 37) |
|
(n = 16) |
(n = 20) |
|
(n = 7) |
(n = 7) |
|
|
Spleen |
|
|
|
|
|
|
|
|
|
|
CD4+ |
8.1 ± 0.6 |
1.7 ± 0.2 |
p < 0.0001 |
10.4 ± 4.3 |
4.3 ± 0.6 |
p < 0.0001 |
6.2 ± 0.9 |
3.6 ± 0.7 |
p = 0.0366 |
| |
(n = 37) |
(n = 41) |
|
(n = 20) |
(n = 24) |
|
(n = 7) |
(n = 7) |
|
|
CD8+ |
4.0 ± 0.3 |
2.5 ± 0.4 |
p = 0.0031 |
6.2 ± 0.6 |
3.6 ± 0.4 |
p = 0.0012 |
4.7 ± 0.8 |
1.0 ± 0.3 |
p = 0.0012 |
| (n = 37) | (n = 41) | (n = 20) | (n = 24) | (n = 7) | (n = 7) |
Data are mean ± SEM and represent multiples of 106 cells. The number of mice per group is indicated in parentheses. Chimera mice were analyzed between 6 and 13 weeks post-reconstitution. Atg5F/F Cre mice were analyzed between 6 and 13 weeks of age. Atg7F/F Cre mice were analyzed between 8 and 14 weeks of age.

Figure 2. Loss of T cells in Atg5−/− chimeric, Atg5F/F Cre+ and Atg7F/F Cre+ mice. Single-cell suspensions of thymocytes, splenocytes and lymph node cells were analyzed by flow cytometry as described in Materials and Methods. Cells were gated by forward and side scatter on lymphocyte populations. Shown is one representative experiment from n ≥ 3 experiments, with at least seven mice of each genotype analyzed.
It is possible that other functions of Atg5 apart from its role in autophagy27-29 may contribute to the phenotypic abnormalities of Atg5-deficient T cells. To address this issue, we deleted Atg7, another essential autophagy gene, from T cells using a conditional knockout approach similar to the one used above. We bred mice with conditionally targeted (floxed) Atg77 alleles to lck-Cre transgenics (Atg7F/F Cre+). We observed reduced expression of ATG7 in Atg7F/F Cre+ thymocytes by western blot analysis (Fig. 1E). Similar to Atg5−/− chimeras and Atg5F/F Cre+ mice, total thymocytes and peripheral CD4+ and CD8+ T cell numbers were also reduced in Atg7F/F Cre+ mice (Fig. 2 and Table 1). Together these data indicate that autophagy is required for the maintenance of both developing and peripheral T lymphocytes.
A role for Atg5 in mitochondrial maintenance revealed by integrative computational analysis of whole-genome datasets
To obtain further insights into the functional pathways and networks through which autophagy maintains the T cell compartment, we developed an analytical framework that integrates gene expression analyses of wild-type and Atg5−/− thymocytes from chimeric mice with diverse information extracted from various genomic screens and databases including Gene Ontology (GO)30 for functional classification, HPRD31 for molecular interactions, HomoloGene32 for homology mapping of genes, and NCBI PubMed and MILANO for literature co-citation analyses.32,33 Whole-genome transcriptional profiling of Atg5−/− and Atg5+/+ thymocytes identified a set of 699 differentially expressed genes (of which 259 genes were upregulated and 440 downregulated in Atg5−/− thymocytes, as compared to wild-type thymocytes) (Fig. 3A), permitting us to explore functional clusters within the set of differentially expressed genes and identify putative pathways and networks relevant to Atg5 function in the T lymphoid lineage.

Figure 3.Atg5 is required for the proper regulation of mitochondrial-associated gene sets. (A) Microarray analysis showing genes differentially expressed (p < 0.05), of which 259 genes were induced and 440 downregulated in Atg5−/− thymocytes compared to wild-type thymocytes. Expression values for each probeset were z-score-transformed across all arrays and their intensities above and below the mean are represented on the heatmap by red and green colors respectively, as shown on the color bar. Genes were hierarchically clustered using Cluster 3.0 and visualized with Java TreeView. Tick markings highlight 64 differentially expressed mitochondrial genes, whose expression profiles are displayed by the heatmap on the right. (B) Differentially expressed genes were classified into gene ontology (GO) cellular component categories. Categories assigned with at least 3 genes are displayed as a pie chart, with enrichment p-values shown in brackets alongside each category. The bar chart displays enrichment p-values as negative log-transformed values, which reveals a dramatic enrichment of mitochondria- and nucleus-associated genes. (C) Construction of human protein-protein interaction (interolog) network. Differentially expressed genes were mapped onto human orthologs for which interaction data was available. Circles representing upregulated components are colored red and downregulated components green. Solid lines denote protein-protein interactions. Mitochondrion-anchored subnetworks (highlighted by the yellow region) emerged when extending connections by an additional degree of separation, capturing components of interest (blue circles) in the functional neighborhood of mitochondrial-related genes that were found to be differentially expressed. Network clusters containing connections between at least 3 components are displayed. (D) Diagrammatic mitochondrion representation showing key differentially expressed gene products participating in mitochondria-associated processes. Red and green ovals denote differentially up and downregulated components respectively. Functional associations with biological processes are represented by dashed lines.
To ascertain whether the Atg5-dependent gene set was statistically enriched for genes implicated in subcellular compartment-associated processes, we first analyzed their annotations in Gene Ontology (GO) cellular component categories. Strikingly, the Atg5-dependent gene set was dramatically enriched in genes encoding proteins associated with the mitochondrion (p = 3.7 × 10⁻⁴) and nucleus (p = 1.6 × 10⁻⁴) (Fig. 3B). The mitochondrion GO signature was particularly interesting given the suggested association between autophagy and mitochondrial maintenance. We identified 64 mitochondrial-associated genes in the Atg5-dependent gene set (Fig. 3A) from GO annotation and a recent comprehensive genome-wide survey of genes participating in mitochondrial-associated processes.34 This Atg5-dependent gene set GO signature strongly suggests a role for Atg5 in mitochondrial function and/or maintenance.
As an additional computational strategy to elucidate potential connections of Atg5 with mitochondrial function, we projected the Atg5-dependent gene set onto human orthologs and generated a human protein-protein interaction (interolog) network (Fig. 3C). The network was built by interrogating data from the HPRD database which contains protein-protein interactions from the literature and from multiple large-scale interactome datasets. We next intersected this network analysis with GO cellular compartment annotations. This approach yielded mitochondrion-anchored subnetworks which we then extended by an additional degree of separation, thereby including non-Atg5-dependent gene set proteins that interacted with mitochondrion-associated Atg5-dependent gene set-encoded products. We observed that many of these interacting partners are also annotated as mitochondrial related, further supporting the involvement of an enriched subset of Atg5-dependent gene set in mitochondrial processes.
We present a diagrammatic summary of the key mitochondrial-associated Atg5-dependent genes in Figure 3D, assembled from gene ontology annotations, network data, pathway information and literature (PubMed) co-citation analysis incorporating search terms such as ‘mitochondrial biogenesis,’ ‘mitochondrial permeability’ and ‘electron transport’ (Suppl. Fig. 3A) to gain additional insights into various mitochondrial processes or events in which the Atg5-dependent gene set might be involved. We extended this analysis to include other terms associated with various general cellular processes (e.g., endocytosis) and also events specific to T lineage cells and immune function (Suppl. Fig. 3B).
Notably, this analysis revealed described associations in the generation of reactive oxygen species (ROS), lymphocyte activation and lymphocyte proliferation (Suppl. Fig. 3B) in the context of potential functions of Atg5 in T lineage cells. Consistent with the requirement of Atg5 in the formation of autophagosomal structures in T cells, our analyses also revealed a connection of Atg5 with phagocytosis, endocytosis and lysosome formation/function (Suppl. Fig. 3B and ref. 28). Taken together, these transcriptional profiling and computational analyses of orthogonal data, ranging from gene coregulation to protein-protein interaction network with pathway analysis, suggest a role for Atg5 in mitochondrial maintenance and function.
Survival and proliferation defects in Atg5-deficient T cells
Given these transcriptional alterations in Atg5-deficient T cells, we further characterized the T cells that develop in the absence of Atg5. The expression of the maturation marker CD24 (HSA) was similar between wild-type and Atg5-deficient T cells, indicating that peripheral Atg5-deficient T cells were phenotypically mature. Strikingly, however, we observed an alteration in the expression of markers associated with activation/memory/homeostatic expansion, CD44 and CD62L (Fig. 4A and B). While the majority of wild-type lymph node and splenic T cells were CD62Lhigh CD44low, Atg5-deficient T cells were predominantly CD44high and CD62Llow. Peripheral T cells from Atg7F/F Cre+ mice had a similar expression profile for CD44 and CD62L (data not shown). Increased cell surface expression of CD44 and decreased expression of CD62L have been reported in T cells undergoing homeostatic expansion.35-39 Importantly, expression levels of T cell antigen receptor did not appear altered in the Atg5-deficient T cells, nor were there significant differences in the expression of the early activation markers CD25 and CD69 (Fig. 4A), consistent with the hypothesis that Atg5-deficient T cells may be responding to homeostatic rather than antigen-induced expansion signals.40

Figure 4. A higher percentage of T cells are CD44high, CD62Llow and Annexin-V+ in Atg5−/− chimeras and Atg5F/F Cre+ mice compared to controls. (A and B) Flow cytometric analysis of lymph node T lymphocytes from Atg5+/+ or Atg5−/− chimeric mice (A) or Atg5F/F Cre− and Atg5F/F Cre+ mice (B). Cells were gated by forward and side scatter for lymphocytes, then gated on CD4+ or CD8+ cells. One representative experiment shown of at least five independent experiments. (C and D) Lymph node T cells from Atg5+/+ or Atg5−/− chimeric mice (C) or Atg5F/F Cre− or Atg5F/F Cre+ mice (D) were stained with Annexin-V and antibodies against CD4, CD8 and CD62L. Cells were gated by forward and side scatter for lymphocytes, then gated on CD4+ or CD8+ cells. Data pooled from at least four independent experiments. (*p < 0.05, **p < 0.005, ***p < 0.0005, n.s. = not statistically significant).
T cells in lymphopenic mice undergo multiple rounds of proliferation in order to reach peripheral homeostasis.41 The decreased number of peripheral T cells together with a surface phenotype indicative of homeostatic expansion suggest that Atg5-deficient T cells may be unable to populate the peripheral lymphoid organs, possibly due to survival defects, resulting in a compensatory proliferative response. Consistent with this view, we found that freshly isolated T cells from Atg5−/− chimeras contained a significant proportion of cells undergoing death as indicated by Annexin-V staining among both the CD62Llow and CD62Lhigh populations. Compared to wild-type cells, the proportion of Annexin-V+ cells was 1.5- to 2-fold higher in CD62Llow Atg5-deficient T cells, and 3- to 7-fold higher in CD62Lhigh Atg5-deficient T cells (Fig. 4C). Annexin-V staining was also elevated in CD62Lhigh populations of Atg5F/F Cre+ T cells (Fig. 4D). These data indicate the requirement for Atg5 in the survival of T lymphocytes.
Consistent with the results of Pua et al.11 Atg5-deficient T cells exhibited a severe defect in TCR-induced proliferation (Fig. 5). We purified CD62Lhigh T lymphocytes from control and Atg5−/− chimeras, labeled them with CFSE, stimulated them with anti-CD3 and anti-CD28 antibodies, and analyzed proliferation at 72 hours. We also measured blast formation using T cells stimulated with anti-CD3 and anti-CD28 antibodies for 40 hours. We observed a severe reduction in proliferation and the ability to form blasts in Atg5-deficient T cell cultures compared to controls (Fig. 5). We conclude that Atg5 is important for T cell survival and proliferation after antigen receptor stimulation.
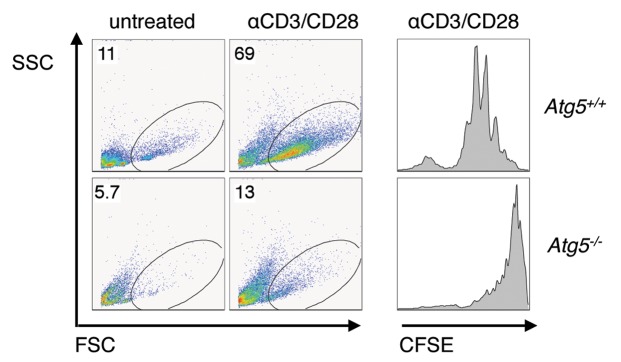
Figure 5. Proliferation defect in Atg5-deficient T lymphocytes. Purified CD62Lhigh T cells from Atg5+/+ or Atg5−/− chimeric mice were either untreated or stimulated with anti-CD3 (1 µg/mL) and anti-CD28 (1 µg/mL) and analyzed 40 hours later for T cell blasts (left panels) or loaded with CFSE, stimulated as above, and analyzed 72 hours later (right panel). Shown is one representative experiment of three. CD4+ cells shown.
Increased mitochondrial mass in Atg5-deficient T lymphocytes
Our transcriptional profiling analyses of Atg5-deficient T cells raised the possibility that the defects in T cell homeostasis observed in the absence of Atg5 are due to impaired mitochondrial function. To determine if mitochondria were normal in the absence of Atg5, we analyzed mitochondrial mass/volume in single cells using the vital dye Mitotracker green, a mitochondrial specific dye. We observed an increase in Mitotracker staining in Atg5-deficient splenic CD4+ and CD8+ T cells from both Atg5−/− chimeric and Atg5F/F Cre+ mice relative to controls (Fig. 6A and data not shown). The Mitotracker staining of thymocytes from Atg5−/− chimeras was similar to wild-type cells, suggesting that the increase in mitochondrial mass occurred as the T cells aged (data not shown).

Figure 6.Atg5-deficient T lymphocytes have an increase in mitochondrial mass. (A) Splenocytes from Atg5F/F Cre+ and Atg5F/F Cre− mice were loaded with MitoTracker green, stained with antibodies against CD4 or CD8, and analyzed by flow cytometry. Analysis was performed on CD4+ or CD8+ splenocytes without gating by forward and side scatter. Shown are representative FACS plots of at least fifteen mice of each genotype and the quantation of the mean fluorescence intensity (MFI) of Mitotracker staining from one of three independent experiments. (B) Splenocytes from Atg5F/F Cre+ and Atg5F/F Cre− mice were stained with CD4, CD8, Mitotracker green, and Annexin-V. Representative FACS plots and quantitation of the percentage of Annexin-V+ cells from the Mitotrackerhigh and Mitotrackerlow gates are shown. Analysis was performed on CD4+ or CD8+ splenocytes without gating by forward and side scatter. Data pooled from three independent experiments. (*p < 0.05, **p < 0.005, ***p < 0.0005, n.s. = not statistically significant).
We next asked if alterations in mitochondrial mass correlated with the decrease in cell survival in Atg5-deficient T cells. We costained splenocytes from Atg5F/F Cre+ and Atg5F/F Cre− mice with Mitotracker green and Annexin-V. CD4+ and CD8+ T cells that were Mitotrackerhigh had a significantly higher percentage of cells that were Annexin-V+ compared to Mitotrackerlow T cells (Fig. 6B). Although this trend was apparent in both Atg5F/F Cre+ and Atg5F/F Cre− mice, there was an increase of approximately 15% in the percentage of Annexin-V+ cells within the Mitotrackerhigh population in Atg5F/F Cre+ mice (Fig. 6B). These data show that mitochondrial mass correlates with Annexin-V staining in CD4+ and CD8+ T cells, suggesting that the increase in mitochondrial mass in Atg5-deficient T cells correlates with increased death in these cells.
Discussion
Our data suggests that autophagy is an active process during all stages of T lymphocyte development and that deletion of the essential autophagy genes, Atg5 and Atg7, results in profound abnormalities in T cell maintenance. In addition, we showed that Atg5 is important for T cell survival. Transcriptional profiling of Atg5-deficient thymocytes suggests abnormalities in mitochondria in the absence of this autophagy gene. This hypothesis is supported by studies indicating that there is an increase in mitochondrial mass in peripheral Atg5-deficient T cells. Mitochondrial mass is correlated with Annexin-V staining of peripheral T cells, suggesting a link between mitochondrial abnormalities and Atg5-deficient T cell death. Given our gene chip and mitochondrial mass results, we propose that autophagy is required in T lymphocytes for normal mitochondrial maintenance.
Although dramatic mitochondria-related transcriptional changes were observed in thymocytes, we did not observe an increase in mitochondrial mass in Atg5-deficient thymocytes, but only in peripheral Atg5-deficient T cells. Despite the two-fold decrease in thymus cellularity in Atg5−/− chimeras, we also did not observe an increase in Annexin-V staining in the thymus, consistent with a previous report.11 We hypothesize that we are unable to detect mitochondrial abnormalities because the cells have not yet accumulated sufficient damaged mitochondria to die. Alternatively, the actively phagocytic cells of the thymus responsible for the normal elimination of thymocytes that have failed the selection process42 may be quickly removing those Atg5-deficient thymocytes that have accumulated damaged mitochondria. It is interesting that the transcriptional signature observed here for Atg5-deficient thymocytes is quite distinct from the signature observed in either Paneth cells or thymocytes cells that express lower than normal levels of ATG16L1.43 This suggests that the transcriptional response to autophagy gene-deficiency may differ depending on the primary cell type involved. This is important since it may explain potential differences in the role of autophagy genes in closely related cells.12
We utilized three different approaches in this study to address the importance of autophagy genes in T lineage cells. In the first approach, Rag1−/− complementation, analysis of Atg5−/− T cells is potentially complicated due to the decrease in viability of Atg5−/− chimeras and the deletion of Atg5 in other hematopoietic cell types in addition to T cells, resulting in defects in other cell lineages.12 By using a conditional knockout approach we ascertained that Atg5 is required within T cells for their maintenance in vivo. Our western blot results suggest that deletion of the Atg5flox alleles may be incomplete in some cells or that the ATG5 protein may be retained for a significant time after gene deletion. Despite these caveats, given that the in vivo phenotypes of Atg5−/−, Atg5F/F Cre+ and Atg7F/F Cre+ T cells are similar, it is likely that these phenotypes are due to the lack of autophagy in T cells, and not due to nonautophagy functions of Atg527 or Atg7. However, since ATG7 is essential for the conjugation of ATG5 to ATG12,4,44 it is possible that a nonautophagy role of the ATG5-12 conjugate is responsible. Further studies will be necessary to distinguish between these possibilities.
Materials and Methods
Mice and cells
The generation of Atg5−/−, Atg5F/F and Atg7F/F mice has been previously described.6,7,26 Chimeric mice were generated by reconstituting sublethally irradiated B6.129S7-Rag1tm1Mom/J (Rag1−/−, The Jackson Laboratory, #002216) mice with Atg5+/+ or Atg5−/− fetal liver cells, as previously described.12 Atg5F/F and Atg7F/F were bred to lck-Cre (C57BL/6NTac-TgN(Lck-Cre)) transgenic mice (Taconic, #004197, Hudson, New York). Mice were maintained at Washington University School of Medicine in accordance with institutional policies for animal care and usage. Atg5−/− and Atg5+/+ embryonic fibroblasts were generated from day 13.5 embryos. To establish immortalized cell lines, 106 cells were transformed with 1ug of pEF321-T, an SV40 large T antigen expression vector (a gift from T. Hansen), by the FuGENE HD transfection reagent (Roche, Basel, Switzerland) according to the manufacturer’s instructions.
Genotyping
Genotyping of the mice was performed as described,7,26 with the Cre gene detected with primers cre1 (AGG TTC GTT CAC TCA TGG A) and cre2 (TCG ACC AGT TTA GTT ACC C) using PCR [94°C (4 minutes); 25 cycles of 94°C (30 sec), 60°C (30 sec), 72°C (1 minutes); 72°C (5 minutes)]. The Atg5 gene was detected with the primers exon3-1 (GAA TAT GAA GGC ACA CCC CTG AAA TG), short2 (GTA CTG CAT AAT GGT TTA ACT CTT GC), and check2 (ACA ACG TCG AGC ACA GCT GCG CAA GG) using PCR [94°C (4 minutes); 30 cycles of 94°C (30 sec), 60°C (30 sec), 72°C (1 minutes); 72°C (5 minutes)]. The same PCR program was used with the primers short2, check2 and 5L2 (CAG GGA ATG GTG TCT CCC AC) to check for the Atg5flox and deleted Atg5flox alleles in thymocytes from Atg5F/F Cre+ and Atg5F/F Cre− mice. The Atg7flox gene was detected with primers Hind-Fw (TGG CTG CTA CTT CTG CAA TGA TGT) and Pst-Rv (CAG GAC AGA GAC CAT CAG CTC CAC) using PCR [94°C (5 minutes); 30 cycles of 94°C (20 sec), 68°C (30 sec), 72°C (90 sec); 72°C (10 minutes)]. Confirmation of the wild-type Atg7 locus was done with primers Ex14 F (TCT CCC AAG ACA AGA CAG GGT GAA) and Ex14 R (AAG CCA AAG GAA ACC AAG GGA GTG) using PCR [94°C (5 minutes); 35 cycles of 94°C (20 sec), 60°C (15 sec), 72°C (60 sec); 72°C (10 minutes)].
Stimulation and proliferation assays
Single cell suspensions from the spleens and lymph nodes of chimeric mice were first B cell depleted using negative selection with anti-B220-Dynal beads (Invitrogen, Carlsbad, California), followed by positive selection for CD62Lhigh lymphocytes. Briefly, cells were incubated with biotin-conjugated anti-CD62L antibody (Caltag, Carlsbad, California) followed by antibiotin MACs beads (Miltenyi Biotec, Auburn, California) and isolated according to the manufacturer’s instructions. CD62Lhigh purities were greater than 90%. T cells were plated at 1 × 10⁶/mL in complete media (DMEM (Gibco, Carlsbad, California) plus 10% fetal calf serum (FCS), 100 Units/mL penicillin, 100 ug/mL streptomycin, 1 mM sodium pyruvate, 2 mM L-glutamine, 1× non-essential amino acids (Gibco, Carlsbad, California) and 57 uM β-mercaptoethanol). Cells were stimulated with 1.0 μg/mL anti-CD3 and 1.0 μg/mL anti-CD28 (BD Biosciences, San Jose, California). To label cells with CFSE, cells were incubated with 1 μM CFSE (Invitrogen, Carlsbad, California) for 30 minutes at 37°C and then washed in complete media. Labeled cells were cultured with the indicated stimuli for 72 hours and then analyzed by flow cytometry.
Flow cytometry and cell sorting
Single cell suspensions were prepared from the spleens, thymus, and lymph nodes and stained with antibodies recognizing TCRβ, CD4, CD8, CD24, CD25, CD44, CD62L and CD69 (BD Biosciences, San Jose, California). Annexin-V labeling was performed by surface staining cells with the indicated lineage markers, washing with complete media, and staining for 15 minutes with Annexin-V (BD Biosciences, San Jose, California). Thymocytes were sorted on a FACS Vantage SE (BD Biosciences, San Jose, California) by FSC/SSC gating on a live lymphocyte population, followed by gating out CD11b+, CD11c+ and B220+ cells. The remaining cells were then sorted based on expression of CD4 and CD8. Purities were greater than 94% for each population (n = 4 independent experiments). Peripheral CD4+ and CD8+ T cells were isolated using negative selection by MACS magnetic bead sorting according to the manufacturer’s instructions (Miltenyi Biotec, Auburn, California). Peripheral T cells were negatively selected from pooled spleen and lymph node samples, followed by negative selection against either CD4+ or CD8+ cells. Purities averaged 86% for CD4+ cells and 92% for CD8+ cells (n = 4 independent experiments).
Statistics
All non-gene chip data were analyzed with Prism software (Graphpad; San Diego, California), using two-tailed unpaired Student’s t tests.
Western blotting
Cells were washed with PBS and then lysed in cold NP-40 lysis buffer [0.5% NP-40, 50 mM Tris-Cl, 150 mM NaCl, 1 mM EDTA, 1 mM phenylmethylsulfonyl fluoride] or cold lysis buffer B [50 mM Tris-HCl pH 8.0, 150 mM NaCl, 1% Triton X-100, 0.1% SDS, 0.2% deoxycholic acid sodium salt] supplemented with complete pretease inhibitors (Roche, Basel, Switzerland) for 10 mininutes at 4°C. Lysates were cleared by centrifugation at 14,000 x g for 10 minutes at 4°C. Samples were analyzed by western blotting12 using antibodies against ATG5 (Novus Biologicals, Littleton, Colorado, and Nanotools, Teningen, Germany), ATG7 (Sigma, St. Louis, Missouri), LC3 (Novus Biologicals, Littleton, Colorado) and β-actin (Sigma, St. Louis, Missouri).
Mitochondria mass/volume assay. Cells were loaded with 100 nM MitoTracker Green (Invitrogen, Carlsbad, California) for 30 minutes at 37°C in the presence of flourochome-conjugated antibodies against CD4 and CD8. Cells were washed and then analyzed by flow cytometry. When necessary, Annexin-V was added after washing the cells in complete media.
Microarrays and analysis
Total thymocyte RNA was harvested from Atg5−/− and Atg5+/+ chimeras by lysing single cell suspensions of thymocytes in Trizol (Invitrogen, Carlsbad, California). RNA analyses were performed at the microarray core facility at the Harvard Medical School and Partners Healthcare Center for Genetics and Genomics. The quantity, purity and integrity of RNA were evaluated by UV spectrophotometry and RNA-nano Bioanalyzer (Agilent, Santa Clara, California). Sample processing and hybridization on Mouse Genome 430 2.0 GeneChip microarrays (Affymetrix, Santa Clara, California) were performed according to manufacturer’s instructions. Probe-level normalization of the raw CEL data files using the GC Robust Multi-array Average (GCRMA) algorithm45 was implemented in the R programming language. Two-sided t-test was performed for each probeset, comparing between Atg5−/− and Atg5+/+ chimera samples. Probesets with p < 0.05 were considered differentially expressed. Hierarchical clustering (pairwise complete-linkage) of probesets corresponding to differentially expressed genes was performed with Cluster 3.0,46 using the Pearson’s correlation coefficient as the similarity metric. Z-score transformation was applied to each probeset across all arrays prior to generating ‘heatmaps’ for visualization implemented in the Python language.
Gene ontology (GO) analysis
Differentially expressed genes were examined in terms of GO cellular component categories.30 To assess enrichment of these categories within the set of differentially expressed genes against all genes represented by probes on the Affymetrix Mouse Genome 430 2.0 microarray GeneChip, p-values were computed using Fisher’s exact test implemented in Python and R programming languages. Categories with p < 0.05 were considered significantly enriched.
Protein interaction network
The network was constructed by iteratively connecting interacting proteins, with data extracted from a collection of genome-wide interactome screens and curated literature entries in HPRD.31 The network uses graph theoretic representations, which abstract components (gene products) as nodes and relationships (e.g., interactions) between components as edges, implemented in the Perl programming language.
Literature co-citation analysis
Co-citation analysis was performed using Milano search,33 identifying the number of times a gene was co-cited with a specified term in articles from the PubMed database. Vectors capturing the co-citation profiles for each of these genes were generated for a set of terms and clustered using pairwise complete-linkage hierarchical clustering with the Pearson’s correlation coefficient as the similarity measure. The results were displayed as a heatmap implemented in the Python language.
Supplementary Material
Acknowledgments
Financial support for this work was provided by NIH grants P30-AR048335 and R01-AI061077 (W.S.), CA74730 and U54A1057160 (H.W.V), R01-AI062773 and R01-DK83756 (R.X.), 5-T32-AI07163-27 (L.M.S.), Grants-in-Aid for Scientific Research from the Ministry of Education, Culture, Sports, Science and Technology, Japan, and the Toray Science Foundation (N.M). A. N. is a recipient of a fellowship award from the Crohn’s and Colitis Foundation of America. K.C. is the Lallage Feazel Wall Fellow of the Damon Runyon Cancer Research Foundation, DRG-1972-08.
We thank David Strong and Boris Calderon for assistance with the generation of chimeric mice. We also thank Suzanne Schloemann of the Department of Pathology and Immunology’s Flow Cytometry Center for assistance with cell sorting. We thank Heather H. Pua and You-Wen He for the Atg7 wild-type genotyping protocol.
Disclosure of Potential Conflicts of Interest
No potential conflicts of interest were disclosed.
Supplemental Materials
Supplementary materials can be found at: www.landesbioscience.com/journals/autophagy/article/8133
Footnotes
Previously published online: www.landesbioscience.com/journals/autophagy/article/8133
References
- 1.Levine B, Kroemer G. Autophagy in the pathogenesis of disease. Cell. 2008;132:27–42. doi: 10.1016/j.cell.2007.12.018. [DOI] [PMC free article] [PubMed] [Google Scholar]
- 2.Mizushima N, Levine B, Cuervo AM, Klionsky DJ. Autophagy fights disease through cellular self-digestion. Nature. 2008;451:1069–75. doi: 10.1038/nature06639. [DOI] [PMC free article] [PubMed] [Google Scholar]
- 3.Kroemer G, Levine B. Autophagic cell death: the story of a misnomer. Nat Rev Mol Cell Biol. 2008;9:1004–10. doi: 10.1038/nrm2529. [DOI] [PMC free article] [PubMed] [Google Scholar]
- 4.Mizushima N, Ohsumi Y, Yoshimori T. Autophagosome formation in mammalian cells. Cell Struct Funct. 2002;27:421–9. doi: 10.1247/csf.27.421. [DOI] [PubMed] [Google Scholar]
- 5.Hanada T, Noda NN, Satomi Y, Ichimura Y, Fujioka Y, Takao T, et al. The Atg12-Atg5 conjugate has a novel E3-like activity for protein lipidation in autophagy. J Biol Chem. 2007;282:37298–302. doi: 10.1074/jbc.C700195200. [DOI] [PubMed] [Google Scholar]
- 6.Kuma A, Hatano M, Matsui M, Yamamoto A, Nakaya H, Yoshimori T, et al. The role of autophagy during the early neonatal starvation period. Nature. 2004;432:1032–6. doi: 10.1038/nature03029. [DOI] [PubMed] [Google Scholar]
- 7.Komatsu M, Waguri S, Ueno T, Iwata J, Murata S, Tanida I, et al. Impairment of starvation-induced and constitutive autophagy in Atg7-deficient mice. J Cell Biol. 2005;169:425–34. doi: 10.1083/jcb.200412022. [DOI] [PMC free article] [PubMed] [Google Scholar]
- 8.Li C, Capan E, Zhao Y, Zhao J, Stolz D, Watkins SC, et al. Autophagy is induced in CD4+ T cells and important for the growth factor-withdrawal cell death. J Immunol. 2006;177:5163–8. doi: 10.4049/jimmunol.177.8.5163. [DOI] [PubMed] [Google Scholar]
- 9.Bell BD, Leverrier S, Weist BM, Newton RH, Arechiga AF, Luhrs KA, et al. FADD and caspase-8 control the outcome of autophagic signaling in proliferating T cells. Proc Natl Acad Sci U S A. 2008;105:16677–82. doi: 10.1073/pnas.0808597105. [DOI] [PMC free article] [PubMed] [Google Scholar]
- 10.Feng CG, Zheng L, Jankovic D, Báfica A, Cannons JL, Watford WT, et al. The immunity-related GTPase Irgm1 promotes the expansion of activated CD4+ T cell populations by preventing interferon-gamma-induced cell death. Nat Immunol. 2008;9:1279–87. doi: 10.1038/ni.1653. [DOI] [PMC free article] [PubMed] [Google Scholar]
- 11.Pua HH, Dzhagalov I, Chuck M, Mizushima N, He YW. A critical role for the autophagy gene Atg5 in T cell survival and proliferation. J Exp Med. 2007;204:25–31. doi: 10.1084/jem.20061303. [DOI] [PMC free article] [PubMed] [Google Scholar]
- 12.Miller BC, Zhao Z, Stephenson LM, Cadwell K, Pua HH, Lee HK, et al. The autophagy gene ATG5 plays an essential role in B lymphocyte development. Autophagy. 2007;4:309–14. doi: 10.4161/auto.5474. [DOI] [PubMed] [Google Scholar]
- 13.Nedjic J, Aichinger M, Emmerich J, Mizushima N, Klein L. Autophagy in thymic epithelium shapes the T-cell repertoire and is essential for tolerance. Nature. 2008;455:396–400. doi: 10.1038/nature07208. [DOI] [PubMed] [Google Scholar]
- 14.Bellu AR, Komori M, van der Klei IJ, Kiel JA, Veenhuis M. Peroxisome biogenesis and selective degradation converge at Pex14p. J Biol Chem. 2001;276:44570–4. doi: 10.1074/jbc.M107599200. [DOI] [PubMed] [Google Scholar]
- 15.Kissová I, Deffieu M, Manon S, Camougrand N. Uth1p is involved in the autophagic degradation of mitochondria. J Biol Chem. 2004;279:39068–74. doi: 10.1074/jbc.M406960200. [DOI] [PubMed] [Google Scholar]
- 16.Zhang Y, Qi H, Taylor R, Xu W, Liu LF, Jin S. The role of autophagy in mitochondria maintenance: characterization of mitochondrial functions in autophagy-deficient S. cerevisiae strains. Autophagy. 2007;3:337–46. doi: 10.4161/auto.4127. [DOI] [PubMed] [Google Scholar]
- 17.Ebato C, Uchida T, Arakawa M, Komatsu M, Ueno T, Komiya K, et al. Autophagy is important in islet homeostasis and compensatory increase of beta cell mass in response to high-fat diet. Cell Metab. 2008;8:325–32. doi: 10.1016/j.cmet.2008.08.009. [DOI] [PubMed] [Google Scholar]
- 18.Tal MC, Sasai M, Lee HK, Yordy B, Shadel GS, Iwasaki A. Absence of autophagy results in reactive oxygen species-dependent amplification of RLR signaling. Proc Natl Acad Sci USA. 2009;106:2770–5. doi: 10.1073/pnas.0807694106. [DOI] [PMC free article] [PubMed] [Google Scholar]
- 19.Wang Y, Singh R, Massey AC, Kane SS, Kaushik S, Grant T, et al. Loss of macroautophagy promotes or prevents fibroblast apoptosis depending on the death stimulus. J Biol Chem. 2008;283:4766–77. doi: 10.1074/jbc.M706666200. [DOI] [PMC free article] [PubMed] [Google Scholar]
- 20.Zhang H, Bosch-Marce M, Shimoda LA, Tan YS, Baek JH, Wesley JB, et al. Mitochondrial autophagy is an HIF-1-dependent adaptive metabolic response to hypoxia. J Biol Chem. 2008;283:10892–903. doi: 10.1074/jbc.M800102200. [DOI] [PMC free article] [PubMed] [Google Scholar] [Retracted]
- 21.Rodriguez-Enriquez S, Kim I, Currin RT, Lemasters JJ. Tracker dyes to probe mitochondrial autophagy (mitophagy) in rat hepatocytes. Autophagy. 2006;2:39–46. doi: 10.4161/auto.2229. [DOI] [PMC free article] [PubMed] [Google Scholar]
- 22.Elmore SP, Qian T, Grissom SF, Lemasters JJ. The mitochondrial permeability transition initiates autophagy in rat hepatocytes. FASEB J. 2001;15:2286–7. doi: 10.1096/fj.01-0206fje. [DOI] [PubMed] [Google Scholar]
- 23.Shintani T, Klionsky DJ. Autophagy in health and disease: a double-edged sword. Science. 2004;306:990–5. doi: 10.1126/science.1099993. [DOI] [PMC free article] [PubMed] [Google Scholar]
- 24.Klionsky DJ, Abeliovich H, Agostinis P, Agrawal DK, Aliev G, Askew DS, et al. Guidelines for the use and interpretation of assays for monitoring autophagy in higher eukaryotes. Autophagy. 2008;4:151–75. doi: 10.4161/auto.5338. [DOI] [PMC free article] [PubMed] [Google Scholar]
- 25.Stephenson LM, Sammut B, Graham DB, Chan-Wang J, Brim KL, Huett AS, et al. DLGH1 is a negative regulator of T-lymphocyte proliferation. Mol Cell Biol. 2007;27:7574–81. doi: 10.1128/MCB.00439-07. [DOI] [PMC free article] [PubMed] [Google Scholar]
- 26.Hara T, Nakamura K, Matsui M, Yamamoto A, Nakahara Y, Suzuki-Migishima R, et al. Suppression of basal autophagy in neural cells causes neurodegenerative disease in mice. Nature. 2006;441:885–9. doi: 10.1038/nature04724. [DOI] [PubMed] [Google Scholar]
- 27.Codogno P, Meijer AJ. Atg5: more than an autophagy factor. Nat Cell Biol. 2006;8:1045–7. doi: 10.1038/ncb1006-1045. [DOI] [PubMed] [Google Scholar]
- 28.Sanjuan MA, Dillon CP, Tait SW, Moshiach S, Dorsey F, Connell S, et al. Toll-like receptor signalling in macrophages links the autophagy pathway to phagocytosis. Nature. 2007;450:1253–7. doi: 10.1038/nature06421. [DOI] [PubMed] [Google Scholar]
- 29.Zhao Z, Fux B, Goodwin M, Dunay IR, Strong D, Miller BC, et al. Autophagosome-independent essential function for the autophagy protein Atg5 in cellular immunity to intracellular pathogens. Cell Host Microbe. 2008;4:458–69. doi: 10.1016/j.chom.2008.10.003. [DOI] [PMC free article] [PubMed] [Google Scholar]
- 30.The Gene Ontology Consortium. The Gene Ontology project in 2008. Nucleic Acids Res. 2008;36:440–4. doi: 10.1093/nar/gkm883. [DOI] [PMC free article] [PubMed] [Google Scholar]
- 31.Mishra GR, Suresh M, Kumaran K, Kannabiran N, Suresh S, Bala P, et al. Human protein reference database--2006 update. Nucleic Acids Res. 2006;34(Database issue):D411–4. doi: 10.1093/nar/gkj141. [DOI] [PMC free article] [PubMed] [Google Scholar]
- 32.Wheeler DL, Barrett T, Benson DA, Bryant SH, Canese K, Chetvernin V, et al. Database resources of the National Center for Biotechnology Information. Nucleic Acids Res. 2008;36:D13–21. doi: 10.1093/nar/gkm1000. [DOI] [PMC free article] [PubMed] [Google Scholar]
- 33.Rubinstein R, Simon I. MILANO--custom annotation of microarray results using automatic literature searches. BMC Bioinformatics. 2005;6:12. doi: 10.1186/1471-2105-6-12. [DOI] [PMC free article] [PubMed] [Google Scholar]
- 34.Calvo S, Jain M, Xie X, Sheth SA, Chang B, Goldberger OA, et al. Systematic identification of human mitochondrial disease genes through integrative genomics. Nat Genet. 2006;38:576–82. doi: 10.1038/ng1776. [DOI] [PubMed] [Google Scholar]
- 35.Clarke SR, Rudensky AY. Survival and homeostatic proliferation of naive peripheral CD4+ T cells in the absence of self peptide:MHC complexes. J Immunol. 2000;165:2458–64. doi: 10.4049/jimmunol.165.5.2458. [DOI] [PubMed] [Google Scholar]
- 36.Ploix C, Lo D, Carson MJ. A ligand for the chemokine receptor CCR7 can influence the homeostatic proliferation of CD4 T cells and progression of autoimmunity. J Immunol. 2001;167:6724–30. doi: 10.4049/jimmunol.167.12.6724. [DOI] [PubMed] [Google Scholar]
- 37.Gudmundsdottir H, Turka LA. A closer look at homeostatic proliferation of CD4+ T cells: costimulatory requirements and role in memory formation. J Immunol. 2001;167:3699–707. doi: 10.4049/jimmunol.167.7.3699. [DOI] [PubMed] [Google Scholar]
- 38.Goldrath AW, Bogatzki LY, Bevan MJ. Naive T cells transiently acquire a memory-like phenotype during homeostasis-driven proliferation. J Exp Med. 2000;192:557–64. doi: 10.1084/jem.192.4.557. [DOI] [PMC free article] [PubMed] [Google Scholar]
- 39.Murali-Krishna K, Ahmed R. Cutting edge: naive T cells masquerading as memory cells. J Immunol. 2000;165:1733–7. doi: 10.4049/jimmunol.165.4.1733. [DOI] [PubMed] [Google Scholar]
- 40.Taylor DK, Neujahr D, Turka LA. Heterologous immunity and homeostatic proliferation as barriers to tolerance. Curr Opin Immunol. 2004;16:558–64. doi: 10.1016/j.coi.2004.07.007. [DOI] [PubMed] [Google Scholar]
- 41.Marrack P, Bender J, Hildeman D, Jordan M, Mitchell T, Murakami M, et al. Homeostasis of alpha beta TCR+ T cells. Nat Immunol. 2000;1:107–11. doi: 10.1038/77778. [DOI] [PubMed] [Google Scholar]
- 42.Surh CD, Sprent J. T-cell apoptosis detected in situ during positive and negative selection in the thymus. Nature. 1994;372:100–3. doi: 10.1038/372100a0. [DOI] [PubMed] [Google Scholar]
- 43.Cadwell K, Liu JY, Brown SL, Miyoshi H, Loh J, Lennerz JK, et al. A key role for autophagy and the autophagy gene Atg16l1 in mouse and human intestinal Paneth cells. Nature. 2008;456:259–63. doi: 10.1038/nature07416. [DOI] [PMC free article] [PubMed] [Google Scholar]
- 44.Komatsu M, Waguri S, Chiba T, Murata S, Iwata J, Tanida I, et al. Loss of autophagy in the central nervous system causes neurodegeneration in mice. Nature. 2006;441:880–4. doi: 10.1038/nature04723. [DOI] [PubMed] [Google Scholar]
- 45.Wu Z, Irizarry RA, Gentleman FM, Martinez-Murillo F, Spencer F. A model-based background adjustment for oligonucleotide expression arrays. J Am Stat Assoc. 2004;99:909–18. doi: 10.1198/016214504000000683. [DOI] [Google Scholar]
- 46.Eisen MB, Spellman PT, Brown PO, Botstein D. Cluster analysis and display of genome-wide expression patterns. Proc Natl Acad Sci U S A. 1998;95:14863–8. doi: 10.1073/pnas.95.25.14863. [DOI] [PMC free article] [PubMed] [Google Scholar]
Associated Data
This section collects any data citations, data availability statements, or supplementary materials included in this article.