Introduction
Owing to their high nucleophilicity, N-heterocyclic carbenes (NHCs) react with carbon disulfide, affording zwitterionic dithiocarboxylates of the general type NHC+–CS2−.1 First examples of such compounds had been prepared less straightforwardly from enetetramines and CS2 already several decades ago.2 These pseudo-cross-conjugated mesomeric betaines3 are attracting great current interest. Their potential for probing the stereoelectronic parameters of NHCs was recently investigated by Delaude et al.4 They have been utilised as efficient organocatalysts,5 and their application as ligands, which is based on sporadic work in the 1980s,6 is a highly dynamic area of transition-metal coordination chemistry.7 Very recently, Delaude, Wilton-Ely and co-workers have demonstrated that zwitterionic dithiocarboxylates NHC+–CS2− are also suitable for the stabilisation of gold nanoparticles.8 This has prompted us to study their chemisorption on solid gold substrates. The present investigation is part of our programme addressing the multipoint attachment of bi-9 and oligodentate10 adsorbate species on gold. We note that Lee and coworkers have shown that dithiocarboxylic acids R-CS2H (R = n-alkyl) form self-assembled monolayers (SAMs) on gold.11 Such SAMs contain surface-bound anionic dithiocarboxylate groups R–CS2−, while SAMs fabricated from zwitterionic dithiocarboxylates NHC+–CS2− are expected to contain intact, neutral adsorbate molecules.
Results and discussion
Synthetic work and crystal structures
The nucleophilic addition reactions of the NHCs 1 – 4 with an excess of CS2 in THF afforded the corresponding zwitterionic dithiocarboxylates 1+–CS2− – 4+–CS2− as red solids in good yield (Scheme 1). While the 2,6-diisopropylphenyl-substituted imidazol-2-ylidene 1 and the isopropyl-substituted imidazol-2-ylidene 2 were synthesised and isolated as crystalline solids by well-established methods,12 the benzyl-substituted imidazol-2-ylidene 3 and the ethyl-substituted benzimidazol-2-ylidene 4 were generated for this purpose in situ by deprotonation of [3H]Cl13 and [4H]Br,14 respectively. 1+–CS2− had already been obtained previously by Delaude et al. in lower yield by the in situ method and was characterised crystallographically by these authors.4 Although 2+–CS2− was used as a ligand in a recent study, preparative and analytical details have been unavailable for this compound.7a,c
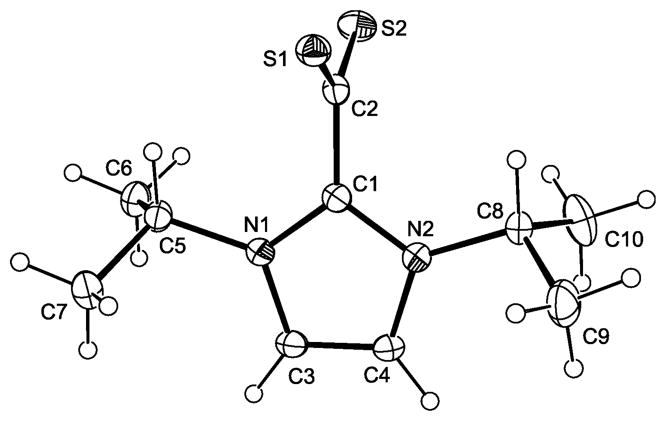
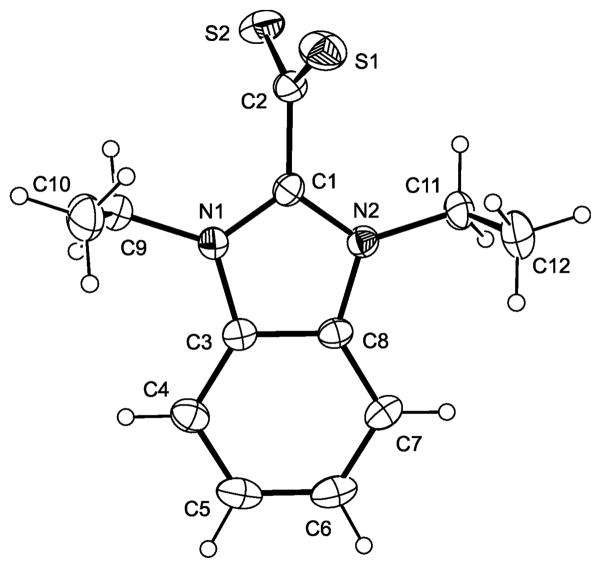
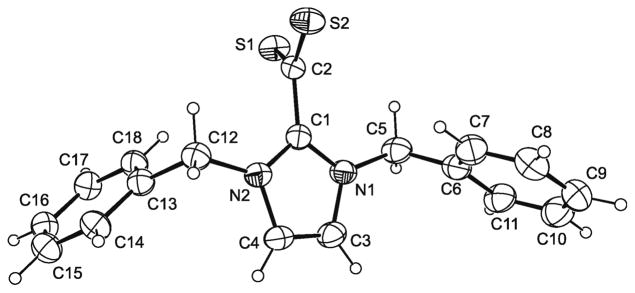
We have carried out single-crystal X-ray diffraction studies for 2+–CS2− – 4+–CS2−. The molecular structures of these compounds are shown in Figures 1 – 3. Pertinent bond parameters are collected in Table 1, which also includes the corresponding data of 1+–CS2− for comparison. As a sideline of our crystallographic investigation we note that single-crystals of the benzyl-substituted compound 3+–CS2− exhibit strong pleochroism (see ESI, Fig. S1).
Fig. 1.
Fig. 3.
Table 1.
Selected bond lengths (Å) and angles (°) for compounds 1+–CS2− – 4+–CS2−.
| Compound | C–CS2 | C–S | N–CCS2 | N–C–N | S–C–S | |
|---|---|---|---|---|---|---|
| 1+–CS2− | 1.487(2) | 1.659(5) | 1.341(2) | 107.5(1) | 128.5(2) | ref. 4 |
| 1.676(3) | 1.387(1) | |||||
| 2+–CS2− | 1.485(4) | 1.675(3) | 1.351(3) | 107.0(2) | 130.5(2) | this work |
| 1.677(3) | 1.356(3) | |||||
| 3+–CS2− | 1.507(6) | 1.674(5) | 1.337(6) | 108.0(4) | 129.8(3) | this work |
| 2 molecules | 1.675(5) | 1.346(6) | ||||
| 1.500(6) | 1.674(5) | 1.348(6) | 107.0(4) | 129.0(3) | ||
| 1.677(5) | 1.365(6) | |||||
| 4+–CS2− | 1.499(6) | 1.668(5) | 1.340(5) | 109.5(4) | 130.6(3) | this work |
| 1.669(5) | 1.342(5) |
Bond lengths and angles compare well to those of other compounds of the type NHC+–CS2−.1a,4 The only remarkable feature occurs in the case of the benzyl-substituted 3+–CS2−, which does not show the approximately orthogonal orientation of the CS2 and CN2 planes which is usually found for such zwitterionic compounds. The two independent molecules of 3+–CS2− exhibit a deviation from orthogonality of ca. 20° and ca. 30°, respectively, as is indicated by their N–C–C–S torsion angle values (molecule 1: 71.55°, –109.25°, –107.39°, 71.81°; molecule 2: −60.10°, 121.22°, 118.62°, −60.06°).
All compounds were further characterised by pertinent spectroscopic methods. Their characteristic red colour originates from CS2−-based n→π* transitions.15 Optical spectroscopy revealed that the corresponding absorption maximum is located at ca. 530 nm in all cases (dichloromethane solution). Compounds 2+–CS2− – 4+–CS2−, which carry aliphatic N-substituents, exhibit a second n→π* absorption at slightly higher energy (λmax ca. 440 nm). In addition to these fairly weak bands (logε ca. 2) in the visible region the CS2− group gives rise to an intense π→π* absorption in the UV region (λmax ca. 360 nm, logε ca. 4). The ring systems are responsible for π→π* bands of similar intensity (logε ca. 4) at higher energy. While two absorption maxima located at ca. 235 and 260 nm are observed for the imidazolium-based compounds 1+–CS2− – 3+–CS2−, the benzimidazolium-based derivative 4+–CS2− exhibits three π→π* absorptions (λmax = 229, 273, 309 nm).
The charge delocalisation in the CS2− and CN2+ parts of the zwitterions, as indicated already by the essentially identical carbon–heteroatom bond lengths in each unit (Table 1), is nicely reflected by characteristic data from vibrational spectrosopy. The highest intensity band in the Raman spectra is located in the narrow range between ca. 1465 and 1490 cm−1 for these compounds and can be attributed to the νs(CN2+) vibrational mode. The corresponding νas(CN2+) vibrational band was observed between ca. 1465 and 1500 cm−1 in the IR spectra, which further exhibit the characteristic νas(CS2−) vibrational band between ca. 1045 and 1060 cm−1, in line with previously reported experimental findings for 1+–CS2− and analogous compounds4 and results of ab initio calculations.16
The CN2+ and CS2− units give rise to 13C NMR signals at ca. 150 ppm and 220 – 225 ppm, respectively, which agrees very well with data reported for closely related compounds.4,1d
SAM fabrication and investigation of the chemisorption process by SHG
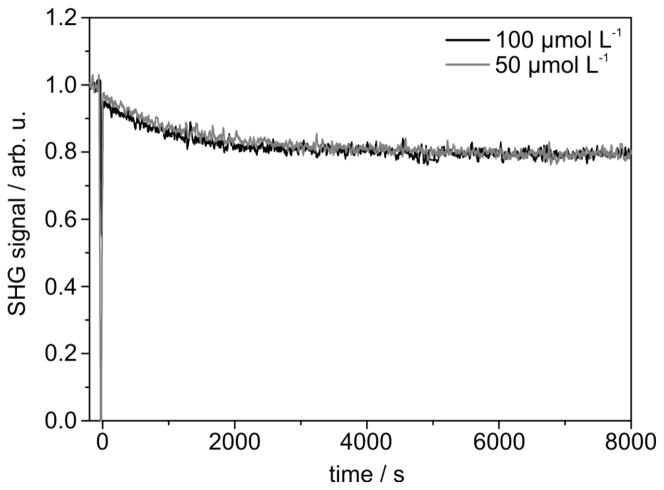
SAMs of 1+–CS2− – 4+–CS2− were prepared on gold substrates by applying a standard protocol (dichloromethane, room temperature, immersion time ca. 20 h). The SAM formation process was investigated in situ and in real time by optical second harmonic generation (SHG).17 The SHG signal of the clean substrate in pure dichloromethane was recorded for reference purposes. Subsequently, the pure solvent was replaced by a dichloromethane solution of the adsorbate species, and the SHG signal was instantly monitored in situ as a function of time. The results of this SHG study are described here exemplarily for 1+–CS2−. Fig. 4 shows the real-time SHG signal of the adsorption of this compound on the gold substrate for two different concentrations, viz. c = 50 μmol L−1 and c = 100 μmol L−1. At t < 0 the signal of the plain gold substrate immersed in pure solvent is measured. This signal has been set to unity. The change of the pure solvent to the solution of the adsorbate species causes an abrupt decrease of the SHG signal at t = 0 and subsequently a decrease of the SHG signal is observed until saturation is reached.
Fig. 4.
The SHG data indicate similar adsorption behaviour for both concentrations. Not surprisingly, the adsorption process takes slightly longer for c = 50 μmol L−1 than for c = 100 μmol L−1, as is indicated by the time needed to reach saturation of the SHG signal in each case, viz. t = (3500 ± 500) s for c = 100 μmol L−1 and t = (4500 ± 500) s for c = 50 μmol L−1. In both cases a drop-off of the intensity of the SHG signal to 0.80 ± 0.02 is observed. A decrease of the SHG signal has also noticed before for a wide variety of sulfur-based adsorbate species such as, for example, thiols,18 thioethers,10d,19 disulfides19 and dithiolane derivatives.9b This behaviour can be explained by a decrease of the number of free electrons at the surface of the gold substrate by localisation in chemical bonds between the gold atoms and the adsorbing molecules. SHG is not suitable for probing the nature of these bonds on the surface. This can be achieved, however, by XPS and NEXAFS spectroscopy (vide infra).
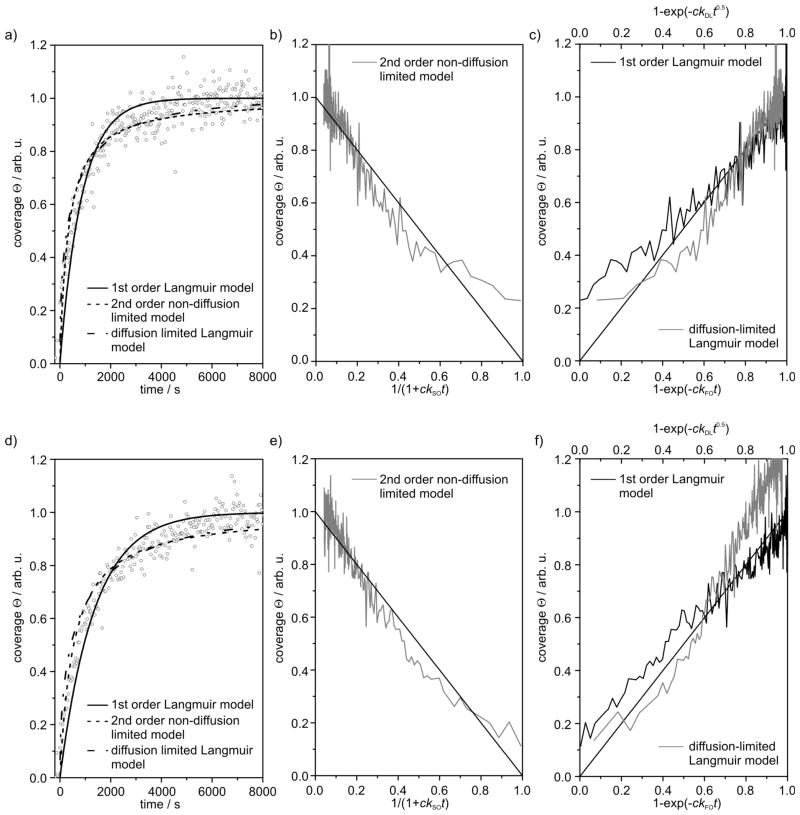
From the SHG data, we can calculate the coverage Θ of adsorbate molecules on the gold surface. If the SHG signal is saturated, the surface coverage is defined as Θ = 1. The temporal development of the surface coverage Θ is shown in Fig. 5a for c = 100 μmol L−1 and in Fig. 5d for c = 50 μmol L−1. The adsorption kinetics can now be compared to three kinetic models which have been proposed in earlier studies to describe the formation of SAMs: (i) the first-order Langmuir model (FO), i. e. direct chemisorption of the molecules from the solution;20 (ii) the second-order non-diffusion limited model (SO) involving the combined chemisorption of two groups present in one molecule;21 (iii) the diffusion-limited Langmuir model (DL), i. e. diffusion of the molecules from the solution to the surface must be taken into account.20a Fig. 5b–c displays the agreement of the kinetic models with the surface coverage data for c = 100 μmol L−1. For c = 50 μmol L−1,this is shown in Fig. 5e–f. The abscissae are chosen in such a way that the experimental coverage data should follow a straight line for the respective kinetic model. For c = 100 μmol L−1, all kinetic models show small deviations from the experimental data (cf. Fig. 5b–c). The best fit occurs with the SO model, which is expected to be particularly suitable for the theoretical description of the adsorption of 1+–CS2− on gold surfaces, since two binding events can occur with the bidentate dithiocarboxylate headgroup. Obviously, for a concentration of c = 50 μmol L−1 the DL model fails to describe the experimental data. The FO model shows much smaller deviations from the data, but again the SO model is most consistent with the measurements. The rate-limiting step for the adsorption of 1+–CS2− on gold surfaces therefore appears to be the formation of two gold–sulfur bonds between the headgroup and the surface atoms.
Fig. 5.
SAM characterisation
XPS results
Surface characterisation was exemplarily performed for SAMs fabricated from compounds 1+–CS2− and 2+–CS2−, respectively. Elemental compositions of these SAMs were determined by X-ray photoelectron spectroscopy (XPS), which showed the presence of carbon, nitrogen, sulfur, oxygen, and gold (from the underlying substrate). The oxygen observed at the surface can be attributed to minimal substrate contamination prior to the film assembly, since no significant oxidation was indicated by the high-resolution XP spectra or the near-edge X-ray absorption fine structure (NEXAFS) data discussed later. Once the gold contribution is omitted (Table 2) the experimental compositions fall into agreement with the stoichiometry of the two adsorbates. The only significant differences between theoretical and experimental compositions are that the atomic percentages of S and N are lower than expected (3.8 versus 14.3 sulfur at.% in the case of 2+–CS2−). If well-ordered monolayers are formed the sulfur and nitrogen containing groups are close to the gold surface and covered by the rest of the molecule. Thus, these lower percentages can be explained by attenuation of the sulfur and nitrogen signals due to inelastic scattering.
Table 2.
Summary of XPS determined elemental compositionsa for thin films of 1+–CS2− and 2+–CS2− on gold.
| Au | C | N | S | O | ||
|---|---|---|---|---|---|---|
| 1+–CS2− | Theor. comp. | 0 | 87.5 | 6.25 | 6.25 | 0 |
| Exp. comp. | 65.4(2.8) | 19.9(1.9) | 1.9(0.6) | 2.2(0.3) | 2.2(0.9) | |
| Exp. comp. w/o Au | 0 | 81.7(2.1) | 5.5(1.5) | 6.4(1.3) | 6.4(2.1) | |
| 2+–CS2− | Theor. comp. | 0 | 71.4 | 14.3 | 14.3 | 0 |
| Exp. comp. | 59.9(2.3) | 33.1(0.9) | 3.2(0.8) | 3.8(0.3) | n. d.b | |
| Exp. comp. w/o Au | 0 | 82.5(2.2) | 8.0(2.0) | 9.5(0.7) | n. d.b |
Values in atomic % with experimental errors in parentheses.
Not detected.
Figures 6 – 8 show high-resolution C 1s, S 2p and N 1s XP spectra for both SAMs on Au. The C 1s spectra consist of two features, one at 284.9 eV corresponding to the alkyl chains and aromatic carbon rings and a high-energy shoulder at 286.0 eV that can be assigned to the C–N and C–S groups.22 The broader width of the shoulder, as compared to the C–C emission, may also reflect contributions from small amounts of C–O contaminations of the substrate. This shoulder is double in size to what was expected just from stoichiometry for the SAM fabricated from 2+–CS2− (Table 3). Both SAMs contain only small amounts of oxygen, viz. 2 – 7 at.%, which is similar to the oxygen content of the adventitious carbon layer we typically observe on our gold substrates (ca. 5 at.%) prior to adsorption.
Fig. 6.
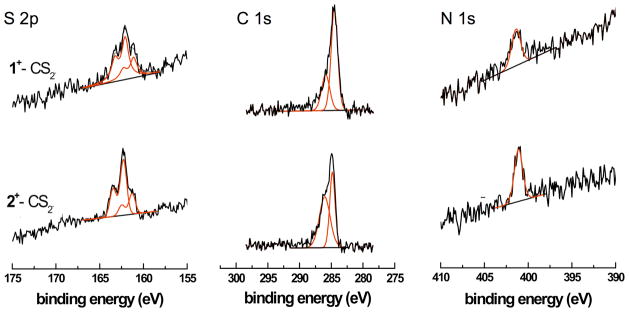
Fig. 8.
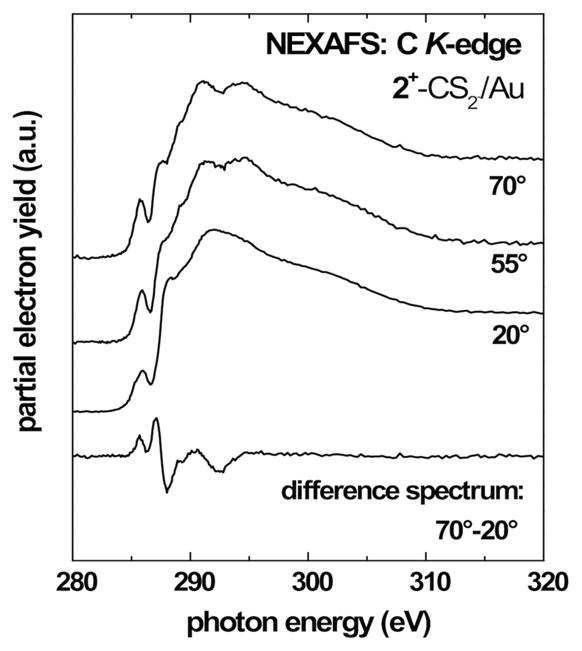
Table 3.
High-resolution XPS C 1s peak fit resultsa for thin films of 1+–CS2− and 2+–CS2− on gold.
| C–Hn, C=C (284.9 eV) | C–N, C–S (286.0eV) | Thiolate S (162.2 eV) | “Different” Thiolate S (161.2 eV) | ||
|---|---|---|---|---|---|
| 1+–CS2− | Theor. comp. | 87.5 | 12.5 | ||
| Exp. comp. | 73.5 | 26.5 | 64.8 | 35.2 | |
| 2+–CS2− | Theor. comp. | 71.4 | 28.6 | ||
| Exp. comp. | 42.4 | 57.6 | 73.0 | 27.0 |
Values in atomic %.
The N 1s spectra of both SAMs exhibit a single feature at 401.1 eV related to the N–C bonds.22 The S 2p spectra exhibit two S 2p3/2,1/2 doublets with binding energies (BE) of 162.2 and 161.2 eV. These two different doublets stem from two thiolate species with the BE difference between these two doublets most likely being a result of a hybridisation change or two different molecular orientations.10d The ratio between the area of the thiolate peak at 162.2 eV and that of the peak at 161.2 eV is 2:1 and 3:1, respectively, for the SAMs fabricated from 1+–CS2− and 2+–CS2− (Table 3). There is no indication of oxidised sulfur species in the spectra.
The effective film thickness of the SAMs was determined from the intensities of the C 1s and the Au 4f emissions. The thickness values were derived from the IC1s/IAu4f intensity ratios. We calculated thickness values of 10.0 and 9.5 Å, respectively, for the SAMs fabricated from 1+–CS2− and 2+–CS2− by using previously reported attenuation lengths.23 this is in excellent agreement with monolayers on gold, since the expected thickness derived from the crystal structures (vide supra) is ca. 10 Å.
NEXAFS spectroscopy
The molecular orientation and alignment in SAMs prepared from 1+–CS2− and 2+–CS2− on gold surfaces were studied with NEXAFS spectroscopy. This method is extremely surface-sensitive and can provide information about the nature and orientation of chemical bonds of adsorbate species. Molecular orbitals are probed by monitoring resonant transitions of atomic core electrons into unoccupied molecular orbitals. The efficiency of the photoexcitation process is strongly dependent on the orientation of the X-ray electric field vector with respect to the molecular transition dipole moment (TDM). This effect is known as the linear dichoism of X-ray absorption and can be conveniently monitored by recording NEXAFS spectra with p-polarised X-rays at different incidence angles.24
Figures 7 and 8 show C K-edge NEXAFS spectra recorded at X-ray incidence angles of 70°, 55° and 20° for SAMs fabricated from 1+–CS2− and 2+–CS2− on gold. All spectra show the expected absorption edge related to the excitation of the C 1s electrons into continuum states and a number of characteristic absorption features. The pre-edge region exhibits peaks near 285.5 eV, related to C 1s → π*(C=C) transitions of the aromatic rings. This resonance is significantly stronger in the case of 1+–CS2−, which is expected in view of the additional phenyl rings in 1. In 2+–CS2− this peak is only related to the imidazole unit. All spectra exhibit Rydberg/C–H (R*) resonances near 288.1 eV related to the alkyl chains and broad σ* resonances related to C–C bonds at higher photon energies. The spectra show no signs of chemical impurities such as C=O. The above assignments were made in accordance with refs10c,24–28.
Fig. 7.
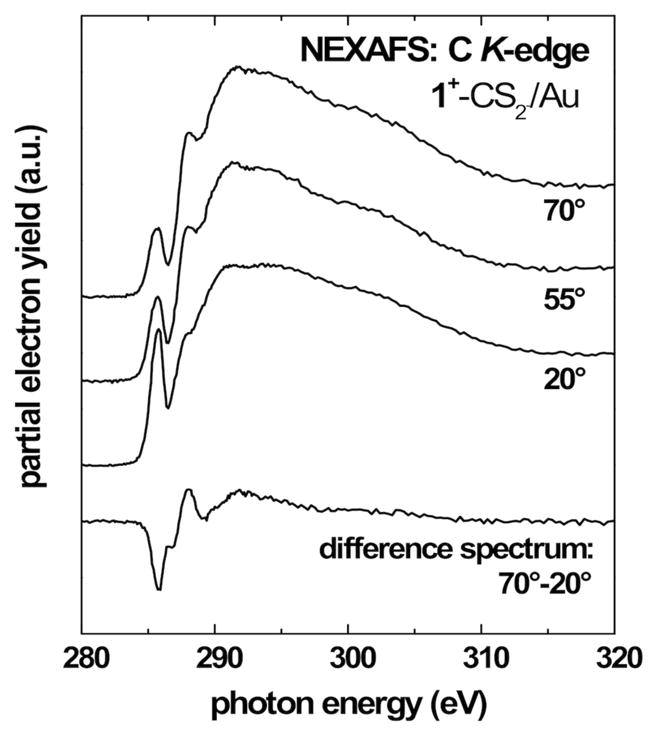
The spectra for 1+–CS2− show a pronounced linear dichroism for the π* resonances, which is highlighted by the 70° – 20° difference spectrum. This is a signature of a certain degree of orientational order and molecular alignment in the SAM. The negative polarity of the observed difference peak implies a strongly tilted orientation of the phenyl ring planes in 1 with respect to the surface. Note that for 1+–CS2− the aromatic π* resonance is representative of both the phenyl rings and the imidazole moieties. The observed dichroism thus represents an average over the different orientations. For 2+–CS2− we observe a weaker difference peak with positive polarity for the π* imidazole resonance. This indicates an upright, but tilted orientation of the imidazole unit with respect to the surface.
A quantitative analysis of the C K-edge NEXAFS spectra was performed to determine the average molecular tilt angles. The orientation of aromatic units with respect to the surface normal were determined using the π* transitions. The intensities of these resonances as a function of the X-ray incidence angle Θ are evaluated using published procedures for a vector-type orbital.24 This analysis yields an average tilt angle for the aromatic ring planes versus the surface normal of 53°±5° for 1+–CS2−. This value represents an average over the phenyl and imidazole orientation and the actual tilt angle of the phenyl rings is most likely higher. For the SAMs fabricated from 2+–CS2− we found an average tilt angle of 28°±5° for the imidazole unit. The imidazole tilt angle found for this SAMs is slightly higher than the corresponding tilt angles found for related aromatic SAMs on gold, such as, for example, SAMs based on biphenyl (Θ≈23°), para-terphenyl (Θ≈20°) or anthracene (Θ≈23°) backbones,29 but it is close to orientations observed for biphenyl tellurolate on gold (Θ≈28°).30 The molecular alignment is superior to SAMs with short aromatic backbones comparable with 2+–CS2−, for example benzene-thiols on gold, which have been shown to form mostly disordered layers.29
Experimental
General considerations
All preparations involving air-sensitive compounds were carried out under an atmosphere of dry nitrogen by using standard Schlenk techniques or in a conventional argon-filled glove box. Solvents and reagents were appropriately dried and purified by conventional methods and stored under inert gas atmosphere. The N-heterocyclic carbenes 112b and 212a and the azolium salts [3H]Cl13 and [4H]Br14 were prepared by slight variation of published procedures. Elemental analyses were carried out by the microanalytical laboratory of the Institute of Thermal Energy Management at the University of Kassel. NMR spectra were recorded with the following Varian spectrometers: VNMRS-500 (500 MHz) and Varian 400-MR (400 MHz). Chemical shifts (δ) are given in ppm and are referenced to the signals due to the residual protio impurities of the solvents used relative to tetramethylsilane for 1H and to the respective solvent signal for 13C. IR spectra were obtained with a Bruker Alpha-T FT-IR spectrometer (KBr pellets). Raman spectra were obtained at a temperature of 10 K with a Bruker IFS 66/CS FT-NIR spectrometer equipped with a FRA 106 FT-Raman module. An Adlas Nd:YAG laser (350 mW, wavelength 1064 nm) was used as light source. Optical spectra were obtained with a Perkin Elmer Lambda 40 UV/Vis spectrometer. Mass spectra were obtained with a Bruker Esquire 3000 spectrometer (ESI) and a quadrupole ion-trap spectrometer (ESI and APCI) Finnigan LCQDECA (ThermoQuest, San José, USA). MALDI mass spectra were obtained with a BiFlex IV spectrometer (Bruker Daltonics, Bremen, Germany) equipped with an N2 laser (wavelength 337 nm, 3 ns pulse duration). DCTB (2-[(2E)-3-(4-tert-butylphenyl)-2-methylprop-2-enylidene]malononitrile) was used as matrix.
Preparative work
Henry: bitte die Synthese von 2+–CS2−, 3+–CS2− und 4+–CS2− im Stil von Dalton Trans. ergänzen.
X-ray crystal structure determiniation
Clemens: bitte ergänzen
Second harmonic generation
Sollte so noch stimmen ☺
Details of SHG experiments for the investigation of interfaces and thin-film formation have been published elsewhere.18a,31 Briefly, the measurements were performed with a pulsed Nd:YAG laser operating at a repetition rate of 10 Hz and a wavelength of λ = 1064 nm. The pulse duration was 7 ns and the laser beam was incident on the sample surface under an angle of 45°. Gold films with a thickness of 100 nm on a Si (100) wafer served as substrates. The second-harmonic photons were separated from the fundamental beam using color glasses (BG 39, OG 590, Schott) and filters in combination with a monochromator. Signal detection was performed using a photomultiplier operating in single photon counting mode. Its signal was processed by a boxcar aver- ager and stored in a computer.
A small fraction of the light emitted by the laser was branched off by a dielectric beam splitter and directed onto a y-cut quartz plate in order to generate a SH reference signal. The reference was detected and processed as explained above and was used to normalize the second harmonic light intensity of the sample.
X-ray photoelectron spectroscopy
All XPS spectra were collected on a Kratos AXIS Ultra DLD instrument (Kratos, Manchester, England) equipped with a monochromatic Al-Kα X-ray source (photon energy = 1486.6 eV). The photoelectron take-off angle was normal to the substrate while the photoelectron binding energy scale was calibrated to the Au 4f7/2 emission (84.0 eV) of the underlying gold substrate. The reported XPS compositions are an average from three spots per sample and calculated from peak areas taken from both a survey scan (0 to 1100 eV for C 1s and Au 4f) and selected region scans (524–544 eV for O 1s; 390–410 eV for N 1s; 155–173 eV for S 2p) acquired at an analyser pass energy of 80 eV. Molecular environments of the samples were characterised by high-resolution (analyser pass energy = 20 eV) spectra from the S 2p, N 1s, and C 1s regions. For all peak quantifications a linear background was subtracted. Peak areas were normalised by the manufacturer-supplied sensitivity factors and surface concentrations were calculated using Casa XPS software.
Near-edge X-ray absorption fine structure spectroscopy
NEXAFS spectra were recorded at the National Synchrotron Light Source (NSLS) U7A beamline at Brookhaven National Laboratory, using an elliptically polarised beam with ~85% p-polarisation. This beam line uses a monochromator and 600 l/mm grating that provides a full-width at half-maximum (FWHM) resolution of ~0.15 eV at the carbon K-edge (285 eV). The monochromator energy scale was calibrated using the 285.35 eV C 1s → π* transition on a graphite transmission grid placed in the path of the X-rays. C K-edge spectra were normalised by the spectrum of a clean gold surface prepared by evaporation of gold in vacuo. Both reference and signal were divided by the NEXAFS signal of an upstream gold-coated reference mesh to account for beam intensity variations.24 Partial electron yield was monitored with a channeltron detector with the bias voltage maintained at −150 V for C K-edge. The samples were mounted to allow rotation about the vertical axis to change the angle between the sample surface and the incident X-ray beam. The NEXAFS angle is defined as the angle between the incident X-ray beam and the sample surface.
Supplementary Material
Fig. 2.
Acknowledgments
This work was funded in part by NESAC-BIO (NIH grant EB-002027). T. W. and J. E. B. thank David G. Castner for support and Daniel Fischer and Cherno Jaye (NIST) for providing them with the experimental equipment for NEXAFS spectroscopy and their help at the synchrotron. NEXAFS studies were performed at the NSLS, Brookhaven National Laboratory, which is supported by the U. S. Department of Energy, Division of Materials Science and Division of Chemical Sciences. H. M. thanks Ms. U. Cornelissen for recording the Raman spectra.
Footnotes
Electronic Supplementary Information (ESI) available:
References
- 1.For reviews, see: Delaude L. Eur J Inorg Chem. 2009:1681–1699.Kirmse W. Eur J Org Chem. 2005:237–260.Nakayama J. J Synth Org Chem Jpn. 2002;60:106–114.seminal paper: Kuhn N, Bohnen H, Henkel G. Z Naturforsch B: Chem Sci. 1994;49:1473– 1480.
- 2.(a) Schössler W, Regitz M. Chem Ber. 1974;107:1931–1948. [Google Scholar]; (b) Winberg HE, Coffman DD. J Am Chem Soc. 1965;87:2776– 2777. [Google Scholar]
- 3.For a review, see: Ollis WD, Stanforth SP, Ramsden CA. Tetrahedron. 1985;41:2239– 2329.
- 4.Delaude L, Demonceau A, Wouters J. Eur J Inorg Chem. 2009:1882– 1891. [Google Scholar]
- 5.See, for example: Sereda O, Blanrue A, Wilhelm R. Chem Commun. 2009:1040– 1042. doi: 10.1039/b817991c.
- 6.(a) Borer LL, Kong JV, Keihl PA, Forkey DM. Inorg Chim Acta. 1987;129:223–226. [Google Scholar]; (b) Borer LL, Kong J, Sinn E. Inorg Chim Acta. 1986;122:145– 148. [Google Scholar]
- 7.(a) Naeem S, Thompson AL, White AJP, Delaude L, Wilton-Ely JDET. Dalton Trans. 2011;40:3737–3747. doi: 10.1039/c1dt10048c. [DOI] [PubMed] [Google Scholar]; (b) Naeem S, Thompson AL, Delaude L, Wilton-Ely JDET. Chem Eur J. 2010;16:10971–10974. doi: 10.1002/chem.201001235. [DOI] [PubMed] [Google Scholar]; (c) Naeem S, Delaude L, White AJP, Wilton-Ely JDET. Inorg Chem. 2010;49:1784–1793. doi: 10.1021/ic9021504. [DOI] [PubMed] [Google Scholar]; (d) Sugaya T, Fujihara T, Nagasawa A, Unoura K. Inorg Chim Acta. 2009;362:4813–4822. [Google Scholar]; (e) Willem Q, Nicks F, Sauvage X, Delaude L, Demonceau A. J Organomet Chem. 2009;694:4049–4055. [Google Scholar]; (f) Delaude L, Demonceau XA, Wouters J. Organometallics. 2009;28:4058–4064. [Google Scholar]; (g) Fujihara T, Sugaya T, Nagasawa A, Nakayama J. Acta Crystallogr, Sect E: Struct Rep Online. 2004;60:m282– m284. doi: 10.1107/S1600536812035453. [DOI] [PMC free article] [PubMed] [Google Scholar]
- 8.Naeem S, Delaude L, White AJP, Wilton-Ely JDET. Inorg Chem. 2010;49:1784– 1793. doi: 10.1021/ic9021504. [DOI] [PubMed] [Google Scholar]
- 9.(a) Siemeling U, Rittinghaus S, Weidner T, Brison J, Castner D. Appl Surf Sci. 2010;256:1832–1836. doi: 10.1016/j.apsusc.2009.10.015. [DOI] [PMC free article] [PubMed] [Google Scholar]; (b) Siemeling U, Bruhn C, Bretthauer F, Borg M, Träger F, Vogel F, Azzam W, Badin M, Strunskus T, Wöll C. Dalton Trans. 2009:8593–8604. doi: 10.1039/b905025f. [DOI] [PubMed] [Google Scholar]; (c) Weidner T, Bretthauer F, Ballav N, Motschmann H, Orendi H, Bruhn C, Siemeling U, Zharnikov M. Langmuir. 2008;24:11691–11700. doi: 10.1021/la802454w. [DOI] [PubMed] [Google Scholar]; (d) Weidner T, Ballav N, Zharnikov M, Priebe A, Long NJ, Maurer J, Winter R, Rothenberger A, Fenske D, Rother D, Bruhn C, Fink H, Siemeling U. Chem Eur J. 2008;14:4346–4360. doi: 10.1002/chem.200701936. [DOI] [PubMed] [Google Scholar]; (e) Siemeling U, Rother D, Bruhn C, Fink H, Weidner T, Träger F, Rothenberger A, Fenske D, Priebe A, Maurer J, Winter R. J Am Chem Soc. 2005;127:1102– 1103. doi: 10.1021/ja0436244. [DOI] [PubMed] [Google Scholar]
- 10.(a) Siemeling U, Schirrmacher C, Glebe U, Bruhn C, Baio JE, Árnadóttir L, Castner DG, Weidner T. Inorg Chim Acta. 2011;374:302–312. doi: 10.1016/j.ica.2011.02.048. [DOI] [PMC free article] [PubMed] [Google Scholar]; (b) Weidner T, Zharnikov M, Hoßbach J, Castner DG, Siemeling U. J Phys Chem C. 2010;114:14975–14982. doi: 10.1021/jp104376p. [DOI] [PMC free article] [PubMed] [Google Scholar]; (c) Weidner T, Ballav N, Siemeling U, Troegel D, Walter T, Tacke R, Castner DG. J Phys Chem C. 2009;113:19609–19617. doi: 10.1021/jp906367t. [DOI] [PMC free article] [PubMed] [Google Scholar]; (d) Weidner T, Krämer A, Bruhn C, Zharnikov M, Shaporenko A, Siemeling U, Träger F. Dalton Trans. 2006:2767– 2777. doi: 10.1039/b515727g. [DOI] [PubMed] [Google Scholar]
- 11.(a) Lee TC, Chen PC, Lai TY, Tuntiwechapikul W, Kim JH, Lee TR. Appl Surf Sci. 2008;254:7064–7068. [Google Scholar]; (b) Cimatu K, Moore HJ, Lee TR, Baldelli S. J Phys Chem C. 2007;111:11751–11755. [Google Scholar]; (c) Lee TC, Hounihan DJ, Colorado R, Jr, Park JS, Lee TR. J Phys Chem B. 2004;108:2648–2653. [Google Scholar]; (d) Colorado R, Jr, Villazana RJ, Lee TR. Langmuir. 1998;14:6337– 6340. [Google Scholar]
- 12.(a) Schaub T, Radius U. Chem Eur J. 2005;11:5024–5030. doi: 10.1002/chem.200500231. [DOI] [PubMed] [Google Scholar]; (b) Dible BR, Sigman MS. J Am Chem Soc. 2003;125:872–873. doi: 10.1021/ja0286876. [DOI] [PubMed] [Google Scholar]; (c) Herrmann WA, Köcher C, Gooßen LJ, Artus GRJ. Chem Eur J. 1996;2:1627–1636. [Google Scholar]; (d) Arduengo AJ, III, Dias HVR, Harlow RL, Kline M. J Am Chem Soc. 1992;114:5530– 5534. [Google Scholar]
- 13.Leclercq L, Simard M, Schmitzer AR. J Mol Struct. 2009;918:101– 107. [Google Scholar]
- 14.Er JAV, Tennyson AG, Kamplain JW, Lynch VM, Bielawski CW. Eur J Inorg Chem. 2009:1729– 1738. [Google Scholar]
- 15.(a) Borer LL, Kong J, Sinn E. Inorg Chim Acta. 1986;122:145–148. [Google Scholar]; (b) Furlani C, Luciani ML. Inorg Chem. 1968;7:1586– 1592. [Google Scholar]
- 16.Nakayama J, Kitahara T, Sugihara Y, Sakamoto A, Ishii A. J Am Chem Soc. 2000;122:9120– 9126. [Google Scholar]
- 17.(a) Corn RM, Higgins DA. Chem Rev. 1994;94:107–125. [Google Scholar]; (b) Shen YR. Annu Rev Phys Chem. 1989;40:327– 350. [Google Scholar]
- 18.(a) Dannenberger O, Buck M, Grunze M. J Phys Chem B. 1999;103:2202–2213. [Google Scholar]; (b) Buck M, Eisert F, Grunze M, Träger F. Appl Phys A. 1995;60:1– 12. [Google Scholar]
- 19.Jung C, Dannenberger O, Xu Y, Buck M, Grunze M. Langmuir. 1998;14:1103– 1107. [Google Scholar]
- 20.(a) Andrade JD. In: Surface and Interfacial Aspects of Biomedical Polymers. Andrade JD, editor. Vol. 2. Plenum Press; New York: 1985. chapter 1. [Google Scholar]; (b) Langmuir I. J Am Chem Soc. 1918;40:1361– 1403. [Google Scholar]
- 21.Peterlinz KA, Georgiadis R. Langmuir. 1996;12:4731– 4740. [Google Scholar]
- 22.Moulder JF, Stickle WF, Sobol PE, Bomben KD. Handbook of X-ray Photoelectron Spectroscopy. Perkin-Elmer Corp; Eden Prairie: 1992. [Google Scholar]
- 23.Lamont CLA, Wilkes J. Langmuir. 1999;15:2037– 2042. [Google Scholar]
- 24.Stöhr J. NEXAFS Spectroscopy. Springer; Berlin: 1992. [Google Scholar]
- 25.Outka DA, Stöhr J, Rabe JP, Swalen JD. J Chem Phys. 1988;88:4076. [Google Scholar]
- 26.Weiss K, Bagus PS, Wöll C. J Chem Phys. 1999;111:6834–6845. [Google Scholar]
- 27.Väterlein P, Fink R. J Chem Phys. 1998;108:3313. [Google Scholar]
- 28.Cabarcos OM, Shaporenko A, Weidner T, Uppili S, Dake LS, Zharnikov M, Allara DL. J Phys Chem C. 2008;112:10842– 10854. [Google Scholar]
- 29.Frey S, Stadler V, Heister K, Eck W, Zharnikov M, Grunze M, Zeysing B, Terfort A. Langmuir. 2001;17:2408– 2415. [Google Scholar]
- 30.Weidner T, Shaporenko A, Müller J, Holtig M, Terfort A, Zharnikov M. J Phys Chem C. 2007;111:11627– 11635. [Google Scholar]
- 31.Weidner T, Vor der Brüggen J, Siemeling U, Träger F. Appl Phys B. 2003;77:31–35. [Google Scholar]
Associated Data
This section collects any data citations, data availability statements, or supplementary materials included in this article.


