Abstract
Issues implicit in a multicenter microarray study are protocol standardization and monitoring center adherence to established protocols. This study explored the effects of submitting center and sample preservation method on the quality of isolated RNA. In addition, the effects of sample preservation method and laboratory on microarray quality were also examined. Herein we evaluated the contribution of specific technical factors [center, laboratory, and preservation method (frozen/RNAlater)] on quality of isolated RNA, cRNA synthesis products, and reproducibility of gene expression microarray data for independent biologic samples collected in a multicenter microarray study. The Kruskal-Wallis test was used to test for differences owing to submitting center on isolated RNA quality. Mixed effects analysis of variance was used in assessing the impact of laboratory and preservation method on gene expression values for the 12 samples hybridized at 2 independent laboratories (24 GeneChips). One center was found to be in violation of the tissue handling protocol. No significant effect was noted owing to preservation method, which ensured that our tissue handling protocols are working properly. There was a significant laboratory effect with respect to cRNA yield, though this effect did not impact sample quality. We conclude that use of consistent protocols for sample collection, RNA extraction, cDNA/cRNA synthesis, labeling, hybridization, platform, image acquisition, normalization, and expression summaries can yield consistent expression values. Moreover, evaluation of sample quality at various steps in the data acquisition process is an important component of a multicenter study to ensure all participating centers adhere to established protocols.
Keywords: microarray, multicenter study, gene expression, Affymetrix GeneChip, quality
Microarray technology offers the opportunity to analyze the simultaneous expression of thousands of genes in a single experiment.1 Over the past few years, this powerful technology has been used to explore transcriptional profiles and to obtain molecular expression signatures of different pathologic conditions.2 In the field of cancer research, microarray analyses may provide information on pathology, prognosis, or response to treatment.3,4
However, the reliability of the microarray technology to detect transcriptional differences representative of original samples is affected by factors such as sample quality, RNA extraction, hybridization conditions, and image analysis.5 In particular, the quality of data from microarray analysis is strongly related to the quality of the RNA extracted from the tissues which is directly associated with the quality of the original tissue samples. Measurement of gene expression, by any laboratory methodology, possesses an associated error attributable to random and systematic errors. Those errors might become more significant in the case of high-density oligonucleotide microarrays, such as the Affymetrix GeneChips, where the expression of thousands of genes can be assessed simultaneously.6 Thus, it is critical to minimize experimental noise, standardize sample-handling protocols, and perform appropriate statistical analyses.6–8
Moreover, studies of rare diseases such as cancer require patient numbers that are reasonably achieved only within multicenter study designs. Implicit in a multicenter study, where tissues are procured from each participating center, are protocol standardization and monitoring adherence to established protocols. In addition, the tissue collection quality can be affected when the surgical procedure occurs outside of normal working hours and when the procedures include major surgeries. We are conducting a study that incorporates all of these challenges. Genes Related to Hepatocellular Carcinoma (GR2HCC) is a multicenter study to examine hepatic gene expression in tissue from explanted livers of patients with hepatitis C virus infection and hepatocellular carcinoma (HCC).
Although the MicroArray Quality Control project has been designed to investigate “all sources of variability, the assessment of the importance of each factor, and, ultimately, the determination of a set of standards and best practices to be followed,”9 it has not yet evaluated the effect of the submitting center or sample preservation method, common factors in multi-institutional genomic studies. The center may be an important source of variation, as practices for procuring, sample handling, and preserving tissues may differ between centers. Such sources of variation can contribute to the quality of RNA isolated, cDNA and cRNA synthesis products, and the gene expression values obtained using microarrays.
Moreover, it can be difficult to preserve the diagnostic and prognostic qualities of surgical tissue while maintaining the integrity of RNA within the sample. Without special care, tissue obtained from surgical procedures can become degraded before it can be frozen or homogenized in RNA-preserving denaturants, thus rendering the specimen useless for experiments requiring intact RNA.
Most previous microarray quality assessment methods or comparison studies relied solely on posthybridization spot or probe level metrics, such as examination of spot sizes, shapes, or comparison of the intensity distributions among chips.8,10–14 Quality metrics based on reproducibility of intensity measures alone are not sufficient, as often small samples are available and the cost of microarrays often prohibits hybridizing samples in duplicate. Moreover, methods that rely on comparability of a variable’s posthybridization distributions (such as intensities) will fail if an entire set of chips is of poor quality.8 It is therefore essential to evaluate parameters that reflect quality from an objective biologic perspective. Assessing the quality of the RNA sample before hybridization is an important aspect of microarray experiments.6
Therefore, to evaluate the quality of isolated RNA, cDNA and cRNA synthesis products, and gene expression microarray data for liver tissue collected in a multicenter microarray study, herein we evaluated the impact of specific technical factors (sample collection, storage, and shipment) on the RNA quality of samples submitted for microarray analysis in a multicenter study. Quality control parameters were established for the critical steps in the process: RNA isolation, cDNA/cRNA synthesis, and in vitro transcription (IVT) labeling reactions, and microarray hybridization. To examine reproducibility of gene expression results, a set of duplicate samples was hybridized at 2 different laboratories.
SAMPLES AND METHODS
Samples
Six A2ALL institutions [Northwestern, University of Pennsylvania, University of California Los Angeles, University of California San Francisco, University of North Carolina, and Virginia Commonwealth University (VCU)] submitted liver samples (hepatitis C virus-HCC tissues) to VCU’s Molecular Transplant Research Laboratory for RNA isolation. All samples were obtained under the appropriate Institutional Review Board-approved protocols and anonymized. Each institution received standard procedures for sample collection, sample storage, and sample shipment (see Supplementary Material). Briefly, liver tissue from explanted livers (0.5 to 1.0 g) was collected in 5 to 10mL of RNAlater (Ambion) (15mL conical tube) and liver tissues from liver biopsies were collected in a cryovial containing 1mL of RNAlater. For storing tissue samples for longer time periods, we first incubated the sample overnight in the reagent at 2 to 8°C. Thereafter, the tissue was removed from the RNAlater RNA Stabilization Reagent, then transferred to −80°C for storage until use.
RNA Isolation Procedure and Quality Assessment
Samples were collected from March 2006 to March 2007. All the tissues were stored at −80°C until used. One technician at VCU isolated RNA following the Affymetrix GeneChip Expression Analysis Manual (Santa Clara, CA) protocol with minor modifications; the same reagent lots were used for the procedure. To ensure processing of samples with a high percent of tumor and minimal or no necrosis, our HCC samples are examined by an experienced pathologist. Five micrometer frozen section slides were stained with hematoxylin and eosin for pathologist evaluation to determine tumor content and then macrodissected to remove normal or necrotic tissue. Sections (20 μm) were combined in a 15mL tube with 10mL of Trizol. Total RNA was extracted using TRIzol (Life Technologies, Rockville, MD). The precipitated product was further purified using RNeasy Mini Kit (Qiagen, CA). Integrity of RNA, after extraction, was evaluated using the Agilent 2100 Bioanalyzer (Agilent Technologies, Palo Alto, CA). The quality of the total cellular RNA isolated was assessed by examining RNA purity by spectrophotometer as the absorbance at 260, 270, and 280 nm, and estimating the A260:A280 and A260:A270 ratios. In addition, RNA integrity was assessed by Agilent Bioanalyzer by estimating the 28S:18S rRNA ratios as the sum of both rRNA peaks as a proportion of all RNA, the percent rRNA, and RNA integrity number (RIN).
cDNA Synthesis and IVT Labeling Reactions
We randomly selected RNA samples obtained from 12 unique patients at a single center, including 6 samples isolated from RNAlater and 6 isolated from frozen tissue. The samples met all quality criteria: [A260/A280≥1.8 (range = 1.8 to 2.1), A260/A270≥1.1, 28S/18S>1.4, both rRNA peak areas accounting for more than 30% of all RNA, and RIN >6]. The samples were provided to VCU and to the Laboratory of Molecular Technology, National Cancer Institute (NCI) for cDNA synthesis reaction and IVT labeling reactions. The RNA samples were also reevaluated for quality control parameters at NCI.
The cDNA synthesis and IVT labeling reactions were performed using the same protocol at each laboratory. Briefly, 5 μg of total RNA was reverse-transcribed using T7-poly-dT primer and converted into double-stranded cDNA (One-Cycle Target Labeling and Control Reagents, Affymetrix, Santa Clara, CA), with templates being used for an IVT reaction to yield biotin-labeled antisense cRNA. cDNA and cRNA quality and integrity synthesis products were assessed by running 1 μL of every sample in RNA 6000 Nano or Pico LabChips on the 2100 Bioanalyzer (Agilent). Purity of the cRNA preparation was tested by the 260/280 nm ratio (VCU: Spectromic Genesys 5, Thermal Electron Corporation, NCI: NanoDrop ND-1000) (cDNA: a—1.5 kb<cDNA<5.0 kb.3) and [cRNA: a—A260/A280≥1.8 (range = 1.8 to 2.1), b—1.0 kb<cRNA<4.5 kb]. The quality metrics recorded included A260:A280 ratios, concentration (μg/μL), cRNA yield after IVT synthesis (μg), and adjusted cRNA yield (μg), obtained by adjusting the cRNA yield after IVT synthesis by the starting amount of total RNA times volume of cDNA synthesis product used.
GeneChip Hybridization
In each laboratory, the 12 samples were hybridized to Affymetrix HG-U133Av2 GeneChips by one technician. All 24 GeneChips were from a single manufacturing lot. The cRNA was fragmented in fragmentation buffer (40 mM Tris-acetate, pH 8.1, 100 mM KOAc, 30 mM MgOAc) for 35 minutes at 94°C. As per the Affymetrix protocol, 10 μg of fragmented cRNA was hybridized on the array for 24 hours at 60 rpm in a 45°C hybridization oven. The chips were washed and stained with streptavidin phycoerythrin (SAPE; Molecular Probes, Eugene, OR) in Affymetrix fluidics stations. To amplify staining, SAPE solution was added twice with an antistreptavidin biotinylated antibody (Vector Laboratories, Burlingame, CA) staining step in between. The array image was generated by the high-resolution GeneChip Scanner 3000 by Affymetrix (Affymetrix, Santa Clara, CA). After hybridization and scanning, the microarray images were analyzed for quality control, looking for major chip defects or abnormalities in hybridization signal.
Statistical Methods
RNA Extraction
For the samples submitted from the 6 participating centers, the distribution-free Kruskal-Wallis test was used to examine the center effect on the following variables pertaining to the RNA isolation step: A260:A280, A260:A270, 28S:18S rRNA ratios, the percent rRNA contribution (%rRNA), and RIN.
cDNA Synthesis and IVT Labeling Reactions
Mixed effects analysis of variance (ANOVA) models were fit to examine each identifiable source of variation on resulting cRNA (concentration, cRNA yield, adjusted cRNA yield) and quality measures (A260:A280). Fixed effects included laboratory (2 levels, VCU or NCI) and sample preservation method (2 levels, RNAlater or frozen). The sample was considered to be a random effect. Before model fitting, normality assumption was examined for each variable using the Kolmogorov-Smirnov test.
GeneChip Hybridization
Affymetrix HG-U133Av2 GeneChip probe set expression summaries were estimated using 2 methods, MAS515 (using the Affymetrix GeneChip Operating Software) and robust multiarray average (RMA) method16,17 (using the affy package18), as recommended by The Tumor Best Practices Working group.19 Quality assessment of each GeneChip was performed by assessing the percent present calls (%PCs) and the 3′:5′ ratios for glyceraldehyde-3-phosphate dehydrogenase (GAPDH) and β-actin as well as the overall 3′:5′ ratio with its associated 95% confidence interval20 using the publicly available application.21 For the hybridized GeneChips, mixed effects ANOVA models were fit by probe set to examine the significance of each potential source of variation, again with laboratory and sample preservation method as fixed effects and sample as a random effect. A moderated t statistic and the Benjamini-Hochberg method for controlling the false discovery rate were used in examining the significance of each fixed effect,22 which are referred to here as adjusted P values. To further examine concordance, the results from the Detection Call algorithm were also examined. After considering Marginally Present calls to be Present, Cohen κ statistic was estimated for each pair of GeneChips and the median κ statistic was reported.23 To provide an estimate of variability about the median κ statistic, the bootstrap estimate of standard error was reported. The limma package24 from Bioconductor25 was used in the R programming environment26 for fitting the probe set level models.
RESULTS
RNA Extraction
Six centers submitted tissues for assessing center effect on the quality of RNA isolation procedures: center 1 (n = 18), center 2 (n = 2), center 3 (n = 3), center 4 (n = 12), center 5 (n = 2), and center 6 (n = 2). There was a significant difference among centers with respect to 28S:18S rRNA ratios (P = 0.002) and %rRNA (P = 0.03). The remaining RNA quality metrics (RIN, A260:A280, and A260:A270) were not significantly different among centers (P = 0.11, P = 0.29, and P = 0.15, respectively). Dotplots revealed that one of the 2 samples submitted by center 2 had evidence of poor quality, as %rRNA<30% and low percent of RNA contribution (Fig. 1) have been associated with poor-quality results.6 For this sample 28S:18S rRNA ratio and RIN were also low. It was later learned that center 2 had not followed the tissue handling protocol with regard to sample storage, which presumably led to the poor-quality results. The sample handling protocol requires that tissue samples collected in RNAlater first be incubated overnight in the reagent at 2 to 8°C, subsequently removed from the RNAlater RNA Stabilization Reagent and then transferred to −80°C for storage. The samples exhibiting partial degradation were stored at −80°C without the initial overnight incubation and without the elimination of the RNAlater. Furthermore, these samples were also shipped with the RNAlater frozen using dry ice.
FIGURE 1.
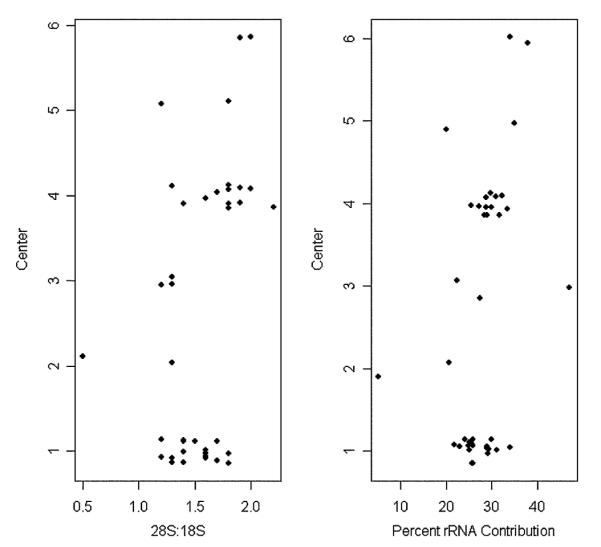
Dotplots of 28S:18S rRNA ratios and %rRNA contribution by submitting center. To prevent overplotting of observations for centers that yielded the same or similar values, the center variable was jittered.
Rechecking RNA Quality at NCI
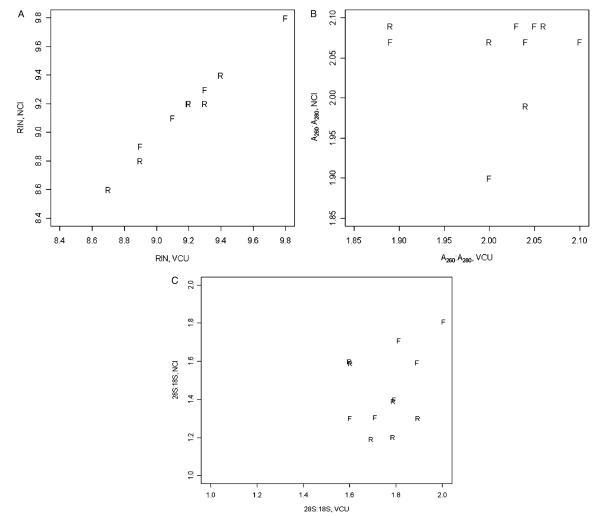
The 12 RNA samples isolated at VCU according to the established protocol were shipped to the NCI laboratory. For assuring starting RNA quality, samples were rechecked. We did not observe significant differences for A260:A280 (P = 0.27) and RIN (P = 0.14) though there was a significant effect for 28S:18S rRNA ratio (P<0.001) (Figs. 2A–C).
FIGURE 2.
For RIN (A), A260:A280 (B), and 28S:18S rRNA ratios (C) VCU sample values are plotted against NCI sample values with the plotting symbol designating preservation method. For the plot of 28S:18S (C), the observations were jittered to prevent overplotting. F indicates frozen; NCI, National Cancer Institute; R, RNAlater; RIN, RNA integrity number; VCU, Virginia Commonwealth University.
cDNA Synthesis and IVT Labeling Reactions
After the cDNA synthesis and IVT labeling reactions, a mixed effects ANOVA model was fit to estimate the fixed effects owing to laboratory (NCI or VCU) and sample preservation method (RNAlater or frozen) considering sample as a random effect for the following variables: concentration, cRNA yield, adjusted cRNA yield, and A260:A280. The Kolmogorov-Smirnov test did not identify any departure from the normality assumption for any of the variables. Concentration, cRNA yield, and adjusted cRNA yield all differed significantly by laboratory (P<0.001 for each comparison), but not by preservation method (Table 1). The differences in cRNA yields can be attributed to differences in sensitivity of the instruments used at the different laboratories for quantifying cRNA and/or differences in efficiency of the synthesis between reagents lot kits. As the cRNA yield for all the samples was higher than 45 μg (from a starting total RNA concentration of 5 μg) and because both laboratories used the same cRNA concentration for the microarray hybridization, the laboratory differences in concentration and cRNA yield had no impact on quality, as measured by the cRNA A260:A280 (P = 0.94, Fig. 3). Moreover, unfragmented cRNA showed appropriate size distribution of labeled transcripts (1.0 kb<cRNA<4.5 kb) for all samples from both laboratories. Sample preservation method did not impact quality, as measured by A260:A280 (P = 0.70, Fig. 3).
TABLE 1.
Estimates, Standard Errors, and P Values for Fixed Effects From Mixed Effects Models (Laboratory and Preservation Method) for Variables Evaluated After cDNA Synthesis Reaction and IVT Labeling Reactions
| Variable | Fixed Effect | Estimate | SE | P |
|---|---|---|---|---|
| Adjusted cRNA (μg) | Laboratory | −64.94 | 14.61 | 0.001 |
| Preservation method | −4.39 | 15.88 | 0.79 | |
| cRNA yield (μg) | Laboratory | −66.29 | 14.55 | <0.001 |
| Preservation method | −8.65 | 15.44 | 0.59 | |
| Concentration (μg/μL) | Laboratory | −2.67 | 0.47 | <0.001 |
| Preservation method | 0.82 | 0.58 | 0.19 | |
| A260:A280 | Laboratory | −0.04 | 0.03 | 0.27 |
| Preservation method | −0.03 | 0.03 | 0.44 |
FIGURE 3.
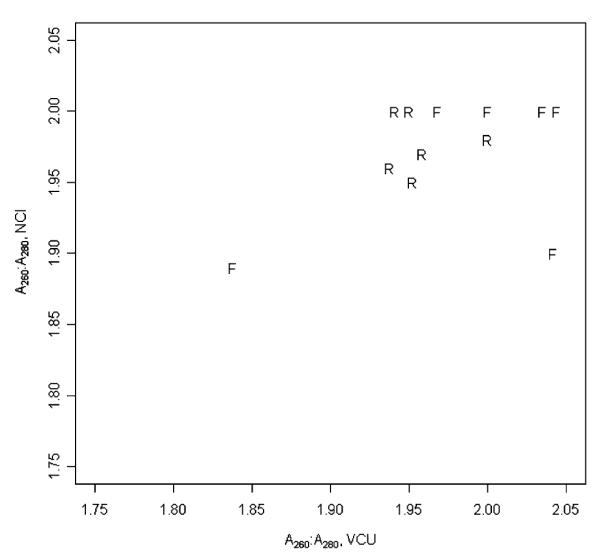
For cRNA, VCU A260:A280 values are plotted against NCI A260:A280 values with the plotting symbol designating sample preservation method. F indicates frozen; R, RNAlater; NCI, National Cancer Institute; VCU, Virginia Commonwealth University.
GeneChip Hybridization
RNA quality was also assessed using data from the hybridized GeneChips (Table 2). The 3′:5′ ratios for GAPDH and β-actin as well as %PCs were obtained using the Affymetrix GeneChip Operating Software (version 1.4.0.036). As GAPDH and β-actin were not normally distributed, the distribution-free Kruskal-Wallis test was used to perform comparisons with respect to laboratory and sample preservation method. There was no significant effect because of laboratory for GAPDH 3′:5′ ratio, β-actin 3′:5′ ratio, %PC (P = 0.42, P = 0.12, P = 0.56, respectively) or because of sample preservation method (P = 0.13, P = 0.24, P = 0.89).
TABLE 2.
Prechip Quality Assessed for Isolated RNA Before cDNA Synthesis and IVT Labeling Reactions (A260:A280, 28S:18S rRNA Ratios, and RIN) and Postchip Quality Assessed After GeneChip Hybridization (%PC and 3′:5′ Ratios for GAPDH and β-actin) for the 12 Paired GeneChips
| Prechip Quality |
Postchip Quality |
|||||||||||
|---|---|---|---|---|---|---|---|---|---|---|---|---|
| VCU |
NCI |
VCU |
NCI |
|||||||||
| A260:A280 | 28S:18S | RIN | A260:A280 | 28S:18S | RIN | % Present |
3′:5′ Ratio, GAPDH |
3′:5′ Ratio, β-actin |
% Present |
3′:5′ Ratio, GAPDH |
3′:5′ Ratio, β-actin |
|
| 1 | 2.03 | 1.9 | 9.1 | 2.09 | 1.6 | 9.1 | 48.8 | 1.69 | 3.16 | 55.1 | 1.29 | 1.95 |
| 2 | 2 | 1.6 | 9.8 | 1.9 | 1.3 | 9.8 | 43.4 | 1.48 | 2.90 | 40.3 | 6.03 | 34.04 |
| 3 | 1.89 | 1.7 | 8.9 | 2.07 | 1.3 | 8.9 | 51.5 | 1.34 | 3.74 | 49.1 | 1.23 | 2.48 |
| 4 | 2.05 | 2 | 8.6 | 2.09 | 1.8 | 8.1 | 44.9 | 1.75 | 4.34 | 41.0 | 1.66 | 3.54 |
| 5 | 2.1 | 1.8 | 9.2 | 2.07 | 1.4 | 9.2 | 45.0 | 1.87 | 4.41 | 43.1 | 1.52 | 2.66 |
| 6 | 2.04 | 1.8 | 9.3 | 2.07 | 1.7 | 9.3 | 43.2 | 1.74 | 3.74 | 49.7 | 1.21 | 2.18 |
| 7 | 1.91 | 1.6 | 9.4 | 2.12 | 1.6 | 9.4 | 44.9 | 1.71 | 4.02 | 49.4 | 1.17 | 1.95 |
| 8 | 2.04 | 1.8 | 9.2 | 1.99 | 1.4 | 9.2 | 50.1 | 1.54 | 3.12 | 51.6 | 1.39 | 2.32 |
| 9 | 2 | 1.8 | 8.9 | 1.82 | 1.2 | 8.8 | 47.5 | 1.51 | 2.38 | 38.5 | 1.55 | 3.49 |
| 10 | 2.06 | 1.6 | 9.2 | 2.09 | 1.6 | 9.2 | 24.0 | 1.19 | 4.89 | 38.7 | 2.09 | 6.77 |
| 11 | 2 | 1.7 | 8.7 | 2.07 | 1.2 | 8.6 | 24.2 | 0.91 | 2.44 | 52.8 | 1.01 | 1.47 |
| 12 | 1.89 | 1.9 | 9.3 | 2.09 | 1.3 | 9.2 | 50.0 | 1.37 | 1.97 | 55.0 | 1.24 | 2.33 |
GAPDH indicates glyceraldehyde-3-phosphate dehydrogenase; IVT, in vitro transcription.
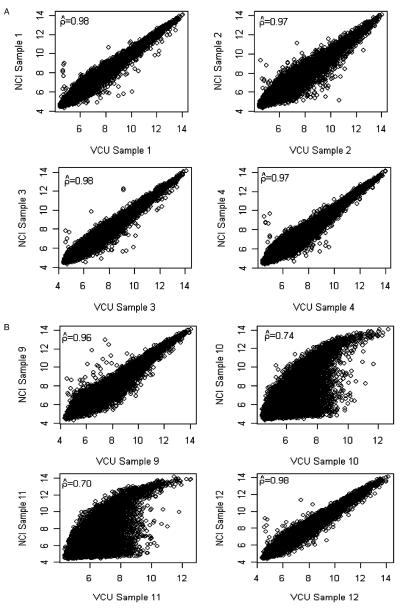
We compared results among the 12 pairs of samples that had been hybridized at both VCU and NCI by creating pairwise scatterplots of probe set expression summaries obtained using the RMA method17 and calculating Pearson’s correlation coefficient. There was a high correspondence between probe set expression summaries obtained from the 2 laboratories (Fig. 4A) except for samples 10 and 11 (Fig. 4B). In fact, multidimensional scaling was applied to the 28S:18S rRNA ratio, RIN, RNA A260:A280, and cRNA A260:A280 quality metrics to identify whether prechip quality measures identified VCU10 and VCU11 would be outlying with respect to quality. No such indication was found (Fig. 5). However, for these 2 samples, the chips that had been hybridized at VCU had a low %PC (24.0% and 24.2%, respectively) compared both to the values obtained at NCI for these samples (38.7% and 52.8%, respectively) and to the overall mean (45.1%). Interestingly, the quality metrics of initial RNA as well as cDNA product synthesis and IVT product labeling reactions revealed no concerns for these 2 samples. For all 12 GeneChip pairs, the median κ statistic was 0.750 (range: 0.37 to 0.80 with a standard error of 0.02); upon excluding pairs 10 and 11, the minimum κ statistic increased to 0.69, with no notable change in the median but a large decrease in the standard error (median excluding 2 pairs 0.752, standard error 0.008).
FIGURE 4.
A, Representative pairwise scatterplots for samples 1 to 4 of probe set expression summaries obtained using the RMA method for VCU and NCI hybridized samples. B, Pairwise scatterplots for samples 9 to 12 of probe set expression summaries obtained using the RMA method for VCU and NCI hybridized samples. NCI indicates National Cancer Institute; RMA, robust multiarray average; VCU, Virginia Commonwealth University.
FIGURE 5.
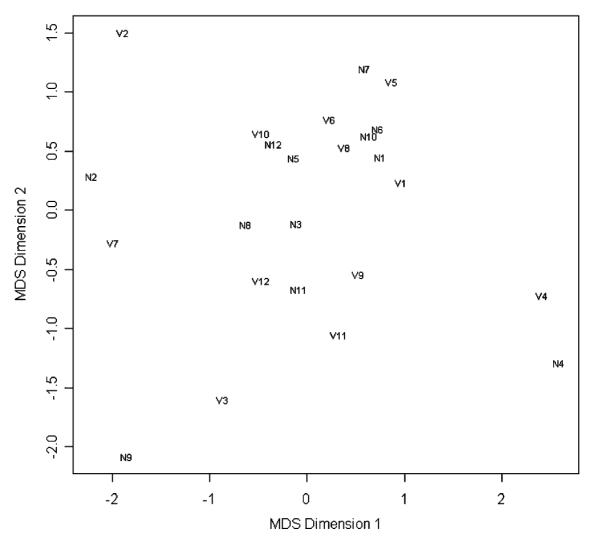
Plot of first and second coordinates from multi-dimensional scaling applied to the 28S:18S rRNA ratios, RIN, and A260:A280 quality metrics reactions were examined to identify whether prechip quality measures identified VCU10 and VCU11 would be outlying with respect to quality. For each point plotted, “V” indicates a VCU processed sample, whereas “N” indicates an NCI processed sample. NCI indicates National Cancer Institute; RIN, RNA integrity number; VCU, Virginia Commonwealth University.
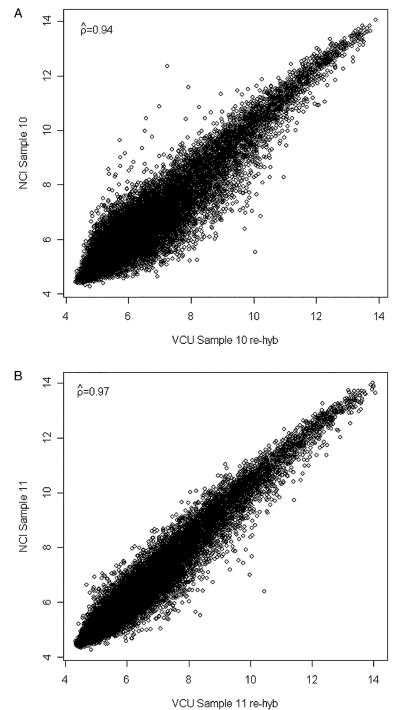
To investigate the reason for the poor-quality hybridization for GeneChips 10 and 11 at VCU, the stored hybridization cocktail for these 2 samples was hybridized to 2 new GeneChips, but similar results were obtained. We noticed that the resulting pixel level image plots for both problematic samples were unusually bright and grainy (Supplemental Figs. 1A and C). Therefore, starting from the cDNA products from the initial reaction, new IVT reactions were run and the resulting cRNA was hybridized to yet another pair of GeneChips. For both VCU 10 and 11, high-quality hybridizations were now observed for both the pixel level images (Supplemental Figs. 1B and D) and the posthybridization quality metrics (%PC 47.9% and 53.5%; GAPDH 3′:5′ ratios 1.12 and 1.48; β-actin 3′:5′ ratios 1.38 and 1.18, respectively). The correlations between the VCU and NCI GeneChip results were now 0.94 for sample 10 (Fig. 6A) and 0.97 for sample 11 (Fig. 6B). Therefore, although high-quality RNA and cDNA was observed for these 2 samples, it seems that a problem during the IVT reaction affected the hybridization quality (but not the cRNA yield). This emphasizes the importance of monitoring all processes from RNA extraction, to cDNA and cRNA synthesis, as well as the posthybridization quality of the resulting GeneChips.
FIGURE 6.
A, Scatterplot of VCU 10 rehyb versus NCI 10 using probe set expression summaries obtained using the RMA method. B, Scatterplot of VCU 11 rehyb versus NCI 11 using probe set expression summaries obtained using the RMA method. NCI indicates National Cancer Institute; RMA, robust multiarray average; VCU, Virginia Commonwealth University.
In addition to examining quality metrics on the posthybridized GeneChips, we also examined reproducibility of gene expression values obtained in the 2 laboratories. For probe set expression summaries based on the RMA method, there was no significant effect owing to sample preservation method for any probe set (adjusted P value >0.46 for all sets). In fact, only 7 probe sets had a raw P value <0.001 for the sample preservation fixed effect. In contrast, 706 probe sets had a significant laboratory effect having an adjusted P value <0.001. We note that Affymetrix control probe sets should not be identified as being differentially expressed, and some have argued that a good measure for identifying false-positive calls would be to examine at what level Affymetrix control probe sets show up as differentially expressed.24 Examining the Affymetrix control probe sets, 26 of the 61 had adjusted P values <0.001, with one value ranging to 5e-8. In fact, among all 22,277 probe sets, the 2 smallest P values were for control probe sets AFFX-DapX-3_at and AFFX-r2-Bs-dap-3_at, whereas control probe sets AFFX-DapX-M_at and AFFX-r2-Bs-dap-M_at had the 6th and 8th smallest adjusted P value. Again, theoretically, control probe sets should not be differentially expressed. Therefore, it has been recommended to use the smallest P value among control probe sets as a conservative method for identifying differentially expressed genes that does not rely on distributional assumptions.24 Using this approach, no probe sets have a significant laboratory effect. Further examination of the associated volcano plot for laboratory effect using RMA probe set expression summaries revealed the fold-changes for those probe sets called significant were inconsequential, with fold changes ranging from — 1.34 to 1.10 (Fig. 7).
FIGURE 7.
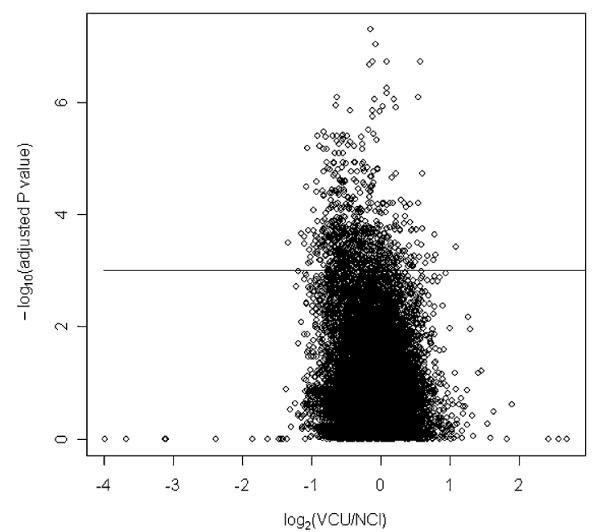
Volcano plot for laboratory effect using RMA probe set expression summaries. Each point represents a probe set where the x-axis is fold-change and y-axis is −log10 (adjusted P value). The solid line is the threshold used to identify significant probe sets. RMA indicates robust multiarray average.
When the MAS5 expression summary method was used, again, there was no significant effect owing to sample preservation method for any probe set (adjusted P value>0.60 for all comparisons). For MAS5 probe set expression summaries, 203 probe sets had a significant laboratory effect using an adjusted P value <0.001, though only 1 probe set (221619_s_at) had a P value smaller than a control probe set for laboratory effect.
DISCUSSION
To ensure highly reproducible microarray data, total RNA samples and cDNA and cRNA synthesis steps need to meet rigorous quality control criteria. In particular, the quality of data from gene expression studies using microarray analysis is strongly related to the quality of the RNA extracted from the tissues. As such, it is crucial to assure initial sample quality in microarray-based studies.6–8
In this study, we examined the effects of submitting center (sample collection, storage, and shipment) and sample preservation method (RNAlater or frozen tissues) on initial RNA quality, as well as the effect of laboratory and sample preservation method on cDNA synthesis, IVT labeling reactions, and microarray hybridizations. These evaluations are critical in multicenter studies to ensure all participating centers adhere to established protocols. Use of consistent protocols sample collection, RNA extraction, cDNA/cRNA synthesis, labeling, hybridization, platform, image acquisition, normalization, and expression summaries can yield consistent expression values across laboratories.27 One center provided samples with poor quality. Further investigation revealed that this center did not follow the protocol for archival storage at −80°C using RNAlater, which likely affected the RNA quality. To mitigate future noncompliance with the tissue handling protocol, the study-coordinating center will monitor changes in personnel and provide training for new personnel regarding appropriate tissue procurement procedures.
In addition, we evaluated quantitative criteria to control every stage of the process and assay reproducibility by testing interlaboratory variation. These criteria ensure optimum quality of the RNA sample, in terms of chemical purity and integrity, as well as the efficiency of the synthesis of the final product that hybridizes the microarray. From the analysis of our quality control parameters, we observed that %rRNA contribution, A260:A280 ratio, and RIN were the better indicators of RNA purity and integrity. In a previous study, we demonstrated the value of %rRNA contribution and A260:A280 ratio when testing RNA quality.6 Although RIN corresponds to sample quality,28 there is currently no agreed upon RIN threshold for identifying samples that consistently yield high-quality hybridizations.29–32 In addition, previous researchers found that RIN alone was not sufficient in identifying poor-quality hybridizations, nor were they able to identify an optimal cut point for RIN that distinguish hybridization by quality.31 For new experimental conditions, it is recommended that a suitable RIN threshold be determined. We observed a statistically significant difference for 28S:18S rRNA ratios between laboratories. This difference can be a result of technical issues associated with sample shipment (ie, extra-freeze–thaw cycle). However, this finding was not associated with microarray results quality. Moreover, it has already been demonstrated that 28S:18S rRNA ratio is not a critical parameter for RNA quality evaluation.6,33 Based on our previous6 and present experience, we established that 28S:18S rRNA ratio has to exceed 0.8 for sample inclusion.
Although only samples meeting our prechip quality thresholds were hybridized, 2 GeneChips yielded low percent present results, apparently owing to problematic IVT labeling (which did not affect the cRNA yield). This observation emphasizes the importance of monitoring all processes from RNA extraction through hybridization. In a clinical study, these samples would have been eliminated from the analyses because of poor image quality and because their %PCs fell far outside the range determined by , which for this study was (34.9%, 55.3%). Supporting the utility of the preestablished markers for the specific evaluation of successful hybridization, washing, and staining procedures, we recently reported that the %PC is a good indicator of quality of the microarray,6 correlating with the quality of the sample only when comparisons were made within the same tissue or cell.
We were adequately powered to identify whether any differences existed owing to sample preservation method (RNAlater/frozen). Sample size was based on the primary interest in detecting whether there are significant differences in gene expression owing to sample preservation method. A sample size of 6 in each sample preservation method group will have 99% power to detect a fold change in means (expected ratio) of 1.5 assuming that the coefficient of variation is 0.083 (using preliminary estimates on log2 scale of σ = 0.5 μ = 66) and using a 2 group t test with a 0.001 two-sided significance level. No significant effect was noted owing to sample preservation method, which ensures our tissue handling protocols are working properly. This finding has a high impact in our multicenter study design allowing the use of RNAlater for collecting samples during surgical procedures. In our experience, this protocol guaranteed RNA quality, increased the number of collected specimens, and decreased the cost for sample collection. Tubes with the appropriate volume of RNAlater are now kept in the operation room where the surgeons harvest the tissues and are picked-up by research coordinators within 12 hours of the procedure.
In a previous study using a set of technical replicates, we demonstrated that differences owing to day, module, and storage modality (fresh vs. fragmented) did not significantly contribute to probe set variation.6 Others have demonstrated that technician and laboratory variation are among the largest sources of gene expression variation.34 In another study, researchers demonstrated that substantial gene expression variation owing to laboratory persisted, but was mitigated after implementing standardized protocols for RNA labeling, hybridization, microarray processing, data acquisition, and data normalization.27 To minimize variability owing to tissue acquisition in a multicenter gene expression study, it is imperative that tissue acquisition procedures be standardized among all participating centers. Moreover, it is essential that standardized protocols for RNA labeling, hybridization, microarray processing, data acquisition, and data normalization be used to achieve reproducible gene expression microarray results. In this study, we demonstrated that for the samples collected using standardized procedures resulting in high-quality samples that were hybridized, sample preservation method (RNAlater/frozen) was not an important contributor to sample quality or probe set expression. In addition, laboratory effect did not significantly contribute to sample quality, and probe set expression was not importantly affected by laboratory. These results are encouraging for designing large multicenter gene expression studies.
Supplementary Material
ACKNOWLEDGMENTS
The following individuals were instrumental in the planning, conduct, and/or care of patients enrolled in this study at each of the participating A2ALL institutions as follows: Northwestern University, Chicago, IL (DK62467): PI: Michael M.I. Abecassis, MD, MBA; Co-PI: Andreas Blei, MD; Study Coordinator: Patrice Al-Saden, RN, CTCC; University of Pennsylvania Health System, Philadelphia, PA (DK62494): PI: Abraham Shaked, MD, PhD; Co-PI: Kim M. Olthoff, MD; Study Coordinators: Mary Kaminski, PA-C; Mary Shaw, RN, BBA; University of California Los Angeles, Los Angeles, CA (DK62496): PI: Rafik Mark Ghobrial, MD, PhD; Co-PI: Ronald W. Busuttil, MD, PhD; Study Coordinator: Lucy Artinian, RN, MN; University of California San Francisco, San Francisco, CA (DK62444): PI: Chris E. Freise, MD, FACS; Co-PI: Norah A. Terrault, MD; Study Coordinator: Dulce MacLeod, RN; University of Michigan Medical Center, Ann Arbor, MI (DK62498): PI: Robert M. Merion, MD; DCC Staff: Anna S.F. Lok, MD; Akinlolu O. Ojo, MD, PhD; Brenda W. Gillespie, PhD; Douglas R. Armstrong, RN, MS; Margaret Hill-Callahan, BS, LSW; Terese Howell, BS; Lan Tong, MS; Tempie H. Shearon, MS; Karen A. Wisniewski, MPH; Monique Lowe, BS; University of North Carolina, Chapel Hill, NC (DK62505): PI: Jeffrey H. Fair, MD; Study Coordinator: Carrie A. Nielsen, MA; Medical College of Virginia Hospitals, Virginia Commonwealth University, Richmond, VA (DK62531): PI: Robert A. Fisher, MD, FACS; Co-PI: Mitchell L. Shiffman, MD; Study Coordinators: Ede Fenick, RN; April Ashworth, RN; National Institute of Diabetes and Digestive and Kidney Diseases, Division of Digestive Diseases and Nutrition, Bethesda, MD: James E. Everhart, MD; Leonard B. Seeff, MD; Patricia R. Robuck, PhD; Jay H. Hoofnagle, MD.
Supported by the National Institute of Diabetes and Digestive and Kidney Diseases 1RO1-DK069859 as well as by the Intramural Research Program of the National Institutes of Health, National Cancer Institute, Division of Cancer Epidemiology and Genetics. The content of this publication does not necessarily reflect the views or policies of the Department of Health and Human Services, nor does mention of trade names, commercial products, or organizations imply endorsement by the US Government.
Footnotes
Supplementary data available at http://www.molecularpathology.com.
REFERENCES
- 1.DeRisi J, Penland L, Brown PO, et al. Use of a cDNA microarray to analyse gene expression patterns in human cancer. Nat Genet. 1996;14:457–460. doi: 10.1038/ng1296-457. [DOI] [PubMed] [Google Scholar]
- 2.Xiang Z, Yang Y, Ma X, et al. Microarray expression profiling: analysis and applications. Curr Opin Drug Discov Dev. 2003;6:384–395. [PubMed] [Google Scholar]
- 3.Pusztai L, Ayers M, Stec J, et al. Clinical application of cDNA microarrays in oncology. Oncologist. 2003;8:252–258. doi: 10.1634/theoncologist.8-3-252. [DOI] [PubMed] [Google Scholar]
- 4.Manning AT, Garvin JT, Shahbazi RI, et al. Molecular profiling techniques and bioinformatics in cancer research. Eur J Surg Oncol. 2007;33:255–265. doi: 10.1016/j.ejso.2006.09.002. [DOI] [PubMed] [Google Scholar]
- 5.Schuchhardt J, Beule D, Malik A, et al. Normalization strategies for cDNA microarrays. Nucleic Acids Res. 2000;28:E47. doi: 10.1093/nar/28.10.e47. [DOI] [PMC free article] [PubMed] [Google Scholar]
- 6.Dumur CI, Nasim S, Best AM, et al. Evaluation of quality control criteria in microarray gene expression analysis. Clin Chem. 2004;50:1994–2002. doi: 10.1373/clinchem.2004.033225. [DOI] [PubMed] [Google Scholar]
- 7.Schinke-Braun M, Couget JA. Expression profiling using Affymetrix GeneChip probe arrays. Methods Mol Biol. 2007;366:13–40. doi: 10.1007/978-1-59745-030-0_2. [DOI] [PubMed] [Google Scholar]
- 8.Burgoon LD, Eckel-Passow JE, Gennings C, et al. Protocols for the assurance of microarray data quality and process control. Nucleic Acids Res. 2005;33:e172. doi: 10.1093/nar/gni167. [DOI] [PMC free article] [PubMed] [Google Scholar]
- 9.Frueh FW. Impact of microarray data quality on genomic data submissions to the FDA. Nat Biotechnol. 2006;24:1105–1107. doi: 10.1038/nbt0906-1105. [DOI] [PubMed] [Google Scholar]
- 10.Hartmann O. Quality control for microarray experiments. Methods Inf Med. 2005;44:408–413. [PubMed] [Google Scholar]
- 11.Lee EK, Yi SG, Park T. ArrayQCplot: software for checking the quality of microarray data. Bioinformatics. 2006;22:2305–2307. doi: 10.1093/bioinformatics/btl367. [DOI] [PubMed] [Google Scholar]
- 12.Wang X, Ghosh S, Guo SW. Quantitative quality control in microarray image processing and data acquisition. Nucleic Acids Res. 2001;29:E75–E75. doi: 10.1093/nar/29.15.e75. [DOI] [PMC free article] [PubMed] [Google Scholar]
- 13.Raffelsberger W, Dembele D, Neubauer MG, et al. Quality indicators increase the reliability of microarray data. Genomics. 2002;80:385–394. doi: 10.1006/geno.2002.6848. [DOI] [PubMed] [Google Scholar]
- 14.Tseng GC, Oh MK, Rohlin L, et al. Issues in cDNA microarray analysis: quality filtering, channel normalization, models of variations and assessment of gene effects. Nucleic Acids Res. 2001;29:2549–2557. doi: 10.1093/nar/29.12.2549. [DOI] [PMC free article] [PubMed] [Google Scholar]
- 15.Hubbell E, Liu W-M, Mei R. Robust estimators for expression analysis. Bioinformatics. 2002;18:1585–1592. doi: 10.1093/bioinformatics/18.12.1585. [DOI] [PubMed] [Google Scholar]
- 16.Irizarry RA, Hobbs B, Collin F, et al. Exploration, normalization, and summaries of high density oligonucleotide array probe level data. Biostatistics. 2003;4:249–264. doi: 10.1093/biostatistics/4.2.249. [DOI] [PubMed] [Google Scholar]
- 17.Irizarry RA, Bolstad BM, Collin F, et al. Summaries of Affymetrix GeneChip probe level data. Nucleic Acids Res. 2003;31:e15. doi: 10.1093/nar/gng015. [DOI] [PMC free article] [PubMed] [Google Scholar]
- 18.Gautier L, Cope L, Bolstad BM, et al. Affy-analysis of Affymetrix GeneChip data at the probe level. Bioinformatics. 2004;20:307–315. doi: 10.1093/bioinformatics/btg405. [DOI] [PubMed] [Google Scholar]
- 19.The Tumor Best Practices Working Group Expression profiling-best practices for data generation and interpretation in clinical trials. Nat Rev Genet. 2004;5:229–238. doi: 10.1038/nrg1297. [DOI] [PubMed] [Google Scholar]
- 20.Archer KJ, Dumur CI, Joel SE, et al. Assessing quality of hybridized RNA in Affymetrix GeneChip experiments using mixed effects models. Biostatistics. 2006;7:198–212. doi: 10.1093/biostatistics/kxj001. [DOI] [PubMed] [Google Scholar]
- 21.Archer KJ, Guennel T. An application for assessing quality of RNA hybridized to Affymetrix GeneChips. Bioinformatics. 2006;22:2699–2701. doi: 10.1093/bioinformatics/btl459. [DOI] [PubMed] [Google Scholar]
- 22.Smyth GK. Linear models and empirical Bayes methods for assessing differential expression in microarray experiments. Stat Appl Genet Mol Biol. 2004;3 doi: 10.2202/1544-6115.1027. Article 3. [DOI] [PubMed] [Google Scholar]
- 23.Simonoff JS. Analyzing Categorical Data. Springer; New York: 2003. [Google Scholar]
- 24.Smyth GK. Limma: linear models for microarray data. In: Gentle-man R, Carey VJ, Dudoit S, et al., editors. Bioinformatics and Computational Biology Solutions Using R and Bioconductor. Springer; New York: 2005. pp. 397–420. [Google Scholar]
- 25.Gentleman R, Carey V, Bates D, et al. Bioconductor: open software development for computational biology and bioinformatics. Genome Biol. 2004;5:R80. doi: 10.1186/gb-2004-5-10-r80. [DOI] [PMC free article] [PubMed] [Google Scholar]
- 26.Development Core Team . R: A Language and Environment for Statistical Computing. R Foundation for Statistical Computing; Vienna, Austria: 2005. [Google Scholar]
- 27.Bammler T, Beyer RP, Bhattacharya S, et al. Standardizing global gene expression analysis between laboratories and across platforms. Nat Methods. 2005;2:351–356. doi: 10.1038/nmeth754. [DOI] [PubMed] [Google Scholar]
- 28.Mueller O, Lightfoot S, Schroeder A. RNA Integrity Number (RNA)-standardization of RNA quality control. Agilent Application Note. 2004:1–8. Publication Number 5989-1165EN. [Google Scholar]
- 29.Imbeaud S, Graudens E, Boulanger V, et al. Towards standardization of RNA quality assessment using user-independent classifiers of microcapillary electrophoresis traces. Nucleic Acids Res. 2005;33:e56. doi: 10.1093/nar/gni054. [DOI] [PMC free article] [PubMed] [Google Scholar]
- 30.Weis S, Llenos IC, Dulay JR, et al. Quality control for microarray analysis of human brain samples: the impact of postmortem factors, RNA characteristics, and histopathology. J Neurosci Methods. 2007;165:198–209. doi: 10.1016/j.jneumeth.2007.06.001. [DOI] [PubMed] [Google Scholar]
- 31.Jones L, Goldstein DR, Hughes G, et al. Assessment of the relationship between pre-chip and post-chip quality measures for Affymetrix GeneChip expression data. BMC Bioinformatics. 2006;7:211. doi: 10.1186/1471-2105-7-211. [DOI] [PMC free article] [PubMed] [Google Scholar]
- 32.Copois V, Bibeau F, Bascoul-Mollevi C, et al. Impact of RNA degradation on gene expression profiles: assessment of different methods to reliably determine RNA quality. J Biotechnol. 2007;127:549–559. doi: 10.1016/j.jbiotec.2006.07.032. [DOI] [PubMed] [Google Scholar]
- 33.Schoor O, Weinschenk T, Hennenlotter J, et al. Moderate degradation does not preclude microarray analysis of small amounts of RNA. Biotechniques. 2003;35:1192–1196. 1198–1201. doi: 10.2144/03356rr01. [DOI] [PubMed] [Google Scholar]
- 34.Irizarry RA, Warren D, Spencer F, et al. Multiple-laboratory comparison of microarray platforms. Nat Methods. 2005;2:345–350. doi: 10.1038/nmeth756. [DOI] [PubMed] [Google Scholar]
Associated Data
This section collects any data citations, data availability statements, or supplementary materials included in this article.


