Abstract
Diffusion tensor MRI (DTI) is a method to noninvasively assess cellular organization and integrity in vivo. In the present study, in vivo DTI was performed to demonstrate its capability of reflecting the photoreceptor cell alignment in adult C57BL/6 wildtype (WT) mice. Age-matched retinal degeneration 1 (rd1) mice were employed as the negative control, i.e., loss of photoreceptor cell layer. In WT mice, DTI estimated cell alignment suggests that the MR-detected outer retina layer comprises cells aligning perpendicular to the retinal surface, consistent with the known organization of photoreceptor cells. The MR-detected outer retina layer exhibited lower apparent diffusion coefficient (ADC) and higher fractional anisotropy (FA) than the other two MR-detected retina layers (p < 0.05 for all comparisons). In rd1 mice, the remaining MR-detected retina layer exhibits different cell alignment, ADC, or FA from that of MR-detected outer retina layer in WT mice (p < 0.05 for all comparisons), reflecting the degeneration of photoreceptor cells in rd1 mouse retina. Overall, our finding suggests that in vivo DTI assessment of mouse retina with normal physiology or degenerative pathology is feasible.
Keywords: retina, diffusion tensor MRI, apparent diffusion coefficient, cell alignment, fractional anisotropy
INTRODUCTION
To accommodate the visual function, the retina has developed a unique cellular organization. It contains multiple types of neuronal and glial cells organized in ten layers of morphologically distinct substructures (see Fig. 2C) (1). This organization is necessary to carry out visual function to accept, preprocess, and transmit light stimuli. Disruption of the retinal cell organization is a common pathology in eye diseases.
Figure 2.
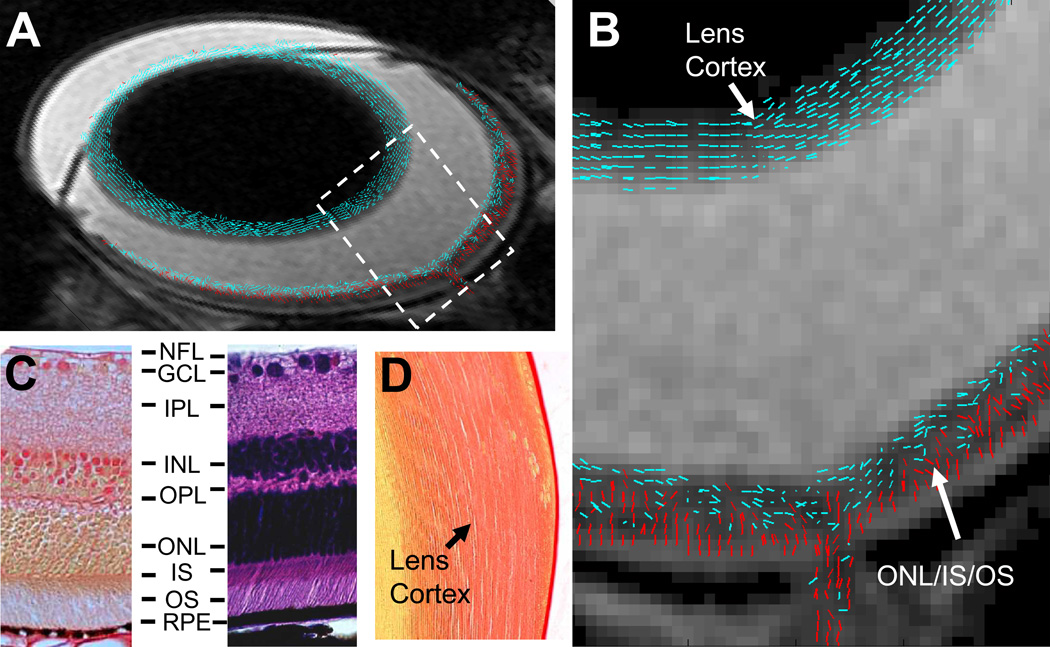
A composite (A) and the expanded bird’s-eye view (B) images show DTI revealed cell alignment in a WT mouse eye. Cell alignments were color coded to differentiate cells aligned more parallel to (≤ 45°, blue) or perpendicular to (> 45°, red) the retina or lens surface. A picrocirous red (C, left) and an H&E (C, right) stained retina sections of a WT mouse show that photoreceptor nuclei in ONL and inner and outer segments in IS/OS are aligned nearly perpendicular to the retinal surface. A picrocirous red stained lens section of the WT mouse shows fiber cells in the lens cortex are aligned parallel to the lens surface (D). RPE, retinal pigment epithelium.
Noninvasive ocular imaging plays a crucial role in diagnosing retinal diseases. Optical imaging, such as optical coherence tomography (OCT) (2), sensitively detects pathological changes of retinal anatomy in high resolution. Unfortunately, optical imaging methods are not sensitive to molecular or sub-cellular changes underlying the pathogenesis of retinal diseases. Magnetic resonance imaging (MRI) is one of the most widely used imaging modalities to diagnose human central nervous system disorders (3–5). The utility of MRI deeply roots in its rich tissue contrast that is sensitive to alterations in cellular integrity and activity, resulting in visible image changes that may occur early before the evidence of clinical symptoms (6–8). However, the application of in vivo MRI in visual system is uncommon because of its relatively limited image resolution (typically hundreds of µm) for revealing ocular anatomy.
MRI could provide noninvasive measures of retinal cellular and vascular pathology in vivo (9,10). Previous studies have shown that manganese enhanced MRI detected neuron cell ion homeostasis alteration in oxygen induced retinopathy (11) and blood-oxygen-level-dependent MRI revealed reduced retinal neuron cell activity in retinal degeneration (12). The recent work of Shen et al. and our group have demonstrated that diffusion weighted MRI (DWI) detected substantially different directional water diffusivity in MR-detected retina layers correlating with local cell organization (13,14). These findings motivated the present diffusion tensor MRI (DTI) measurements to assess its feasibility to evaluate the cellular structure of retinal photoreceptor cell layer in vivo.
DTI measures the anisotropic diffusion of water molecules in neuronal tissues (15). The derived eigenvalues of diffusion tensor (λ1, λ2, and λ3), apparent diffusion coefficient (ADC), fractional anisotropy (FA), and cell alignment are magnetic field independent indices for noninvasive assessment of cell integrity and organization in central nervous system diseases (7). In this study, in vivo DTI was performed at 47 × 47 × 400 µm3 resolution to assess retinal cell alignment and water diffusion in adult C57BL/6 wildtype (WT) and retinal degeneration 1 (rd1) mice.
MATERIALS AND METHODS
Experimental Protocol
Two to four months old male WT (n = 6) and rd1 mice (n = 5) were examined. Mice were anesthetized with an intraperitoneal injection of a ketamine (87mg/kg) /xylazine (13mg/kg) cocktail. A pneumatic pillow and a rectal temperature probe were employed to detect mouse respiratory motion and temperature (SA Instruments, NY). A subcutaneous catheter was implanted to allow continuous infusion of the aforementioned ketamine/xylazine cocktail at ~2.6 ml/kg/hr to achieve a sustained anesthesia during MRI. A single-turn radio-frequency solenoid coil (inner diameter = 1 cm) was positioned on top of the left eye for MRI. During the period of image acquisition, the body temperature of the mouse was maintained at 37°C and the respiratory rate was monitored using a MR compatible small animal heating and monitoring system (SA Instruments, NY). Infusion rate of ketamine/xylazine cocktail for individual mouse was adjusted to maintain the respiratory rate between 150 and 210 min−1 throughout the experiment. All procedures in this study conformed to the guidelines set forth by Animal Studies Committee of Washington University in St. Louis.
MR Imaging
MR experiments were performed on an 11.74 T horizontal Varian UNITY-INOVA spectrometer (Varian Associates, Palo Alto, CA) equipped with an 8-cm inner diameter gradient and shim insert (maximum gradient strength = 120 Gauss/cm). Scout images were acquired using a standard multi-slice spin echo sequence. A transverse slice that bisects the eye through the optic nerve was located from scout images using a 3D planning program written in Matlab (The Mathworks Inc., Natick, MA). T1-weighted images were acquired using a standard spin-echo sequence with the following parameters: TR 400 ms, TE 18 ms, slice thickness 400 µm, field of view (FOV) 12 × 12 mm2, in-plane resolution 47 × 47 µm2, data matrix 256 × 256 zero filled to 512 × 512, number of averages 8, and acquisition time 14 min. DTI was performed using a standard spin-echo sequence incorporating a pair of diffusion sensitizing gradients. Acquisition parameters were: TR 2000 ms, TE 35 ms, Δ 15 ms, δ 5 ms; b-value 0 and 955 s/mm2, slice thickness 400 µm, FOV 12 × 12 mm2, in-plane resolution 47×47 µm2, data matrix 256 × 256 zero filled to 512 × 512, number of averages 2, 90° and 180° rf pulse width 4000 ms, and acquisition time ~2 hours. Diffusion sensitizing gradients were applied in six directions, i.e. [1 0 1], [1 0 −1], [0, 1 1], [0 1 −1], [1 1 0], [1 −1 0] (13). To minimize the effect of background magnetic field gradient on diffusion measurement, a pair of diffusion-weighted images with positive or negative diffusion sensitizing gradients was acquired in each direction. The geometric mean of each pair of diffusion weighted images was used to derive diffusion tensor parameters (13). Repeated diffusion weighted images were processed and compared to assess the effect of global eye motions. Specifically, the averaged images were compared with each individual measured image to evaluate if any voxel shift in retina is present. Any measurement with significant voxel shift beyond registration was discarded.
Data Analysis
Segmentation of the retina layers was performed using both non-diffusion weighted (b-value = 0) and diffusion weighted images (Fig. 1). First, regions on the non-diffusion weighted image exhibiting signal intensity below three standard deviation of the noise, such as the background, lens nucleus, and sclera, were automatically identified and excluded from data analysis. Second, the retina/choroid complex was automatically identified by the hyper-intense layer in diffusion weighted images, i.e., region exhibit signal intensity > mean + 3×SD of the vitreous signal. Third, the choroid was identified by the hyper-intensity on T1-weighted images due to its shorter T1 (13). Finally, the MR-detected retina layers were segmented based on their signal intensity differences using previously described method (13). To reduce vitreous partial volume effect, retinal pixels immediately adjacent to the vitreous were excluded from data analysis. Because of the reduced thickness and lack of layer contrast at the peripheral retina, quantitative analysis of the retina was performed in two central retinal regions that located between 250 and 800 µm away from the optic nerve head at each side.
Figure 1.
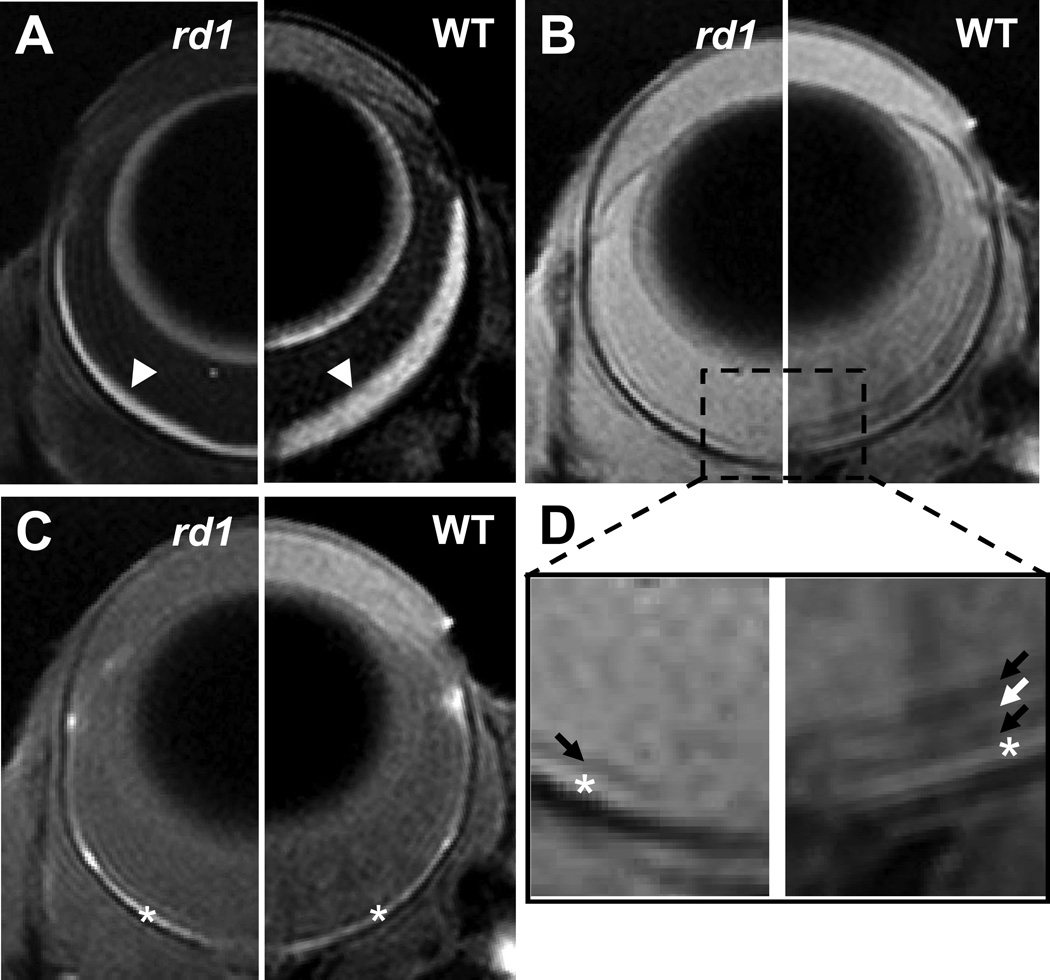
Diffusion weighted (A), non-diffusion weighted (B), and T1-weighted images of the eyes of an rd1 (left side) and a WT (right side) mice. The zoom-in view of non-diffusion weighted image (D) shows a dark retinal layer in the rd1 mouse eye and three retinal layers exhibiting dark-bright-dark signal intensity in the WT mouse eye. Arrow heads indicate retina/choroid complex; arrows indicate MR-detected retina layers; * indicates the choroid.
ADC, eigenvalues (i.e. λ1, λ2 and λ3) of diffusion tensor, and FA were calculated as previously reported (16). The primary eigenvector of the diffusion tensor is considered as the direction of cell alignment in each image voxel (17).
Histology
Upon the completion of MRI, mice were perfusion-fixed with 4% paraformaldehyde. Eyes were enucleated, placed in 4% paraformaldehyde overnight, embedded with paraffin, and sectioned at five-µm thick. Sections were stained with hematoxylin and eosin (H&E) to identify the retinal cell layers and cell organizations. Picrosirius red staining was used to highlight the cell organization in ONL and lens cortex.
Statistical Analysis
All statistical analyses were performed using SAS software (SAS Institute, Cary, NC). Data were expressed as mean ± SD. For comparisons between two experimental groups, the significance of the difference between the means was calculated. One-way analysis of variance (ANOVA) was used to test the difference of ADC or FA among the MR-detected retina layers of rd1 and WT mice. Two-way ANOVA was used to test the differences of λ1–3 among the MR-detected retina layers of rd1 and WT mice. When overall significance of p < 0.05 was attained by ANOVA, comparisons between means were performed using the Freeman-Tukey test. In all cases, a p < 0.05 was taken to indicate statistically significant difference.
RESULTS
The layered organization of retinal cells may be partially resolved by MRI. The retina/choroid complex was clearly identified by the hyper-intensity on diffusion weighted images (Fig. 1A). The reduced thickness of retina/choroid complex in rd1 mice is visually apparent. On non-diffusion weighted images, four and two MR-detected layers were observed within the retina/choroid complex of WT and rd1 mice, respectively (Fig. 1B). The outer-most layer exhibiting hyper-intensity on T1-weighted images was identified as the choroid (Fig. 1C). From vitreous side, the MR-detected inner, middle, and outer retina layers in WT mice were tentatively assigned to nerve fiber layer/ganglion cell layer/inner plexiform layer (NFL/GCL/IPL), inner nuclear layer/outer plexiform layer (INL/OPL), and outer nuclear layer/inner segments/outer segments (ONL/IS/OS) as previously reported (Fig. 1D) (13). Photoreceptor cell degeneration (i.e., the layer comprising ONL/IS/OS) in rd1 mice makes the separation of the remaining INL/OPL from the bright choroid difficult (Fig. 1D). The MR-detected dark retina layer in rd1 mice was tentatively assigned to NFL/GCL/IPL.
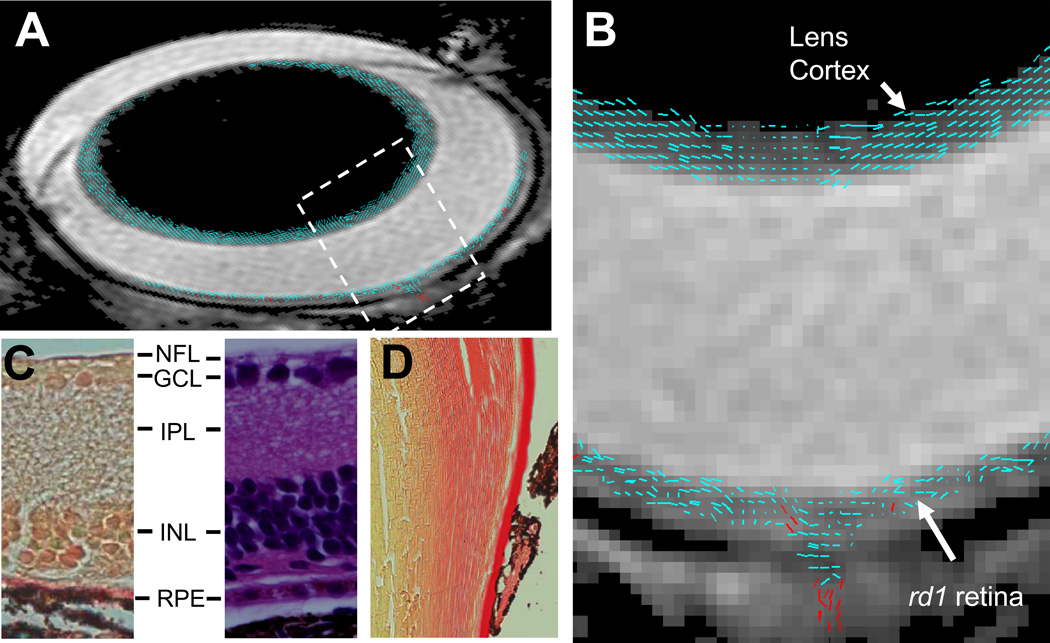
The retinal cell alignment was estimated by DTI determined primary eigenvector of diffusion tensor. In WT mice, the cells in MR-detected outer retina layer were aligned nearly perpendicular to the retinal surface (the angle between cell alignment and retinal surface = 64 ± 3°), consistent with histology revealed photoreceptor cell organization in ONL/IS/OS (Fig. 2). In rd1 mice, the single MR-detected retina layer was lacking of cells aligned perpendicular to the retinal surface agreeing with histology revealed degeneration of photoreceptor cells (Fig. 3). The accuracy of DTI measured cell alignment was demonstrated by the detected similar lens fiber cell alignment in all mice reflecting the unchanged lens cell structure.
Figure 3.
A composite (A) and the expanded bird’s-eye view (B) images show DTI revealed cell alignment in an rd1 mouse eye. Cell alignments were color coded to differentiate cells aligned more parallel to (≤ 45°, blue) or perpendicular to (> 45°, red) the retina or lens surface. A picrocirous red (C, left) and an H&E (C, right) stained retina sections of an rd1 mouse show the lack of photoreceptor cells. A picrocirous red stained lens section of the rd1 mouse shows fiber cells in the lens cortex are aligned parallel to the lens surface (D). RPE, retinal pigment epithelium.
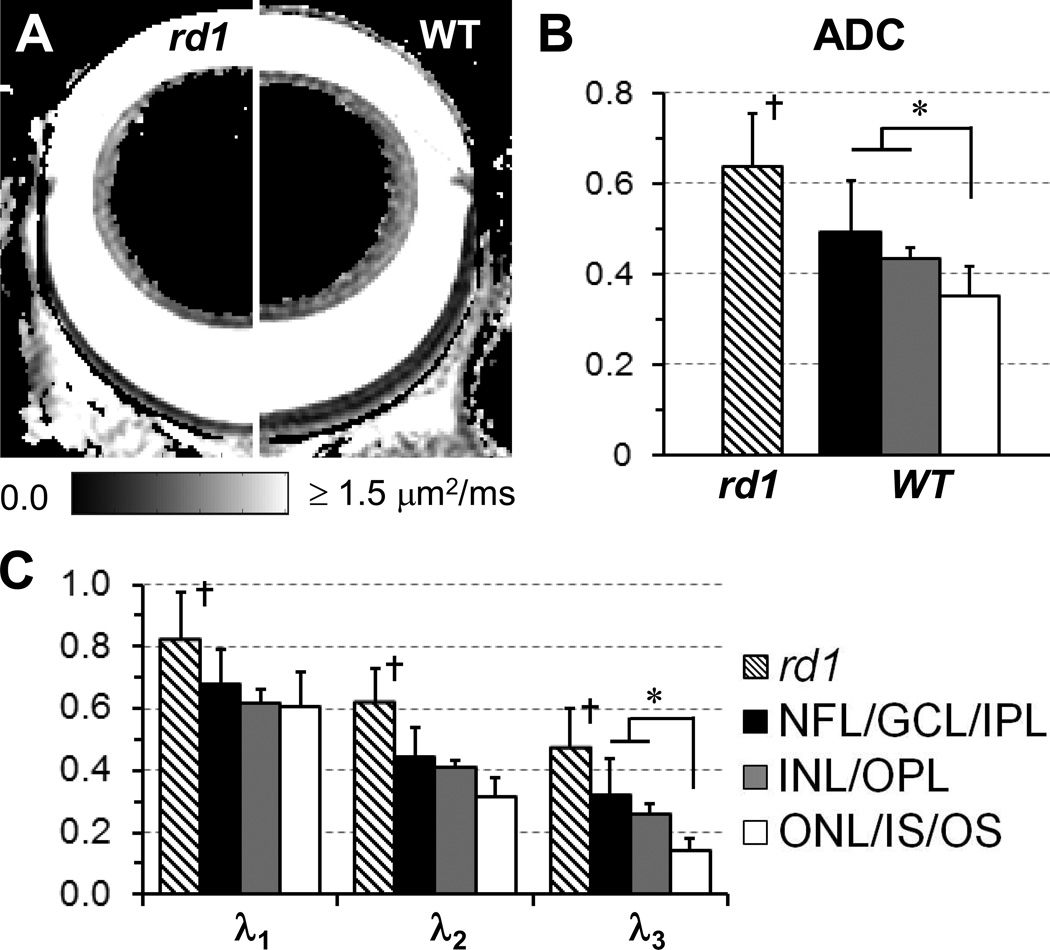
Figure 4 shows λ1–3 and ADC (i.e., the mean of λ1–3) in MR-detected retina layers of WT and rd1 mice. In WT mice, comparable λ1 was observed among all layers. However, λ3 of MR-detected outer layer was ~50% lower than that of MR-detected inner and middle layers. Consequently, the lowest ADC was observed in the MR-detected outer layer. In rd1 mice, λ1–3 and ADC of the single MR-detected retina layer were all higher than those of corresponding MR-detected inner layer in WT mice.
Figure 4.
DTI determined ADC maps of the eyes of an rd1 (left side) and a WT (right side) mice (A). ADC (B) and λ1–3 (C) of the MR-detected retina layers in rd1 and WT mice were quantified. The unit of ADC and λ1–3 is µm2/ms. *, p < 0.05; †, p <0.05 compared to MR-detected middle and outer layers of WT mice.
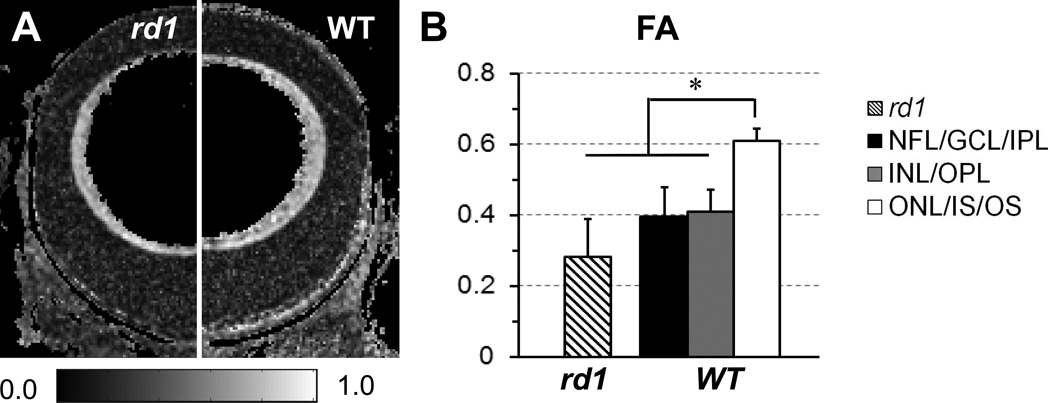
The FA of each MR-detected retina layer was quantified to evaluated diffusion anisotropy (Fig. 5). In WT mice, the FA of MR-detected outer layer was ~50% higher than that of MR-detected inner and middle layers. In rd1 mice, the FA of MR-detected retina layer was ~30% lower than that of corresponding MR-detected inner layer in WT mice.
Figure 5.
DTI determined FA maps of the eyes of an rd1 (left side) and a WT (right side) mice (A). FA of the MR-detected retina layers in rd1 and WT mice were quantified (B). *, p < 0.05.
DISCUSSION
DTI measured retinal cell alignment of the MR-detected outer layer in WT mice agreed with histology revealed alignment of photoreceptor cells in ONL/IS/OS. Both the MR-detected inner layer in WT mice and the remaining layer in rd1 mice lacked cells aligning perpendicular to the retinal surface reflecting the absence of photoreceptor cells. DTI measured cell alignment in the MR-detected middle layer of WT mice appeared to be not well-organized that might due to the partial volume effect from the adjacent MR-detected inner and outer layers. Overall, the DTI detected cell alignment supported the assignment of MR-detected outer layer to ONL/IS/OS despite the difficulty to accurately measure MR-detected layer thickness at the employed image resolution (47 × 47 µm2).
Layer-specific ADC and FA were observed in the mouse retina. In WT mice, the lowest ADC was observed in the MR-detected outer layer because it exhibited lower λ3 (p < 0.05h) than the other two layers. The MR-detected outer layer also exhibited the highest FA (p < 0.05 compared to the other two layers) reflecting highly anisotropic diffusion of water molecule. In rd1 mice, the remaining MR-detected layer exhibited higher ADC but lower FA than the corresponding MR-detected inner layer of WT mice (p < 0.05 for all comparisons), which might be attributed to photoreceptor cell degeneration induced retinal remodeling including retinal vascular leakage and retinal edema (18,19).
This study has several limitations. First, in vivo retinal DTI requires prolonged acquisition time that is susceptible to motional artifacts. Thus, the minimization of imaging time is crucial in retinal MRI (20). The current finding showed that photoreceptor cells in the central retina, i.e., adjacent to the optic nerve head, exhibits a well-organized spatial distribution that is parallel to the optic nerve axis. Thus, it is likely that a full tensor analysis is not necessary when central retina pathology is of interest. In our previous study, three diffusion sensitizing gradients were applied in the directions parallel to (‖), in-plane perpendicular to (⊥), and out-of-plane perpendicular to (⊙) the optic nerve axis (13). At the central retina, the determined ADC‖ and ADC (mean of ADC‖, ⊥, and ⊙) in ONL/IS/OS were comparable to the DTI measured λ1 and ADC, respectively (p > 0.05 for all comparisons using unpaired t-test). The results suggested DWI measured ADC might be sufficient to investigate central retinal pathology that can reduce imaging time by ~50%. Second, the single MR-detected retina layer in rd1 mice was tentatively assigned to NFL/GCL/IPL based on the assumption that the bright INL/OPL has merged with the bright choroid after photoreceptor cell degeneration. This assignment did not take into account that the progressive remodeling of the residual rd1 retina (e.g., retinal vascular leakage, neuron cell degeneration, and choroidal capillary loss) (18,19,21) may alter the MR signal contrast among retinal layers. However, this limitation does not affect the current result where photoreceptor cell layer exhibited distinct ADC, FA, and cell alignment as compared to those of other retinal cell layers in both WT and rd1 mice as adequately revealed by the current experimental setting. Finally, the Gibbs ring artifact at the posterior vitreous, i.e., pseudo signal intensity layers due to abrupt signal change, was apparent on the T1-weighted image (Fig. 1C). However, this artifact was not obvious on either non-diffusion weighted or diffusion weighted images (Fig. 1 A&B). It did not affect the identification of MR-detected retina layers on these images and does not substantially change the derived retinal ADC and FA.
The reliability of DTI measurement was demonstrated by the determined cell organization in the lens cortex. The lens cortex comprises of elongated lens fiber cells extending from anterior to posterior suture (22). Individual lens fiber cell was further organized into concentric layers aligned parallel to the lens surface. Agreeing with the anatomical organizations of lens fiber cells, DTI results showed the lens fiber cells aligned in the direction parallel to the lens surface extending from the anterior to posterior suture. This in vivo DTI measured lens fiber cell organization was also in agreement with that measured by in vitro DTI on fixed lens tissues (23,24).
In conclusion, DTI were performed to assess retinal water diffusion in WT and rd1 mice in vivo. The DTI revealed cell alignment supported the assignment of MR-detected outer layer to ONL/IS/OS in WT mice. The observed layer-specific ADC and FA in WT and rd1 mice suggested DTI could provide a non-invasive measure of photoreceptor cell degeneration in the mouse retina. Further incorporation of the noninvasively measured ADC and FA with thickness (e.g., OCT) and visual function (e.g., electroretinography) measurements will provide novel opportunity to investigate the pathomechanism of retinal diseases.
ACKNOWLEDGEMENTS
The work of this study is supported by NIH R21 EY018914 and Washington University Diabetes Research and Training Center Pilot and Feasibility Grant 5 P60 DK20579.
LIST OF ABBREVIATIONS
- ADC
apparent diffusion coefficient
- ANOVA
analysis of variance
- DTI
diffusion tensor MRI
- FA
fractional diffusion anisotropy
- H&E
hematoxylin and eosin
- rd1
retinal degeneration 1
- SD
standard deviation
- λ1,2,3
the primary, secondary, and tertiary eigenvalues of diffusion tensor
Retina layers (starting from the vitreous side)
- NFL
nerve fiber layer
- GCL
ganglion cell layer
- IPL
inner plexiform layer
- INL
inner nuclear layer
- OPL
outer plexiform layer
- ONL
outer nuclear layer
- IS
photoreceptor cell inner segments
- OS
photoreceptor cell outer segments
REFERENCES
- 1.Alm A, Ehinger B. Retina. In: Kaufman P, Alm A, editors. Adler's Physiology of the Eye. 10th ed. St. Louis, MO: Mosby, Inc; 2002. pp. 319–438. [Google Scholar]
- 2.Zysk AM, Nguyen FT, Oldenburg AL, Marks DL, Boppart SA. Optical coherence tomography: a review of clinical development from bench to bedside. J Biomed Opt. 2007;12(5):051403. doi: 10.1117/1.2793736. [DOI] [PubMed] [Google Scholar]
- 3.Kioumehr F, Dadsetan MR, Rooholamini SA, Au A. Central nervous system tuberculosis: MRI. Neuroradiology. 1994;36(2):93–96. doi: 10.1007/BF00588067. [DOI] [PubMed] [Google Scholar]
- 4.Keir SL, Wardlaw JM. Systematic review of diffusion and perfusion imaging in acute ischemic stroke. Stroke. 2000;31(11):2723–2731. doi: 10.1161/01.str.31.11.2723. [DOI] [PubMed] [Google Scholar]
- 5.Bakshi R, Thompson AJ, Rocca MA, Pelletier D, Dousset V, Barkhof F, Inglese M, Guttmann CR, Horsfield MA, Filippi M. MRI in multiple sclerosis: current status and future prospects. Lancet Neurol. 2008;7(7):615–625. doi: 10.1016/S1474-4422(08)70137-6. [DOI] [PMC free article] [PubMed] [Google Scholar]
- 6.Logothetis NK. What we can do and what we cannot do with fMRI. Nature. 2008;453(7197):869–878. doi: 10.1038/nature06976. [DOI] [PubMed] [Google Scholar]
- 7.Horsfield MA, Jones DK. Applications of diffusion-weighted and diffusion tensor MRI to white matter diseases - a review. NMR Biomed. 2002;15(7–8):570–577. doi: 10.1002/nbm.787. [DOI] [PubMed] [Google Scholar]
- 8.Aoki I, Naruse S, Tanaka C. Manganese-enhanced magnetic resonance imaging (MEMRI) of brain activity and applications to early detection of brain ischemia. NMR Biomed. 2004;17(8):569–580. doi: 10.1002/nbm.941. [DOI] [PubMed] [Google Scholar]
- 9.Berkowitz BA. MRI of retinal and optic nerve physiology. NMR Biomed. 2008;21(9):927. doi: 10.1002/nbm.1275. [DOI] [PubMed] [Google Scholar]
- 10.Duong TQ, Pardue MT, Thule PM, Olson DE, Cheng H, Nair G, Li Y, Kim M, Zhang X, Shen Q. Layer-specific anatomical, physiological and functional MRI of the retina. NMR Biomed. 2008;21(9):978–996. doi: 10.1002/nbm.1311. [DOI] [PMC free article] [PubMed] [Google Scholar]
- 11.Berkowitz BA, Roberts R, Penn JS, Gradianu M. High-resolution manganese-enhanced MRI of experimental retinopathy of prematurity. Invest Ophthalmol Vis Sci. 2007;48(10):4733–4740. doi: 10.1167/iovs.06-1516. [DOI] [PubMed] [Google Scholar]
- 12.Cheng H, Nair G, Walker TA, Kim MK, Pardue MT, Thule PM, Olson DE, Duong TQ. Structural and functional MRI reveals multiple retinal layers. Proc Natl Acad Sci U S A. 2006;103(46):17525–17530. doi: 10.1073/pnas.0605790103. [DOI] [PMC free article] [PubMed] [Google Scholar]
- 13.Chen J, Wang Q, Zhang H, Yang X, Wang J, Berkowitz BA, Wickline SA, Song SK. In vivo quantification of T1, T2, and apparent diffusion coefficient in the mouse retina at 11.74T. Magn Reson Med. 2008;59(4):731–738. doi: 10.1002/mrm.21570. [DOI] [PubMed] [Google Scholar]
- 14.Shen Q, Cheng H, Pardue MT, Chang TF, Nair G, Vo VT, Shonat RD, Duong TQ. Magnetic resonance imaging of tissue and vascular layers in the cat retina. J Magn Reson Imaging. 2006;23(4):465–472. doi: 10.1002/jmri.20549. [DOI] [PMC free article] [PubMed] [Google Scholar]
- 15.Basser PJ, Jones DK. Diffusion-tensor MRI: theory, experimental design and data analysis - a technical review. NMR Biomed. 2002;15(7–8):456–467. doi: 10.1002/nbm.783. [DOI] [PubMed] [Google Scholar]
- 16.Chen J, Liu W, Zhang H, Lacy L, Yang X, Song SK, Wickline SA, Yu X. Regional ventricular wall thickening reflects changes in cardiac fiber and sheet structure during contraction: quantification with diffusion tensor MRI. Am J Physiol Heart Circ Physiol. 2005;289(5):H1898–H1907. doi: 10.1152/ajpheart.00041.2005. [DOI] [PubMed] [Google Scholar]
- 17.Mori S, van Zijl PC. Fiber tracking: principles and strategies - a technical review. NMR Biomed. 2002;15(7–8):468–480. doi: 10.1002/nbm.781. [DOI] [PubMed] [Google Scholar]
- 18.Jones BW, Marc RE. Retinal remodeling during retinal degeneration. Exp Eye Res. 2005;81(2):123–137. doi: 10.1016/j.exer.2005.03.006. [DOI] [PubMed] [Google Scholar]
- 19.Marc RE, Jones BW, Watt CB, Strettoi E. Neural remodeling in retinal degeneration. Prog Retin Eye Res. 2003;22(5):607–655. doi: 10.1016/s1350-9462(03)00039-9. [DOI] [PubMed] [Google Scholar]
- 20.Berkowitz BA, McDonald C, Ito Y, Tofts PS, Latif Z, Gross J. Measuring the human retinal oxygenation response to a hyperoxic challenge using MRI: eliminating blinking artifacts and demonstrating proof of concept. Magn Reson Med. 2001;46(2):412–416. doi: 10.1002/mrm.1206. [DOI] [PubMed] [Google Scholar]
- 21.Neuhardt T, May CA, Wilsch C, Eichhorn M, Lutjen-Drecoll E. Morphological changes of retinal pigment epithelium and choroid in rd-mice. Exp Eye Res. 1999;68(1):75–83. doi: 10.1006/exer.1998.0589. [DOI] [PubMed] [Google Scholar]
- 22.Beebe D. The Lens. In: Kaufman P, Alm A, editors. Adler's Physiology of the Eye. St. Louis, MO: Mosby; 2002. pp. 747–784. [Google Scholar]
- 23.Moffat BA, Pope JM. Anisotropic water transport in the human eye lens studied by diffusion tensor NMR micro-imaging. Exp Eye Res. 2002;74(6):677–687. doi: 10.1006/exer.2001.1164. [DOI] [PubMed] [Google Scholar]
- 24.Vaghefi E, Pontre B, Donaldson PJ, Hunter PJ, Jacobs MD. Visualization of transverse diffusion paths across fiber cells of the ocular lens by small animal MRI. Physiol Mesa. 2009;30(10):1061–1073. doi: 10.1088/0967-3334/30/10/007. [DOI] [PubMed] [Google Scholar]


