

Abstract
Tumors evade immune destruction by actively inducing immune tolerance through the recruitment of CD4+CD25+Foxp3+ regulatory T cells (Treg). We have previously described increased prevalence of these cells in pancreatic adenocarcinoma, but it remains unclear what mechanisms are involved in recruiting Treg into the tumor microenvironment. Here, we postulated that chemokines might direct Treg homing to tumor. We show, in both human pancreatic adenocarcinoma and a murine pancreatic tumor model (Pan02), that tumor cells produce increased levels of ligands for the CCR5 chemokine receptor, and, reciprocally, that CD4+ Foxp3+ Treg, compared with CD4+ Foxp3− effector T cells, preferentially express CCR5. When CCR5/CCL5 signaling is disrupted, either by reducing CCL5 production by tumor cells or by systemic administration of a CCR5 inhibitor (TAK-779), Treg migration to tumors is reduced and tumors are smaller than in control mice. Thus, this study demonstrates the importance of Treg in immune evasion by tumors, how blockade of Treg migration may inhibit tumor growth, and, specifically in pancreatic adenocarcinoma, the role of CCR5 in the homing of tumor-associated Treg. Selective targeting of CCR5/CCL5 signaling may represent a novel immunomodulatory strategy for the treatment of cancer.
Keywords: rodent, T-cells, chemokines, chemotaxis, tumor immunity
INTRODUCTION
Regulatory T cells (Treg) play an important role in the maintenance of peripheral tolerance and the prevention of autoimmunity 1–3. They are identified phenotypically as expressing the IL-2Rα chain (CD25) and the Foxp3 transcription factor 4. Treg are engaged in suppressing immune responses not just toward self, but to non-self (microbes and transplanted allografts) 5,6, and quasi-self (autologous tumor cells) 7,8.
Evidence supporting the role of Treg in tumor progression stems from human and murine studies. First, increased Treg prevalence has been demonstrated to be a prognostic factor in various malignancies, including pancreatic adenocarcinoma 9–12. Recruitment of Treg occurs early, as demonstrated by their presence in pre-malignant lesions 11,13,14, and Treg prevalence increases with tumor progression 11,13,15–17. Finally, we and other groups have shown that depletion of Treg in murine cancer models slows tumor growth and prolongs survival 18–22, even in the absence of immunization or non-specific immune stimulation.
However, two crucial obstacles stand in the path of translating these findings into useful clinical therapies. The first is the lack of a unique cell surface marker for Treg. Thus far, systemic Treg have been depleted by targeting CD25 21–24, glucocorticoid-induced tumor necrosis factor receptor family-related gene (GITR) 25–28 or cytotoxic lymphocyte-associated antigen 4 (CTLA-4) 26,29, which also bind and deplete effector cells. Similarly, although cyclophosphamide may have some selective toxicity to Treg, as a chemotherapeutic agent, it also affects other proliferating cells, including effector immune cells 30–33. The second obstacle is our inability to distinguish between Treg required for immune homeostasis (natural Treg) from those involved in pathologic processes such as tumor immune evasion.
Recently, it has been demonstrated that preferential accumulation of Treg over effector T cells at sites of disease may be driven by differences in homing signals 34. Studies of Treg in models of infection/inflammation 35–38 as well as malignancy 9,39, have demonstrated that such preferential migration may be facilitated by specific chemokines and their receptors. In a variety of disease models, the chemokine receptors thus far identified as allowing Treg to migrate to sites of disease more efficiently than effector cells include CCR4 9,40, CCR5 37,38,41, CCR6 42,43, CCR7 44 and CCR8 40. Since the Treg recruited to these sites express distinct chemokine receptors, we speculated that this homing phenotype not only identifies disease-associated Treg but might permit selective depletion of this subset, sparing non-pathogenic Treg.
We have previously described increased prevalence of Treg in patients with pancreatic adenocarcinoma 45 and the anti-tumor effect of non-specific Treg depletion 20,22. In this study, we hypothesized that CCR5-dependent chemotaxis is important for Treg migration into pancreatic adenocarcinoma, and that disruption of this signaling would result in decreased migration of Treg into the tumor, thereby slowing tumor growth. First, we show that in human and murine pancreatic adenocarcinoma, Treg found within the tumor microenvironment express CCR5. Correspondingly, we demonstrate that CCR5 ligands, such as CCL5, are produced by the tumor cells themselves. We subsequently show in the murine model that reduced CCL5 expression by the tumor results in decreased Treg migration to the tumor, and slowed tumor growth. Finally, we demonstrate that similar results can be achieved by systemic administration of a small molecular inhibitor of CCR5. Collectively, this study suggests that Treg migration into the tumor microenvironment is mediated by the CCL5-CCR5 axis, and that blockade of this pathway may represent a novel immunomodulatory strategy for the treatment of cancer.
MATERIALS AND METHODS
Patients and normal donors
Peripheral blood and tumor specimens were obtained from patients undergoing curative resections for pancreatic adenocarcinoma. No patients had received chemotherapy prior to specimen collection. Samples of normal pancreas tissue were obtained from individuals undergoing organ donation. Blood samples were also obtained from normal healthy volunteers. All specimens were collected under research protocols approved by the Washington University School of Medicine Human Studies Committee.
Mice and tumor cell line
C57BL/6 mice and C57BL/6 Rag−/− mice were purchased from Jackson Laboraties (Bar Harbor, ME). Foxp3gfp reporter knock-in mice were kindly provided by A. Rudensky (U. Washington, Seattle, WA). Animals were housed in a specific pathogen-free animal facility at Washington University and were used according to protocols approved by the Institutional Animal Care and Use Committee. The murine pancreatic adenocarcinoma cell line Pan02 is a non-metastatic tumor line, syngeneic to C57BL/6 46, and was obtained from the DCT Tumor Repository (NCI-Frederick Cancer Research and Development Center, Bethesda, MD).
Human peripheral blood mononuclear cell (PBMC) isolation
Heparinized blood was centrifuged on Ficoll (Histopaque™, Sigma, St. Louis, MO) to isolate PBMC.
Immunofluorescence labeling and flow cytometry
Monoclonal antibodies were purchased from eBioscience (San Diego, CA), BioLegend (San Diego, CA) and BD Biosciences (San Jose, CA). Intracellular Foxp3 staining was performed according to the manufacturer’s intracellular staining protocol (eBioscience). All samples were treated with Fc-block. Corresponding isotope controls yielded no significant staining.
Immunohistochemistry
Paraffin-embedded tissue sections of archival human pancreatic ductal adenocarcinoma were used for immunohistochemistry following standard procedures. Confocal images were scanned at 400X with an axiovert 100M microscope equipped with a LSM 510 confocal system and software (Zeiss). For co-localization of Foxp3, CD4, and CCR5, rat anti-human Foxp3 (eBioscience, 10ug/ml), rabbit anti-human CD4 (Labvision, Fremont, CA, 1:20), and polyclonal goat anti-human CCR5 (Abcam, Cambridge, MA, 1:300) were used, visualized respectively with Alexafluor 488 Donkey anti-rat, Alexafluor 555 Donkey anti-goat, and Alexafluor 647 donkey anti-rabbit secondary antibodies diluted 1:200 (Invitrogen, Carlsbad, CA). For CCL5 and EpCAM co-localization, tissue sections were stained with mouse anti-human CCL5 diluted 10μg/ml and rabbit anti-human EpCAM diluted 1:100 (Abcam), followed by secondary antibodies.
Real-time PCR
Real-time PCR for chemokine ligands and the endogenous control hypoxanthine-guanine phosphoribosyl-transferase (HPRT) were performed on a 9600 thermal cycler from Applied Biosystems and analysis of the data was performed using the Sequence Detection System 5700 software. TaqMan® Primer and non-fluorescent quencher probes for genes of interest were purchased from Applied Biosystems’ Assay On Demand line of primers and probes. TaqMan® Universal PCR Master Mix was used in combination with the Applied Biosystems primers and probes per the manufacturer’s instructions. The reaction cycles were as follows: (Stage 1) 50°C for 2 minutes (Stage 2) 95°C for 10 minutes (Stage 3) 95°C for 15 seconds then 60°C for 1 minute; stage 3 was repeated for 40 cycles. Relative quantitation of RNA expression was determined from the real-time data by using the 2−ΔΔCT method.
Mouse model of pancreas cancer
Six-week-old C57BL/6 mice were injected subcutaneously on the left thigh with 0.25 × 10⁶ Pan02 cells, as previously described47. At 4–5 weeks post-inoculation, the mice were sacrificed; spleens, lymph nodes and tumors were resected, and processed into single cell suspensions. Tumor tissue was minced into 1 mm size pieces, then digested in a buffer containing 1mg/ml collagenase, 2.5 U/ml hyaluronidase and 0.1mg/ml DNase for 30 minutes. The cell suspension was then separated from tissue debris by filtration through a 40 μm cell strainer and centrifugation on Histopaque®-1083 (Sigma). In some experiments, CD4+ cells were purified using CD4 magnetic particles (IMag™, BD Biosciences). In other instances, CD4+ CD25+ cells were purified using magnetic bead separation (Miltenyi Biotech, Auburn, CA), according to the manufacturers’ instructions. These cells were cultured overnight in medium containing 0.4 μg/ml anti-CD3 antibody (clone 145-2C11, eBioscience), for subsequent use in suppression assays.
In vitro suppression assays
CFSE was purchased from Invitrogen (Carlsbad, CA). 50,000 CFSE-labeled CD4+ CD25− thy1.1+ T cells were co-cultured in 96-well plates with 200,000 irradiated thy1.2+ splenocytes, 0.1 μg/ml anti-CD3 antibody, with or without 50,000 CD4+ CD25+ thy1.2+ cells for 72 hours. For some experiments, the suppressor cells were sorted CD4+ Foxp3gfp+ thy1.2+ cells. Cells were subsequently harvested and the CD4+ thy1.1+ cell fraction was analyzed by flow cytometry for CFSE dilution.
CCL5 shRNA cloning, lentivirus generation and transduction
The lentiviral vectors pSicoR-puro and pSicoR-GFP, as well as the methods of shRNA cloning and lentiviral generation, were used as described by Ventura et al48. Two CCL5 (NM_013653) RNAi targets were used, with two control RNAi targets: SCR (scrambled) and GFP. The shRNA duplex oligonucleotides were synthesized by Invitrogen, annealed and cloned into HpaI-XhoI sites of pSicoR-puro vector and sequence verified. Lentiviral transduction efficiency was monitored using pSicoR-GFP vector under a Leica fluorescence microscope. After 48 hours of transduction, Pan02 cells were selected in 2ug/mL puromycin to enrich pure transduced population. CCL5 mRNA ablation was analyzed using quantitative RT-PCR; reduction in CCL5 protein production was analyzed by ELISA.
shRNA targets
SCR: TTCTCCGAACGTGTCACGT
GFP: GCTGACCCTGAAGTTCATC
CCL5:214-GTGTGTGCCAACCCAGAGA (human and mouse)
CCL5:258-CTATTTGGAGATGAGCTAG
RT-PCR primer
mCCL5-RTPCRF: CCCTCACCATCATCCTCACT
mCCL5-RTPCRR: TCCTTCGAGTGACAAACACG
mGAPDH-RTPCRF: CCTTCATTGACCTCAACTAC
mGAPDH-RTPCRR: CTCCTGGAAGATGGTGATGG
ELISA
CCL5 was measured by using a commercially available ELISA kit (R&D Systems, Minneapolis MN), per the manufacturer’s instructions.
Reagents for Treg depletion
TAK-779 (N,N-dimethyl-N-[4-[[[2-(4-methylphenyl)-6,7-dihydro-5H-benzocyclohepten-8-yl]carbonyl]amino]benzyl]-tetrahydro-2H-pyran-4-aminium chloride) was obtained through the NIH AIDS Research and Reference Reagent Program, Division of AIDS, NIAID, NIH.
RESULTS
Expression of CCR5 on regulatory T cells of patients with pancreatic adenocarcinoma
Since CCR5 has recently been identified as a receptor involved in migration of regulatory T cells to sites of infection, inflammation and tumor, we examined its expression on Treg in patients with pancreatic adenocarcinoma. Peripheral blood lymphocytes from these patients (n = 9) and healthy volunteers (n = 9) were isolated and stained for CD4, CCR5 and Foxp3 (Figure 1 A, B). More CD4+Foxp3+ Treg from patients expressed CCR5 compared to Treg from healthy volunteers, whereas CD4+Foxp3− T cells from both groups of individuals had low levels of CCR5 expression. The overall ratio of CCR5+ Treg to CCR5+ Teff was not significantly different between cancer patients and healthy volunteers (2.6 to 2.4, respectively), but this may have been due to small sample size (n = 9 for each group). To evaluate expression of CCR5 on Treg within the tumor microenvironment, six surgically resected specimens of human pancreatic adenocarcinoma were stained for CCR5 and Foxp3 (see Figure 1 C for representative image). In all cases, cells staining positive for intranuclear Foxp3 also stained positive for cell surface CCR5, indicating that the Treg in the tumor microenvironment expressed CCR5.
Figure 1. Increased expression of CCR5 by CD4+Foxp3+ regulatory T cells from patients with pancreatic adenocarcinoma.

(A) Peripheral blood mononuclear cells (PBMC) from patients with pancreatic adenocarcinoma (Cancer, n=9, unfilled histogram) and healthy volunteers (Normal, n=9, grey histogram) were isolated as described in Materials and Methods, then stained for CD4, CCR5 and Foxp3. Representative plots of CCR5 expression for CD4+Foxp3+ (top right) and CD4+Foxp3− (bottom right). (B) The bar graph shows percentage of CD4+Foxp3+ cells (Treg) and CD4+Foxp3− cells (Teff) staining positive for CCR5. Results represent mean ± SEM. * p<0.005, ** p<0.001, NS non-significant. (C) Regulatory T cells in the tumor microenvironment express CCR5. Shown is a representative image from sections of surgically resected, formalin-fixed, human pancreatic adenocarcinoma (n=6 patients) co-stained for Foxp3 (green) and CCR5 (red).
Human pancreatic adenocarcinoma cells produce CCR5 ligands
Next, we examined the gene expression of CCR5 ligands in fresh frozen specimens of human pancreatic adenocarcinoma. Chemokine gene arrays revealed increased expression of the CCR5 ligands CCL3, CCL4 and CCL5 (data not shown). This was confirmed by quantitative real-time PCR, in which expression of CCL3, CCL4, and CCL5 in tumor tissue (n=13) was 7-, 8-, and 15-fold greater, respectively, than in normal pancreatic tissue (n = 4, Figure 2A). In all thirteen of the tumor tissues analyzed, CCL5 expression was elevated above normal pancreas controls. In contrast, there was no significant difference in gene expression of CCL1, CCL27 and CCL28 between normal pancreatic tissue and tumor tissue (data not shown).
Figure 2. Production of CCR5 ligands is increased in human pancreatic adenocarcinoma.

(A) RNA was extracted from fresh frozen specimens of histologically-verified pancreatic adenocarcinoma (n=13) and normal pancreas (n=4), and rt-PCR performed. Gene expression (mean ± SEM, relative to HPRT) of CCL3, CCL4 and CCL5 in malignant tissue was elevated 7-, 9- and 15-fold compared to normal pancreas. * P < 0.05, ** P < 0.001. (B) Shown is a representative image from sections of surgically resected human pancreatic adenocarcinoma co-stained for the CCR5 ligand, CCL5 (green), and the tumor cell surface marker, EpCAM (red). Areas of co-localization appear yellow. Of the 17 cases examined, in 8 specimens there was co-localization of EpCAM and CCL5, indicating that tumor cells were producing CCL5.
However, pancreatic adenocarcinoma typically manifests a dense desmoplastic inflammatory response, and therefore, to definitively establish that these chemokines were indeed being produced by the tumor cells themselves, immunohistochemistry was performed. Seventeen surgically resected specimens of human pancreatic adenocarcinoma were stained for CCL5 and EpCAM (Figure 2 B). In 8 (47%) cases, there was co-localization of EpCAM and CCL5, indicating that tumor cells were producing CCL5. Of note, abundant Treg were still observed in those tumors not staining positive for CCL5. Additionally, CCL5 staining was not detected in cells other than tumor cells.
Prevalence of Treg in the tumor microenvironment of a mouse model of pancreatic adenocarcinoma
Having established the presence of an intact CCR5 signaling axis in human pancreatic adenocarcinoma, we then sought to evaluate the effect of disrupting this axis in our mouse model. We have previously shown that the prevalence of Treg in the spleen and TDLNs in our murine model of pancreas cancer is increased 47. At the same time, there is accumulation of large numbers of Treg within the tumor microenvironment. At 4 weeks after tumor inoculation, the average prevalence of Treg (% CD4+Foxp3+ expressed as a percentage of total CD4+ lymphocytes) in the tumor was 42% compared with 17%, 18%, and 20% in the TDLN, NLN and spleen respectively (Figure 3 A). Importantly, Treg present within the tumor display immunosuppressive capabilities (Figure 3 B), which are equivalent to those Treg within tumor-draining lymph nodes (TDLN, ipsilateral inguinal lymph node) and spleen (Figure 3 C).
Figure 3. High levels of functional regulatory T cells infiltrate murine pancreatic adenocarcinoma.

(A) Prevalence of Treg in various compartments (tumor, tumor-draining lymph nodes, non-draining lymph nodes and spleen) in the tumor-bearing mouse at 4 weeks post tumor implantation. Compared to other compartments, there were higher numbers of Treg found in the tumor. Histogram shows percentage of CD4+ cells that are Foxp3+. Results represent mean ± SEM, * P < 0.005, from 5 independent experiments, each comprising 2–4 mice. (B) Tumor-derived Foxp3+ cells are suppressive in vivo. To examine the suppressive capacity of tumor-infiltrating Treg in Foxp3gfp mice, CD4+ cells were isolated from tumors 4–5 weeks after inoculation with Pan02, then sorted to collect the Foxp3+ Treg subset. CFSE-labeled thy1.1+ CD4+ CD25− T effector cells were subsequently co-cultured for 72 hours either alone (filled histogram) or with the sorted thy1.2+CD4+Foxp3+ cells in a 1:1 ratio (open histogram). For flow cytometric analysis, CFSE dilution was evaluated in thy1.1+ cells. Figure is representative of 2 independent experiments, each comprising 4–5 mice. (C) Tumor-derived CD4+CD25+ cells have equivalent suppressive ability to CD4+CD25+ cells from lymph nodes and spleen. To examine the suppressive capacity of tumor-infiltrating Treg, CD4+CD25+ cells were isolated from the spleen, tumor-draining lymph nodes and tumor of C57BL/6 (thy1.2+) mice 5 weeks after inoculation with Pan02. CFSE-labeled thy1.1+CD4+ CD25− T effector cells were subsequently co-cultured for 72 hours either alone (filled histograms) or with CD4+CD25+ cells (at a 1:1 ratio) derived from tumor; tumor-draining lymph nodes; or spleen (open histograms). Figure is representative of 2 independent experiments, each comprising 3 mice.
Regulatory T cells in the tumor microenvironment of mouse pancreatic adenocarcinoma express CCR5
Having established that there are large numbers of functional Treg within the tumor microenvironment, we sought to identify differences in CCR5 expression between these tumor-infiltrating Treg and Treg in other organ compartments. Therefore, we isolated lymphocytes from tumor, TDLN, non-draining lymph nodes (contralateral inguinal lymph node) and spleen from tumor-bearing mice, and co-stained for CD4, Foxp3 and CCR5. Flow cytometry revealed that 80±4% (63–95%) [mean±SEM (range)] of Treg in the tumor were CCR5 positive, compared with ≤15% of Treg in the other compartments (P<0.0001 for tumor-infiltrating Treg compared to Treg from other compartments, Figure 4 A–C). Specifically, the CCR5 expression by Treg in TDLN, NLN and spleen were 12±3% (3–25%), 14±4% (3–24%) and 15±2% (3–23%), respectively. Furthermore, CCL5 appears to upregulate Treg over non-Treg in the tumor microenvironment - intratumoral CD4+Foxp3− T cells have a lower prevalence of CCR5 positivity by FACS when compared to CD4+Foxp3+ Treg (32±5% versus 80±4%, p<0.0001). However, there is some increased CCR5 expression by intra-tumoral CD4+Foxp3− T cells compared to other compartments (P<0.01), where the baseline frequency of CCR5 expression is approximately 10% (Figure 4C). This suggests that CCL5 preferentially (but not selectively) upregulates CCR5 expression on Treg compared to non-Treg.
Figure 4. Tumor-infiltrating Treg express elevated levels of CCR5.
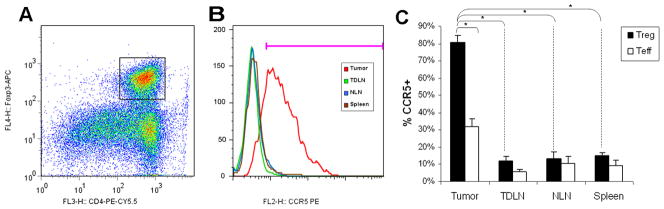
Wild-type Pan02 cells were implanted into C57BL/6 mice. Four weeks after tumor implantation, CD4+ lymphocytes were isolated from different compartments (spleen, TDLN, NLN, tumor). For flow cytometric analysis, lymphocytes were gated on CD4 and Foxp3 (A), then gated on CCR5 (B). Only those CD4+Foxp3+ cells isolated from tumor had high levels of CCR5 expression. (C) Bar graph shows percentage of CD4+Foxp3+ (Treg) and CD4+Foxp3− (Teff) cells that are CCR5+. 80±4% of intra-tumoral Treg are CCR5+ compared with 32±5% of intra-tumoral CD4+Foxp3− cells and <15% of Treg within other compartments, both P<0.0001. In contrast to CD4+Foxp3+ cells, CD4+Foxp3−cells within the tumor remain predominantly CCR5−. The baseline expression of CCR5 by CD4+Foxp3− cells other compartments is ≤10%. Results represent the mean ± SEM, * P < 0.0001, from six independent experiments of 3–5 mice each.
Pan02 tumors produce CCL5
Given the presence of CCR5+ Treg within murine pancreatic tumors, we then sought to confirm the production of CCR5 ligands by the tumor itself. We therefore performed quantitative real-time PCR on resected murine Pan02 tumors and normal murine pancreas. Similar to human pancreatic cancers, the mouse Pan02 tumors had ≥4-fold increased gene expression in the tumor of CCL3, CCL4, and CCL5, compared to pancreata resected from the same mice. Production and secretion of CCL5 by Pan02 cells cultured in vitro was subsequently confirmed by ELISA performed on tumor supernatant (data not shown).
Effect of CCL5 gene knockdown in Pan02
Next, we sought to disrupt CCR5-mediated chemotaxis by Treg. Expression of CCL5 by Pan02 was reduced by transducing the tumor cell line with a lentiviral vector producing shRNA to CCL5 (“CCL5lo Pan02”). Of the CCR5 ligands, CCL5 was chosen because in human pancreatic adenocarcinoma, it was the most highly upregulated (15-fold) compared to normal pancreas (see Figure 2 A). Lentiviral-mediated shRNA knockdown was successful in reducing CCL5 production by Pan02 by 89% (range: 78–99%, as measured by ELISA). When implanted into Rag−/− mice, CCL5lo Pan02 grew at the same rate as wild-type Pan02, suggesting no intrinsic differences in growth kinetics (as measured by in vivo tumor volume, Figure 5A). However, immunocompetent mice inoculated with CCL5lo Pan02 had significantly smaller tumors, compared to mice inoculated with wild-type Pan02 (Figure 5 B), whereas Pan02 transduced with lentivirus alone grew at a similar rate as wild type Pan02 (Figure 5C). Furthermore, when the mice were sacrificed and cells isolated from their tumors, an approximately 50% reduction in Treg was noted in mice inoculated with CCL5lo Pan02, compared to mice inoculated with wild-type Pan02 (Figure 5 D, E). Importantly, this reduction in Treg prevalence was only manifest in the tumor microenvironment and not in lymph nodes (either tumor-draining or non-draining) or spleen (Figure 5 E). The percentage of tumor-infiltrating Treg that were CCR5+ was not different between treatment and control groups (data not shown). These data suggest that disruption of CCR5 signaling in the tumor slows tumor growth through a Treg-mediated mechanism.
Figure 5. Knock-down of CCL5 production by tumors results in slowed tumor growth via a Treg-mediated mechanism.

(A) Tumor growth equivalence of CCL5-knockdown Pan02 compared to wild-type Pan02 when implanted in Rag−/− mice (n=6 in each group). (B) CCL5lo Pan02 or wild-type Pan02 were injected into C57BL/6 mice (5 mice in each group), and the resultant tumors were serially measured. P=0.001 for the separation of the tumor growth curves (repeated measures ANOVA). (C) Tumor growth equivalence of Pan02 tumor transduced with lentivirus alone compared to wild-type Pan02 when implanted in WT C57BL/6 mice (n=10 in each group). (D) Four weeks after tumor inoculation, mice injected with either CCL5lo Pan02 or wild-type Pan02 were sacrificed and cells were isolated from tumor, TDLN, NLN and spleen. Flow cytometry was performed (Representative Figure D), analyzing for % of CD4+ that were Foxp3+ Treg cells. (E) There was a significant reduction in Treg infiltrating CCL5lo tumors, compared to wild-type tumors. However, prevalence of Treg in other compartments (TDLN, NLN, and spleen) did not differ between CCL5lo and wild-type tumors. Data represents mean ± SEM for the prevalence of CD4+Foxp3+ Treg as a percentage of CD4+ cells, from 3 independent experiments, with 2–3 mice in each group. * P<0.01; NS = non-significant.
Inhibition of Pan02 tumor growth by systemic administration of CCR5 antagonist
We next wanted to assess whether CCR5 blockade administered systemically would have the same anti-tumor effect. TAK-779 is a non-peptide, synthetic CCR5 antagonist initially developed for the treatment of HIV infection 49. It appears to selectively inhibit CCR5 in both humans and mice 49–51. Therefore, two weeks after tumor injection, C57BL/6 mice were administered TAK-779. Compared to mice injected with vehicle control only, tumor growth in mice receiving TAK-779 was significantly reduced (Figure 6 A). This slowing of tumor growth was observable within 5 days of starting treatment, and persisted for approximately one week after completion of therapy. Thereafter, the tumors appeared to grow at a similar rate. When mice were sacrificed 4 days after initiation of treatment, those receiving TAK-779 had an approximately 33% decrease in Treg prevalence within the tumor, compared to mice receiving vehicle control (Figure 6 B). As expected, TAK-779 did not significantly alter the prevalence of Treg in other compartments, as these Treg were primarily CCR5-negative (data not shown). In mice receiving TAK-779 compared to mice treated with vehicle control, there was a small but statistically insignificant drop in CCR5 prevalence among intra-tumoral Treg (from 80% to 76%). When mice were sacrificed one week after completion of therapy, there was no difference in Treg prevalence within the tumor or in other compartments (data not shown), indicating rapid re-population of Treg into the tumor after cessation of TAK-779 treatment.
Figure 6. Systemic CCR5 blockade slows tumor growth via a Treg-mediated mechanism.

Wild-type Pan02 cells were implanted into C57BL/6 mice. Two weeks after tumor implantation, mice received either 150 μg TAK779 in 100 μl 5% mannitol subcutaneously in the flank daily for 7 days (n = 7 mice), or vehicle control (5% mannitol, n = 6 mice). Tumors were serially measured (A), with P=0.004 for the separation of the tumor growth curves (repeated measures ANOVA). Similar results were obtained in another independent experiment. (B) In separate experiments, C57BL/6 mice were divided into 2 groups 2 weeks after tumor implantation, and received one of the following treatments: 1. 150 μg TAK779 subcutaneously daily for 5 days; or 2.5% mannitol (vehicle control) subcutaneously for 5 days. On Day 20 after tumor implantation, mice were sacrificed, and cells isolated from tumor, TDLN, NLN and spleen. Compared to controls, there was ~33% decrease in the prevalence of CD4+Foxp3+ Treg within the tumor in mice treated with TAK, P<0.001. Figure is representative of 2 independent experiments, with 2 mice in each treatment arm; values displayed are the mean ± SEM for the prevalence of CD4+Foxp3+ Treg as a percentage of CD4+ cells.
DISCUSSION
Treg are crucial cellular mediators in immune evasion by tumors 7,52. They accumulate early in tumorigenesis, and increase in prevalence with disease progression 11,13. Preferential recruitment of Treg over other T cell subsets could be explained by their differential expression of chemokine receptors, as shown in other models 34,37,38,41.
In this study, we establish that Treg migration to pancreatic adenocarcinoma is driven, at least in part, by CCR5 chemotaxis, and further demonstrate that disruption of CCR5 chemotaxis might be a useful strategy for impairing recruitment of tumor-associated Treg. First, we show that there is an intact signaling axis between Treg and human pancreatic cancer cells. Similar findings in our implantable murine model validated its use in subsequent experiments. Two methods of disrupting CCR5 chemotaxis were then utilized. Initially, we reduced local (intra-tumoral) availability of the CCR5 ligand, CCL5. We then blocked CCR5 signaling systemically through the administration of a small molecule CCR5 antagonist. In both cases, Treg prevalence in the tumor microenvironment was reduced, and tumor growth slowed. Furthermore, prevalence of Treg within lymphoid and splenic compartments remained unchanged. Collectively, this study suggests that selective depletion of tumor-associated Treg is possible, and that specific homing phenotypes of Treg may be exploited to have an anti-tumor effect.
A number of studies have examined the importance of CCR5 for Treg chemotaxis. A consistent feature across these studies is that CCR5 expression is not required for the suppressive function of Treg 37,38. Yurchenko et al 38 demonstrated that Treg exhibited a greater chemotactic response to CCR5 ligands compared to effector T cells. In their in vivo model of Leishmania major infection, they demonstrated that CCR5−/− Treg had impaired migration to sites of L.major infection, and this phenomenon promoted clearance of the parasite. Wysocki et al 37 found that absence of CCR5 on Treg prevented their migration to target organs in their graft versus host disease model. Similar to our study, Cavassani and colleagues 35 found that CD4+ CD25+ regulatory T cells had increased CCR5 expression compared to CD4+ CD25− effector T cells. That it is chemokine production by the tumor cells themselves and not stromal cells in the tumor microenvironment that is important has been demonstrated in another study, in which no effect on growth of B16 melanaoma tumors was observed when implanted into CCL3−/− and C0CL5−/− mice 53. Using shRNA-mediated knockdown of CCL5 in our tumor line and demonstrating that Treg migration only to the tumor site is affected, we further emphasize the importance of CCR5 signaling as a local chemotactic phenomenon. Further, we demonstrate that these tumor-infiltrating Treg are functionally competent, retaining suppressive capabilities equivalent to Treg in lymphoid and splenic compartments.
Expression of chemokine receptors in the context of malignancy appears to vary according to the histopathologic type of cancer. Indeed, across tumor types, different cell types have been found to express chemokine receptors and ligands. For example, in their landmark study of Treg in ovarian cancer, Curiel et al 9 found that Treg expressed CCR4 and the tumor cells and tumor-associated macrophages released the CCR4 ligands, CCL17 and CCL22. In contrast, Karnoub et al 54 found that it was the breast cancer cells that were CCR5+, and stimulated mesenchymal stem cells to produce CCL5 in a contact-dependent manner. In colorectal cancer, infiltrating lymphocytes have been found to be CCR5+ 55, but in studies of prostate 56 and gastric 57 cancer, the tumor cells themselves were CCR5+. We document here the expression of CCR5 by lymphocytes, particularly Treg, but did not observe expression of this chemokine receptor by pancreatic adenocarcinoma cells themselves. A study of human pancreatic adenocarcinoma cell lines 58 tested for secretion of a panel of five chemokines (CCL2, CCL5, CCL22, CXCL8 and CXCL12), and found that CCL5 was the most frequently secreted (nine out of ten cell lines tested). This suggests that Treg chemotaxis may be a commonly conserved trait in this type of malignancy. Other cells, such as endothelial cells, monocytes, and fibroblasts are also capable of secreting CCL5, but in our study we did not find any evidence of CCL5 staining in EpCAM-negative cells, suggesting that CCL5 production by these other cell types is minimal relative to CCL5 production by tumor cells in the pancreatic cancer tumor environment. While not all patients in our study were found to have malignant cells producing CCL5, we believe it likely that other CCR5 ligands (CCL3, CCL4) would be present in tumor cells negative for CCL5, given that our gene expression studies found that all three CCR5 ligands were upregulated. Correlation of circulating levels of CCR5 ligands, especially CCL5, with prevalence of circulating CCR5+ Treg, as well as with cancer stage and prognosis, is a subject of ongoing investigation in our laboratory.
CCR5 antagonists, especially TAK-779, have been used to inhibit CCR5-dependent migration in a number of disease models. Menu et al 59 demonstrated that TAK-779 could inhibit the migration of CCR5+ 5TMM myeloma cells both in vitro and in vivo. In a collagen-induced arthritis model, Yang et al 60 blocked CCR5-dependent T cell migration using TAK-779. In another study by Uekusa et al 61, administration of IL-12 was found to induce CCR5 expression on CD4 and CD8 T cells and was associated with tumor regression. Co-administration of TAK-779 with IL-12 was found to inhibit T cell migration and have an anti-tumor effect. To our knowledge, the present study is the first to demonstrate inhibition of CCR5-dependent regulatory T cell migration to tumor using a systemic CCR5 antagonist, and concomitant delay of tumor growth. Although known primarily as a CCR5 antagonist, TAK-779 has also been shown to block CXCR3 in mice, but not in humans 49–51. Although CXCR3 expression has been described on Treg in some models of inflammation 62,63, we did not observe expression of CXCR3 on Treg in our tumor-bearing mice (data not shown). Another compound, Met-CCL5, is a CCR1 and CCR5 antagonist 64, which has been shown to inhibit the growth of murine breast carcinoma in vivo; however, in this tumor model, there is little CD4+ lymphocytic infiltration 65.
While it does appear that CCR5 blockade does have an anti-tumor effect via inhibition of Treg migration, it is also clear that the effect is modest – Treg chemotaxis into the tumor and tumor growth are both not completely blocked. This is likely due to redundancy at multiple levels. Firstly, our data obviously suggest Treg recruitment by tumor is unlikely to be solely driven by CCR5. We have preliminary evidence to suggest that other chemokine receptors, such as CCR4 and CCR10, are also selectively expressed by tumor-infiltrating Treg (data not shown). Therefore, antagonism of multiple chemokine signaling pathways may be required to completely block Treg migration. This may be achievable with viral chemokine-binding proteins such as vCCI 66–68. Secondly, there are a number of other cells recruited by the tumor to aid in immune evasion. These include myeloid-derived suppressor cells (MDSC) 69,70 tumor-associated macrophages 13, and mast cells 71. We have observed that Gr-1+CD11b+ MDSC in Pan02 tumors do not express CCR5, though another group has identified the CCR2/CCL2 signaling axis as being important for tumor-directed chemotaxis of these cells 69. Finally, complete tumor eradication by the immune system may require further priming of the effector arm, such as through vaccination using tumor-specific antigens 72,73. The latter is particularly relevant to Pan02 which is 100% lethal at 6–8 weeks at the dosage used. This redundancy in chemokine-directed migration thus may also explain why the percentage of tumor-infiltrating Treg that are CCR5+ did not change between treatment and control groups. In summary, while disruption of the CCL5-CCR5 axis skews migration of only about 20% of the CD4+ population (less Treg, more Teff), that it is physiologically important is reflected in the effects on tumor growth. We speculate that more complete chemokine blockade could have greater effects on Treg migration and tumor growth.
In conclusion, we have found that the growth of pancreatic adenocarcinoma may be inhibited by CCR5-mediated blockade of Treg migration. This phenomenon may be clinically useful in depleting tumor-associated Treg while sparing homeostatic Treg, and may lead to the development of novel immunotherapeutic strategies for patients with this lethal cancer.
Acknowledgments
This research was generously supported by the Frank Cancer Research Fund, awarded by the Barnes-Jewish Hospital Foundation. Tissue sectioning was performed through the Washington University DDRCC Core (Grant #5P30 DK052574).
We would like to thank A. Rudensky for kindly providing the Foxp3gfp reporter mice.
Footnotes
The authors have no conflicts of interest to report.
Reference List
- 1.Maloy KJ, Powrie F. Regulatory T cells in the control of immune pathology. Nat Immunol. 2001;2:816–822. doi: 10.1038/ni0901-816. [DOI] [PubMed] [Google Scholar]
- 2.Sakaguchi S, Sakaguchi N, Asano M, Itoh M, Toda M. Immunologic self-tolerance maintained by activated T cells expressing IL-2 receptor alpha-chains (CD25). Breakdown of a single mechanism of self-tolerance causes various autoimmune diseases. J Immunol. 1995;155:1151–1164. [PubMed] [Google Scholar]
- 3.Shevach EM. Regulatory T cells in autoimmmunity*. Annu Rev Immunol. 2000;18:423–449. doi: 10.1146/annurev.immunol.18.1.423. [DOI] [PubMed] [Google Scholar]
- 4.Hori S, Nomura T, Sakaguchi S. Control of regulatory T cell development by the transcription factor Foxp3. Science. 2003;299:1057–1061. doi: 10.1126/science.1079490. [DOI] [PubMed] [Google Scholar]
- 5.Belkaid Y, Rouse BT. Natural regulatory T cells in infectious disease. Nat Immunol. 2005;6:353–360. doi: 10.1038/ni1181. [DOI] [PubMed] [Google Scholar]
- 6.Sakaguchi S. Naturally arising Foxp3-expressing CD25+CD4+ regulatory T cells in immunological tolerance to self and non-self. Nat Immunol. 2005;6:345–352. doi: 10.1038/ni1178. [DOI] [PubMed] [Google Scholar]
- 7.Sakaguchi S, Yamaguchi T, Nomura T, Ono M. Regulatory T cells and immune tolerance. Cell. 2008;133:775–787. doi: 10.1016/j.cell.2008.05.009. [DOI] [PubMed] [Google Scholar]
- 8.Wang HY, Wang RF. Regulatory T cells and cancer. Curr Opin Immunol. 2007;19:217–223. doi: 10.1016/j.coi.2007.02.004. [DOI] [PubMed] [Google Scholar]
- 9.Curiel TJ, Coukos G, Zou L, Alvarez X, Cheng P, Mottram P, Evdemon-Hogan M, Conejo-Garcia JR, Zhang L, Burow M, Zhu Y, Wei S, Kryczek I, Daniel B, Gordon A, Myers L, Lackner A, Disis ML, Knutson KL, Chen L, Zou W. Specific recruitment of regulatory T cells in ovarian carcinoma fosters immune privilege and predicts reduced survival. Nat Med. 2004;10:942–949. doi: 10.1038/nm1093. [DOI] [PubMed] [Google Scholar]
- 10.Fu J, Xu D, Liu Z, Shi M, Zhao P, Fu B, Zhang Z, Yang H, Zhang H, Zhou C, Yao J, Jin L, Wang H, Yang Y, Fu YX, Wang FS. Increased regulatory T cells correlate with CD8 T-cell impairment and poor survival in hepatocellular carcinoma patients. Gastroenterology. 2007;132:2328–2339. doi: 10.1053/j.gastro.2007.03.102. [DOI] [PubMed] [Google Scholar]
- 11.Hiraoka N, Onozato K, Kosuge T, Hirohashi S. Prevalence of FOXP3+ regulatory T cells increases during the progression of pancreatic ductal adenocarcinoma and its premalignant lesions. Clin Cancer Res. 2006;12:5423–5434. doi: 10.1158/1078-0432.CCR-06-0369. [DOI] [PubMed] [Google Scholar]
- 12.Wolf D, Wolf AM, Rumpold H, Fiegl H, Zeimet AG, Muller-Holzner E, Deibl M, Gastl G, Gunsilius E, Marth C. The expression of the regulatory T cell-specific forkhead box transcription factor FoxP3 is associated with poor prognosis in ovarian cancer. Clin Cancer Res. 2005;11:8326–8331. doi: 10.1158/1078-0432.CCR-05-1244. [DOI] [PubMed] [Google Scholar]
- 13.Clark CE, Hingorani SR, Mick R, Combs C, Tuveson DA, Vonderheide RH. Dynamics of the immune reaction to pancreatic cancer from inception to invasion. Cancer Res. 2007;67:9518–9527. doi: 10.1158/0008-5472.CAN-07-0175. [DOI] [PubMed] [Google Scholar]
- 14.Visser J, Nijman HW, Hoogenboom BN, Jager P, van Baarle D, Schuuring E, Abdulahad W, Miedema F, van der Zee AG, Daemen T. Frequencies and role of regulatory T cells in patients with (pre)malignant cervical neoplasia. Clin Exp Immunol. 2007;150:199–209. doi: 10.1111/j.1365-2249.2007.03468.x. [DOI] [PMC free article] [PubMed] [Google Scholar]
- 15.El Andaloussi A, Lesniak MS. CD4+ CD25+ FoxP3+ T-cell infiltration and heme oxygenase-1 expression correlate with tumor grade in human gliomas. J Neurooncol. 2007;83:145–152. doi: 10.1007/s11060-006-9314-y. [DOI] [PubMed] [Google Scholar]
- 16.Grauer OM, Nierkens S, Bennink E, Toonen LW, Boon L, Wesseling P, Sutmuller RP, Adema GJ. CD4+FoxP3+ regulatory T cells gradually accumulate in gliomas during tumor growth and efficiently suppress antiglioma immune responses in vivo. Int J Cancer. 2007;121:95–105. doi: 10.1002/ijc.22607. [DOI] [PubMed] [Google Scholar]
- 17.Gupta S, Joshi K, Wig JD, Arora SK. Intratumoral FOXP3 expression in infiltrating breast carcinoma: Its association with clinicopathologic parameters and angiogenesis. Acta Oncol. 2007;46:792–797. doi: 10.1080/02841860701233443. [DOI] [PubMed] [Google Scholar]
- 18.Kline J, I, Brown E, Zha YY, Blank C, Strickler J, Wouters H, Zhang L, Gajewski TF. Homeostatic proliferation plus regulatory T-cell depletion promotes potent rejection of b16 melanoma. Clin Cancer Res. 2008;14:3156–3167. doi: 10.1158/1078-0432.CCR-07-4696. [DOI] [PubMed] [Google Scholar]
- 19.Knutson KL, Dang Y, Lu H, Lukas J, Almand B, Gad E, Azeke E, Disis ML. IL-2 immunotoxin therapy modulates tumor-associated regulatory T cells and leads to lasting immune-mediated rejection of breast cancers in neu-transgenic mice. J Immunol. 2006;177:84–91. doi: 10.4049/jimmunol.177.1.84. [DOI] [PubMed] [Google Scholar]
- 20.Linehan DC, Goedegebuure PS. CD25+ CD4+ regulatory T-cells in cancer. Immunol Res. 2005;32:155–168. doi: 10.1385/IR:32:1-3:155. [DOI] [PubMed] [Google Scholar]
- 21.Onizuka S, Tawara I, Shimizu J, Sakaguchi S, Fujita T, Nakayama E. Tumor rejection by in vivo administration of anti-CD25 (interleukin-2 receptor alpha) monoclonal antibody. Cancer Res. 1999;59:3128–3133. [PubMed] [Google Scholar]
- 22.Viehl CT, Moore TT, Liyanage UK, Frey DM, Ehlers JP, Eberlein TJ, Goedegebuure PS, Linehan DC. Depletion of CD4+CD25+ regulatory T cells promotes a tumor-specific immune response in pancreas cancer-bearing mice. Ann Surg Oncol. 2006;13:1252–1258. doi: 10.1245/s10434-006-9015-y. [DOI] [PubMed] [Google Scholar]
- 23.Dannull J, Su Z, Rizzieri D, Yang BK, Coleman D, Yancey D, Zhang A, Dahm P, Chao N, Gilboa E, Vieweg J. Enhancement of vaccine-mediated antitumor immunity in cancer patients after depletion of regulatory T cells. J Clin Invest. 2005;115:3623–3633. doi: 10.1172/JCI25947. [DOI] [PMC free article] [PubMed] [Google Scholar]
- 24.Shimizu J, Yamazaki S, Sakaguchi S. Induction of tumor immunity by removing CD25+CD4+ T cells: a common basis between tumor immunity and autoimmunity. J Immunol. 1999;163:5211–5218. [PubMed] [Google Scholar]
- 25.Ghiringhelli F, Puig PE, Roux S, Parcellier A, Schmitt E, Solary E, Kroemer G, Martin F, Chauffert B, Zitvogel L. Tumor cells convert immature myeloid dendritic cells into TGF-beta-secreting cells inducing CD4+CD25+ regulatory T cell proliferation. J Exp Med. 2005;202:919–929. doi: 10.1084/jem.20050463. [DOI] [PMC free article] [PubMed] [Google Scholar]
- 26.Ko K, Yamazaki S, Nakamura K, Nishioka T, Hirota K, Yamaguchi T, Shimizu J, Nomura T, Chiba T, Sakaguchi S. Treatment of advanced tumors with agonistic anti-GITR mAb and its effects on tumor-infiltrating Foxp3+CD25+CD4+ regulatory T cells. J Exp Med. 2005;202:885–891. doi: 10.1084/jem.20050940. [DOI] [PMC free article] [PubMed] [Google Scholar]
- 27.Shimizu J, Yamazaki S, Takahashi T, Ishida Y, Sakaguchi S. Stimulation of CD25(+)CD4(+) regulatory T cells through GITR breaks immunological self-tolerance. Nat Immunol. 2002;3:135–142. doi: 10.1038/ni759. [DOI] [PubMed] [Google Scholar]
- 28.Turk MJ, Guevara-Patino JA, Rizzuto GA, Engelhorn ME, Sakaguchi S, Houghton AN. Concomitant tumor immunity to a poorly immunogenic melanoma is prevented by regulatory T cells. J Exp Med. 2004;200:771–782. doi: 10.1084/jem.20041130. [DOI] [PMC free article] [PubMed] [Google Scholar]
- 29.Sutmuller RP, van Duivenvoorde LM, van Elsas A, Schumacher TN, Wildenberg ME, Allison JP, Toes RE, Offringa R, Melief CJ. Synergism of cytotoxic T lymphocyte-associated antigen 4 blockade and depletion of CD25(+) regulatory T cells in antitumor therapy reveals alternative pathways for suppression of autoreactive cytotoxic T lymphocyte responses. J Exp Med. 2001;194:823–832. doi: 10.1084/jem.194.6.823. [DOI] [PMC free article] [PubMed] [Google Scholar]
- 30.Awwad M, North RJ. Cyclophosphamide (Cy)-facilitated adoptive immunotherapy of a Cy-resistant tumour. Evidence that Cy permits the expression of adoptive T-cell mediated immunity by removing suppressor T cells rather than by reducing tumour burden. Immunology. 1988;65:87–92. [PMC free article] [PubMed] [Google Scholar]
- 31.Awwad M, North RJ. Cyclophosphamide-induced immunologically mediated regression of a cyclophosphamide-resistant murine tumor: a consequence of eliminating precursor L3T4+ suppressor T-cells. Cancer Res. 1989;49:1649–1654. [PubMed] [Google Scholar]
- 32.Ghiringhelli F, Menard C, Puig PE, Ladoire S, Roux S, Martin F, Solary E, Le Cesne A, Zitvogel L, Chauffert B. Metronomic cyclophosphamide regimen selectively depletes CD4+CD25+ regulatory T cells and restores T and NK effector functions in end stage cancer patients. Cancer Immunol Immunother. 2007;56:641–648. doi: 10.1007/s00262-006-0225-8. [DOI] [PMC free article] [PubMed] [Google Scholar]
- 33.North RJ. Cyclophosphamide-facilitated adoptive immunotherapy of an established tumor depends on elimination of tumor-induced suppressor T cells. J Exp Med. 1982;155:1063–1074. doi: 10.1084/jem.155.4.1063. [DOI] [PMC free article] [PubMed] [Google Scholar]
- 34.Huehn J, Hamann A. Homing to suppress: address codes for Treg migration. Trends Immunol. 2005;26:632–636. doi: 10.1016/j.it.2005.10.001. [DOI] [PubMed] [Google Scholar]
- 35.Cavassani KA, Campanelli AP, Moreira AP, Vancim JO, Vitali LH, Mamede RC, Martinez R, Silva JS. Systemic and local characterization of regulatory T cells in a chronic fungal infection in humans. J Immunol. 2006;177:5811–5818. doi: 10.4049/jimmunol.177.9.5811. [DOI] [PubMed] [Google Scholar]
- 36.Hasegawa H, Inoue A, Muraoka M, Yamanouchi J, Miyazaki T, Yasukawa M. Therapy for pneumonitis and sialadenitis by accumulation of CCR2-expressing CD4+CD25+ regulatory T cells in MRL/lpr mice. Arthritis Res Ther. 2007;9:R15. doi: 10.1186/ar2122. [DOI] [PMC free article] [PubMed] [Google Scholar]
- 37.Wysocki CA, Jiang Q, Panoskaltsis-Mortari A, Taylor PA, McKinnon KP, Su L, Blazar BR, Serody JS. Critical role for CCR5 in the function of donor CD4+CD25+ regulatory T cells during acute graft-versus-host disease. Blood. 2005;106:3300–3307. doi: 10.1182/blood-2005-04-1632. [DOI] [PMC free article] [PubMed] [Google Scholar]
- 38.Yurchenko E, Tritt M, Hay V, Shevach EM, Belkaid Y, Piccirillo CA. CCR5-dependent homing of naturally occurring CD4+ regulatory T cells to sites of Leishmania major infection favors pathogen persistence. J Exp Med. 2006;203:2451–2460. doi: 10.1084/jem.20060956. [DOI] [PMC free article] [PubMed] [Google Scholar]
- 39.Mizukami Y, Kono K, Kawaguchi Y, Akaike H, Kamimura K, Sugai H, Fujii H. CCL17 and CCL22 chemokines within tumor microenvironment are related to accumulation of Foxp3+ regulatory T cells in gastric cancer. Int J Cancer. 2008;122:2286–2293. doi: 10.1002/ijc.23392. [DOI] [PubMed] [Google Scholar]
- 40.Iellem A, Mariani M, Lang R, Recalde H, Panina-Bordignon P, Sinigaglia F, D’Ambrosio D. Unique chemotactic response profile and specific expression of chemokine receptors CCR4 and CCR8 by CD4(+)CD25(+) regulatory T cells. J Exp Med. 2001;194:847–853. doi: 10.1084/jem.194.6.847. [DOI] [PMC free article] [PubMed] [Google Scholar]
- 41.Kallikourdis M, Andersen KG, Welch KA, Betz AG. Alloantigen-enhanced accumulation of CCR5+ ‘effector’ regulatory T cells in the gravid uterus. Proc Natl Acad Sci USA. 2007;104:594–599. doi: 10.1073/pnas.0604268104. [DOI] [PMC free article] [PubMed] [Google Scholar]
- 42.Hirahara K, Liu L, Clark RA, Yamanaka K, Fuhlbrigge RC, Kupper TS. The majority of human peripheral blood CD4+CD25highFoxp3+ regulatory T cells bear functional skin-homing receptors. J Immunol. 2006;177:4488–4494. doi: 10.4049/jimmunol.177.7.4488. [DOI] [PubMed] [Google Scholar]
- 43.Kleinewietfeld M, Puentes F, Borsellino G, Battistini L, Rotzschke O, Falk K. CCR6 expression defines regulatory effector/memory-like cells within the CD25(+)CD4+ T-cell subset. Blood. 2005;105:2877–2886. doi: 10.1182/blood-2004-07-2505. [DOI] [PubMed] [Google Scholar]
- 44.Menning A, Hopken UE, Siegmund K, Lipp M, Hamann A, Huehn J. Distinctive role of CCR7 in migration and functional activity of naive- and effector/memory-like Treg subsets. Eur J Immunol. 2007;37:1575–1583. doi: 10.1002/eji.200737201. [DOI] [PubMed] [Google Scholar]
- 45.Liyanage UK, Moore TT, Joo HG, Tanaka Y, Herrmann V, Doherty G, Drebin JA, Strasberg SM, Eberlein TJ, Goedegebuure PS, Linehan DC. Prevalence of regulatory T cells is increased in peripheral blood and tumor microenvironment of patients with pancreas or breast adenocarcinoma. J Immunol. 2002;169:2756–2761. doi: 10.4049/jimmunol.169.5.2756. [DOI] [PubMed] [Google Scholar]
- 46.Corbett TH, Roberts BJ, Leopold WR, Peckham JC, Wilkoff LJ, Griswold DP, Jr, Schabel FM., Jr Induction and chemotherapeutic response of two transplantable ductal adenocarcinomas of the pancreas in C57BL/6 mice. Cancer Res. 1984;44:717–726. [PubMed] [Google Scholar]
- 47.Liyanage UK, Goedegebuure PS, Moore TT, Viehl CT, Moo-Young TA, Larson JW, Frey DM, Ehlers JP, Eberlein TJ, Linehan DC. Increased prevalence of regulatory T cells (Treg) is induced by pancreas adenocarcinoma. J Immunother. 2006;29:416–424. doi: 10.1097/01.cji.0000205644.43735.4e. (1997) [DOI] [PubMed] [Google Scholar]
- 48.Ventura A, Meissner A, Dillon CP, McManus M, Sharp PA, Van Parijs L, Jaenisch R, Jacks T. Cre-lox-regulated conditional RNA interference from transgenes. Proc Natl Acad Sci USA. 2004;101:10380–10385. doi: 10.1073/pnas.0403954101. [DOI] [PMC free article] [PubMed] [Google Scholar]
- 49.Shiraishi M, Aramaki Y, Seto M, Imoto H, Nishikawa Y, Kanzaki N, Okamoto M, Sawada H, Nishimura O, Baba M, Fujino M. Discovery of novel, potent, and selective small-molecule CCR5 antagonists as anti-HIV-1 agents: synthesis and biological evaluation of anilide derivatives with a quaternary ammonium moiety. J Med Chem. 2000;43:2049–2063. doi: 10.1021/jm9906264. [DOI] [PubMed] [Google Scholar]
- 50.Baba M, Nishimura O, Kanzaki N, Okamoto M, Sawada H, Iizawa Y, Shiraishi M, Aramaki Y, Okonogi K, Ogawa Y, Meguro K, Fujino M. A small-molecule, nonpeptide CCR5 antagonist with highly potent and selective anti-HIV-1 activity. Proc Natl Acad Sci USA. 1999;96:5698–5703. doi: 10.1073/pnas.96.10.5698. [DOI] [PMC free article] [PubMed] [Google Scholar]
- 51.Gao P, Zhou XY, Yashiro-Ohtani Y, Yang YF, Sugimoto N, Ono S, Nakanishi T, Obika S, Imanishi T, Egawa T, Nagasawa T, Fujiwara H, Hamaoka T. The unique target specificity of a nonpeptide chemokine receptor antagonist: selective blockade of two Th1 chemokine receptors CCR5 and CXCR3. J Leukoc Biol. 2003;73:273–280. doi: 10.1189/jlb.0602269. [DOI] [PubMed] [Google Scholar]
- 52.Colombo MP, Piconese S. Regulatory-T-cell inhibition versus depletion: the right choice in cancer immunotherapy. Nat Rev Cancer. 2007;7:880–887. doi: 10.1038/nrc2250. [DOI] [PubMed] [Google Scholar]
- 53.Ng-Cashin J, Kuhns JJ, Burkett SE, Powderly JD, Craven RR, van Deventer HW, Kirby SL, Serody JS. Host absence of CCR5 potentiates dendritic cell vaccination. J Immunol. 2003;170:4201–4208. doi: 10.4049/jimmunol.170.8.4201. [DOI] [PubMed] [Google Scholar]
- 54.Karnoub AE, Dash AB, Vo AP, Sullivan A, Brooks MW, Bell GW, Richardson AL, Polyak K, Tubo R, Weinberg RA. Mesenchymal stem cells within tumour stroma promote breast cancer metastasis. Nature. 2007;449:557–563. doi: 10.1038/nature06188. [DOI] [PubMed] [Google Scholar]
- 55.Musha H, Ohtani H, Mizoi T, Kinouchi M, Nakayama T, Shiiba K, Miyagawa K, Nagura H, Yoshie O, Sasaki I. Selective infiltration of CCR5(+)CXCR3(+) T lymphocytes in human colorectal carcinoma. Int J Cancer. 2005;116:949–956. doi: 10.1002/ijc.21135. [DOI] [PubMed] [Google Scholar]
- 56.Vaday GG, Peehl DM, Kadam PA, Lawrence DM. Expression of CCL5 (RANTES) and CCR5 in prostate cancer. Prostate. 2006;66:124–134. doi: 10.1002/pros.20306. [DOI] [PubMed] [Google Scholar]
- 57.Sugasawa H, Ichikura T, Tsujimoto H, Kinoshita M, Morita D, Ono S, Chochi K, Tsuda H, Seki S, Mochizuki H. Prognostic significance of expression of CCL5/RANTES receptors in patients with gastric cancer. J Surg Oncol. 2008;97:445–450. doi: 10.1002/jso.20984. [DOI] [PubMed] [Google Scholar]
- 58.Monti P, Marchesi F, Reni M, Mercalli A, Sordi V, Zerbi A, Balzano G, Di C, Allavena VP, Piemonti L. A comprehensive in vitro characterization of pancreatic ductal carcinoma cell line biological behavior and its correlation with the structural and genetic profile. Virchows Arch. 2004;445:236–247. doi: 10.1007/s00428-004-1053-x. [DOI] [PubMed] [Google Scholar]
- 59.Menu E, De Leenheer E, De Raeve H, Coulton L, Imanishi T, Miyashita K, Van Valckenborgh E, Van R, Van Camp IB, Horuk R, Croucher P, Vanderkerken K. Role of CCR1 and CCR5 in homing and growth of multiple myeloma and in the development of osteolytic lesions: a study in the 5TMM model. Clin Exp Metastasis. 2006;23:291–300. doi: 10.1007/s10585-006-9038-6. [DOI] [PubMed] [Google Scholar]
- 60.Yang YF, Mukai T, Gao P, Yamaguchi N, Ono S, Iwaki H, Obika S, Imanishi T, Tsujimura T, Hamaoka T, Fujiwara H. A non-peptide CCR5 antagonist inhibits collagen-induced arthritis by modulating T cell migration without affecting anti-collagen T cell responses. Eur J Immunol. 2002;32:2124–2132. doi: 10.1002/1521-4141(200208)32:8<2124::AID-IMMU2124>3.0.CO;2-S. [DOI] [PubMed] [Google Scholar]
- 61.Uekusa Y, Yu WG, Mukai T, Gao P, Yamaguchi N, Murai M, Matsushima K, Obika S, Imanishi T, Higashibata Y, Nomura S, Kitamura Y, Fujiwara H, Hamaoka T. A pivotal role for CC chemokine receptor 5 in T-cell migration to tumor sites induced by interleukin 12 treatment in tumor-bearing mice. Cancer Res. 2002;62:3751–3758. [PubMed] [Google Scholar]
- 62.Hasegawa H, Inoue A, Kohno M, Lei J, Miyazaki T, Yoshie O, Nose M, Yasukawa M. Therapeutic effect of CXCR3-expressing regulatory T cells on liver, lung and intestinal damages in a murine acute GVHD model. Gene Ther. 2008;15:171–182. doi: 10.1038/sj.gt.3303051. [DOI] [PubMed] [Google Scholar]
- 63.Kristensen NN, Olsen J, Gad M, Claesson MH. Genome-wide expression profiling during protection from colitis by regulatory T cells. Inflamm Bowel Dis. 2008;14:75–87. doi: 10.1002/ibd.20277. [DOI] [PubMed] [Google Scholar]
- 64.Plater-Zyberk C, Hoogewerf AJ, Proudfoot AE, Power CA, Wells TN. Effect of a CC chemokine receptor antagonist on collagen induced arthritis in DBA/1 mice. Immunol Lett. 1997;57:117–120. doi: 10.1016/s0165-2478(97)00075-8. [DOI] [PubMed] [Google Scholar]
- 65.Robinson SC, Scott KA, Wilson JL, Thompson RG, Proudfoot AE, Balkwill FR. A chemokine receptor antagonist inhibits experimental breast tumor growth. Cancer Res. 2003;63:8360–8365. [PubMed] [Google Scholar]
- 66.Burns JM, Dairaghi DJ, Deitz M, Tsang M, Schall TJ. Comprehensive mapping of poxvirus vCCI chemokine-binding protein. Expanded range of ligand interactions and unusual dissociation kinetics. J Biol Chem. 2002;277:2785–2789. doi: 10.1074/jbc.M109884200. [DOI] [PubMed] [Google Scholar]
- 67.Bursill CA, Cash JL, Channon KM, Greaves DR. Membrane-bound CC chemokine inhibitor 35K provides localized inhibition of CC chemokine activity in vitro and in vivo. J Immunol. 2006;177:5567–5573. doi: 10.4049/jimmunol.177.8.5567. [DOI] [PubMed] [Google Scholar]
- 68.Seet BT, McFadden G. Viral chemokine-binding proteins. J Leukoc Biol. 2002;72:24–34. [PubMed] [Google Scholar]
- 69.Huang B, Lei Z, Zhao J, Gong W, Liu J, Chen Z, Liu Y, Li D, Yuan Y, Zhang GM, Feng ZH. CCL2/CCR2 pathway mediates recruitment of myeloid suppressor cells to cancers. Cancer Lett. 2007;252:86–92. doi: 10.1016/j.canlet.2006.12.012. [DOI] [PubMed] [Google Scholar]
- 70.Sawanobori Y, Ueha S, Kurachi M, Shimaoka T, Talmadge JE, Abe J, Shono Y, Kitabatake M, Kakimi K, Mukaida N, Matsushima K. Chemokine-mediated rapid turnover of myeloid-derived suppressor cells in tumor-bearing mice. Blood. 2008 doi: 10.1182/blood-2008-01-136895. [DOI] [PubMed] [Google Scholar]
- 71.Lu LF, Lind EF, Gondek DC, Bennett KA, Gleeson MW, Pino-Lagos K, Scott ZA, Coyle AJ, Reed JL, Van Snick J, Strom TB, Zheng XX, Noelle RJ. Mast cells are essential intermediaries in regulatory T-cell tolerance. Nature. 2006;442:997–1002. doi: 10.1038/nature05010. [DOI] [PubMed] [Google Scholar]
- 72.Li M, Bharadwaj U, Zhang R, Zhang S, Mu H, Fisher WE, Brunicardi FC, Chen C, Yao Q. Mesothelin is a malignant factor and therapeutic vaccine target for pancreatic cancer. Mol Cancer Ther. 2008;7:286–296. doi: 10.1158/1535-7163.MCT-07-0483. [DOI] [PMC free article] [PubMed] [Google Scholar]
- 73.Thomas AM, Santarsiero LM, Lutz ER, Armstrong TD, Chen YC, Huang LQ, Laheru DA, Goggins M, Hruban RH, Jaffee EM. Mesothelin-specific CD8(+) T cell responses provide evidence of in vivo cross-priming by antigen-presenting cells in vaccinated pancreatic cancer patients. J Exp Med. 2004;200:297–306. doi: 10.1084/jem.20031435. [DOI] [PMC free article] [PubMed] [Google Scholar]