

Abstract
We developed 1108 transcription factor gene-derived microsatellite (TFGMS) and 161 transcription factor functional domain-associated microsatellite (TFFDMS) markers from 707 TFs of chickpea. The robust amplification efficiency (96.5%) and high intra-specific polymorphic potential (34%) detected by markers suggest their immense utilities in efficient large-scale genotyping applications, including construction of both physical and functional transcript maps and understanding population structure. Candidate gene-based association analysis revealed strong genetic association of TFFDMS markers with three major seed and pod traits. Further, TFGMS markers in the 5′ untranslated regions of TF genes showing differential expression during seed development had higher trait association potential. The significance of TFFDMS markers was demonstrated by correlating their allelic variation with amino acid sequence expansion/contraction in the functional domain and alteration of secondary protein structure encoded by genes. The seed weight-associated markers were validated through traditional bi-parental genetic mapping. The determination of gene-specific linkage disequilibrium (LD) patterns in desi and kabuli based on single nucleotide polymorphism-microsatellite marker haplotypes revealed extended LD decay, enhanced LD resolution and trait association potential of genes. The evolutionary history of a strong seed-size/weight-associated TF based on natural variation and haplotype sharing among desi, kabuli and wild unravelled useful information having implication for seed-size trait evolution during chickpea domestication.
Keywords: association mapping, chickpea, microsatellite, SNP, transcription factor
1. Introduction
Microsatellite markers are preferred in plant genetic and genome analyses owing to their desirable genetic attributes, including hypervariability, multi-allelic nature, reproducibility, co-dominant inheritance, chromosome-specific location and wide genomic distribution. The significance of such markers particularly those derived from the protein-coding sequences and non-coding untranslated regions (UTRs) of genes has reportedly been attributed to their inherent affinity to act as ‘functional genetic markers’ for rapidly establishing marker–trait linkages and to identify genes/quantitative trait loci (QTLs) for traits of agricultural importance in crop plants.1–3 Moreover, these genic markers have proven to be advantageous over anonymous markers for functional genetic diversity estimation, construction of transcript map, marker-assisted selection, trait association analysis and comparative mapping as well as in evolutionary studies as anchor markers in plant species, including chickpea.2–8 In chickpea, a total of ∼11 000 genic microsatellite markers have been developed so far in silico from the expressed sequence tags (ESTs)7–10 and next-generation de novo transcript sequences of diverse contrasting genotypes.11–14 However, only a smaller proportion (∼5–10%) of these markers have been validated experimentally and used for various genotyping applications in chickpea. The remaining (∼90–95%) larger sets of in silico designed genic markers have not even been verified for their amplification of target microsatellite sequence in chickpea genotypes from which the markers were designed. Nevertheless, the lack of requisite intra- and inter-specific genetic polymorphisms detected by such genic microsatellite markers,6,7,9,10 which are derived from the conserved expressed component of the genome, has limited their use in identification and fine mapping of genes/QTLs for important agronomic traits in chickpea. Additionally, it is also difficult to select useful and informative genic markers from such largely available in silico marker datasets (∼11 000 markers) for validation and efficient genotyping applications in chickpea. Therefore, the construction of a smaller database comprising of experimentally validated and functionally relevant genic microsatellite markers with relatively high polymorphic potential is essential for various applications of genetics, genomics and breeding in chickpea.
The recent advancement of novel array-based sequencing technologies, high-throughput genotyping and modern genomic tools have accelerated the generation of transcript sequences encoding the known/candidate genes globally and their corresponding protein-coding and UTR sequences in diverse contrasting chickpea genotypes at a genome-wide scale.8,11–14 It includes identification of 1773 transcription factor (TF)-encoding genes from very high-depth next-generation de novo transcript sequences of chickpea desi genotype ICC 4958 (Chickpea Transcriptome Database, CTDB release 1.0, http://www.nipgr.res.in/ctdb.html).12 There have been substantial evidences on the role of functional domains in the TF gene-encoding proteins as master regulators for controlling diverse and complex cellular processes,15,16 such as development and stress responses and domestication in monocot and dicot species including legumes.16–18 The use of functional domains of TF genes for developing informative genic microsatellite markers in the case of two Solanaceous plant species, such as tomato and pepper, has been well documented.19 Hence, the TFs with well-characterized functional domains will serve as excellent candidates and valuable transcriptomic resource for novel sequence-based genic functional microsatellite marker development in chickpea. Besides, the large-scale validation and high-throughput genotyping of such designed TF gene-derived microsatellite (TFGMS) and TF functional domain-associated microsatellite (TFFDMS) markers in a diverse set of desi, kabuli and wild genotypes would have profound utility in various applications of structural, functional and comparative genomics, including marker-assisted genetic improvement in chickpea.
In view of the above, the present study was undertaken to develop informative TFGMS and TFFDMS markers from the TF genes and to evaluate their potential for large-scale genotyping applications in chickpea. The functional significance of such TF gene-based microsatellite markers was assessed by integrating trait association analysis with genetic mapping, differential expression profiling, protein modelling and linkage disequilibrium (LD)-based haplotype gene evolution in chickpea.
2. Materials and methods
2.1. Development and physical mapping of genic TFGMS and TFFDMS markers
The FASTA sequences of 1773 unique TF encoding transcripts of chickpea genotype ICC495811,12 were batch acquired from Chickpea Transcriptome Database (CTDB version 1.0, http://www.nipgr.res.in/ctdb.html). These transcript sequences were searched individually for microsatellites using MISA (Microsatellite, http://pgrc.ipk-gatersleben.de/misa). The identified microsatellites were characterized as perfect (mononucleotides to hexanucleotides) and hypervariable Class I (≥20 nucleotides) and Class II (12–20 nucleotides) based on the length of the repeat motifs.4,20 The microsatellite containing TF-encoding transcripts were analysed in the NCBI open reading frame (ORF) Finder (http://www.ncbi.nlm.nih.gov/projects/gorf) to predict the longest ORF within the transcripts. The amino acid sequences encoded by the predicted ORF of microsatellite containing transcripts were analysed using Pfam and further BLAST searched against the NCBI conserved domain and the nr protein database (http://www.ncbi.nlm.nih.gov/Structure/cdd/wrpsb.cgi) to determine the presence of functional domains within the ORF. Further, these amino acid sequences were sequence homology (BLAST) searched against 1770 AGRIS TF genes21 of Arabidopsis thaliana (TAIR 10 release, www.arabidopsis.org), TF database22 of legumes (1467 TFs of Medicago truncatula, 5035 of Glycine max and 1626 of Lotus japonicas) and 1470 TFs of Cajanus cajan.23 Based on above analyses, a set of microsatellite containing TF gene orthologues of chickpea with conserved functional domains were screened at a high bit score of ≥500 and E-value of ≤1e−41. Finally, the localization of functional domains in the ORF encoding amino acid sequences was correlated with the positions of microsatellite repeat motifs in their corresponding transcripts. The unique forward and reverse primers with the amplification product size of 200–400 bp targeting both functional domain and microsatellite repeat-motif regions were designed (BatchPrimer3, http://probes.pw.usda.gov/batchprimer3) based on two criteria (Fig. 1), and two distinct groups of Type I and Type II TFFDMS markers in chickpea were developed. The unique primer pairs designed exclusively from the ORF and 5′ and 3′ UTRs of TF gene/transcript sequences flanking the microsatellite repeat motifs (without inclusion of the functional domain regions) were developed as TFGMS markers (Fig. 1) in chickpea.
Figure 1.
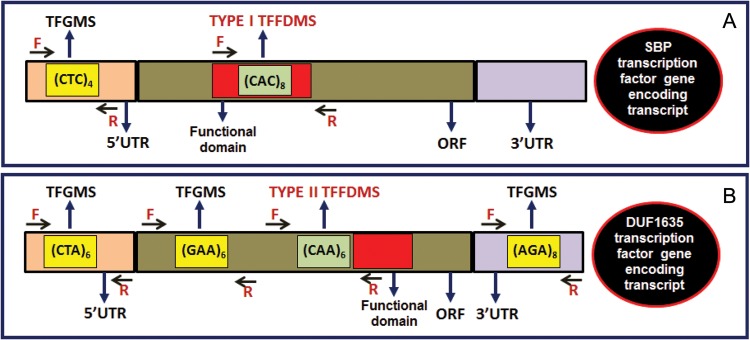
Development of TFGMS and TFFDMS markers from different UTR and ORF sequence components of TF genes in chickpea. The forward and reverse primers designed from the transcript sequences flanking the microsatellite repeat motifs that are present within and/or adjacent to the functional domain regions of TF genes were used to develop Type I (A) and Type II (B) TFFDMS markers, respectively. Primers designed from the flanking sequences of the microsatellite repeat motifs that are present either in the ORF (A) (other than Type I and Type II TFFDMS) or 5′ and 3′ UTRs (B) of TF genes were used to develop TFGMS markers.
The transcript sequences flanking the TFGMS and TFFDMS repeat motifs were BLAST searched (E-value = 0) against recently released draft genome pseudomolecules (version 1.1)24 of chickpea to determine the physical positions (bp) of the designed genic markers on the eight chromosomes. The microsatellite markers with unique BLAST hits on the pseudomolecules were allocated individually across the chickpea chromosomes based on their ascending order of physical position (bp) and visualized using the MapChart software (version 2.2).25
2.2. Evaluation of amplification efficiency and polymorphic potential
To evaluate the amplification efficiency of in silico designed genic microsatellite markers, primers for a total of 1000 perfect microsatellite markers, including 148 Class I and 691 Class II TFGMS and 161 TFFDMS markers, were synthesized and amplification carried out from genomic DNA of chickpea genotype ICC4958, the source of sequence for designing primers. The TFGMS and TFFDMS markers exhibiting clear and reproducible amplicons in the gel-based assay were further amplified using the genomic DNA isolated from 92 desi and kabuli chickpea genotypes and 4 accession of wild species (Cicer reticulatum; Supplementary Table S1) for accessing their polymorphic potential. The standard polymerase chain reaction (PCR) constituents and optimum cyclic conditions except for annealing temperature (55–60°C, depending on the primers used) were used for PCR amplification. The amplified PCR products were resolved in 3.5% metaphor agarose gel and their band-size was determined against a 50-bp DNA ladder. A selected set of TFGMS and TFFDMS markers showing monomorphic as well as polymorphic amplification in metaphor agarose gel among 96 genotypes were further resolved using the automated fragment analyzer. For automated fragment analysis, the PCR products amplified from fluorescent dye-labelled primers were mixed with Hi-Di™ formamide loading buffer and GeneScan-600LIZ size standard (Applied Biosystems, IL, USA), denatured, cooled and resolved in automated 96 capillary ABI 3730xl DNA Analyzer (Applied Biosystems). The electrophoregram containing trace files were analysed, and automated allele calling was carried out using the GeneMapper version 4.0 (Applied Biosystems). Based on these analyses, the actual allele size (bp) and fragment length polymorphism (bp) detected by TFGMS and TFFDMS markers in 96 genotypes were determined. The genotyping data of all TFGMS and TFFDMS markers validated both in gel-based assay and automated fragment analysis were used to estimate the frequency and distribution of amplified alleles, average polymorphic alleles per marker, per cent polymorphism and polymorphism information content (PIC) employing the PowerMarker version 3.51.26 To confirm that the TFGMS and TFFDMS markers did amplify the expected microsatellite repeat motifs in different genotypes, the amplified PCR products of size variant amplicons generated from different polymorphic TFGMS and TFFDMS markers were purified, cloned in pGEM-T Easy Vector (Promega, USA) and sequenced in both forward and reverse directions twice on a capillary-based Automated DNA Sequencer (Applied Biosystems, ABI 3730xl DNA Analyzer) using the BigDye Terminator v3.1 sequencing kit and M13 forward and reverse primers. The trace files were base called, checked for quality and then assembled into contigs. The high-quality consensus sequences thus obtained for each markers were aligned and compared among genotypes. The presence of predicted microsatellite repeat motifs and correspondence of fragment length polymorphism with repeat length expansion/contraction for each polymorphic markers were inferred among chickpea genotypes.
2.3. Assessment of population genetic structure and functional molecular diversity
The validated polymorphic TFGMS and TFFDMS markers and 96 previously reported27 genomic microsatellite markers distributed over eight chromosomes/linkage groups (LGs) of chickpea were used to determine population structure and functional molecular diversity and to establish genetic relationships among 96 genotypes (Supplementary Table S1). The marker genotyping data were used in a model-based programme, STRUCTURE,28 for the determination of population structure using the admixture and correlated allele frequency with a burn-in of 50 000 iterations and run length of 100 000. Analysis of population genetic structure among genotypes was carried out using the Bayesian clustering algorithm of STRUCTURE with varying levels of K (number of population) = 2–10. The average of Ln P(D) against each K across 20 independent replications was estimated and plotted. The K at which Ln P(D) plateaus with α-value of <0.2 was considered as optimum K. Using this optimum K, the population structure model representing better relationships among 96 genotypes was constructed. Various population genetic parameters, including the efficiency of TFGMS and TFFDMS marker loci, for detecting genetic variability (FST) and the degree of admixture within and between population groups were estimated.
2.4. Trait association analysis
To evaluate the efficiency of TFGMS and TFFDMS markers for seed and pod trait-specific association in chickpea, the candidate gene-based association analysis was performed in 96 genotypes (representing >85% diversity of total core germplasm lines), which were selected from 417 global core germplasm collections of chickpea based on their phenotypic and genotypic diversity estimate measures. The constituted association panel (representing 16 countries of the world) included 92 diverse small and large seed-size desi and kabuli germplasm lines, released varieties and breeding lines and four wild accessions of C. reticulatum (Supplementary Table S1). The genotyping data of validated polymorphic TFGMS and TFFDMS markers and 96 genomic microsatellite markers27 distributed over eight chromosomes/LGs of chickpea and phenotypic data of three major seed and pod traits (100-seed weight, number of pods per plant and number of seeds per plant) on 96 association mapping panel were analysed in the TASSEL (http://www.maizegenetics.net29). A general linear model (GLM) and mixed linear model (MLM) considering the multiple levels of ancestry coefficient data (Q matrix) as obtained in the population genetic structure at an optimal population number and relative kinship (K) matrix estimated from SPAGeDi 1.230 were used to measure the two important parameters of trait association namely, P_adj_marker (significant association of TFGMS and TFFDMS markers with traits) and marker R_square (magnitude of association/correlation, i.e. proportion of phenotypic variance explained by the markers with traits). The GLM trait association model was permuted 1000 times to optimize the threshold significance level for association analysis. Finally, based on the combined results of GLM and MLM analyses, the TFGMS and TFFDMS markers showing association with three major seed and pod traits in chickpea genotypes at significant cut-off P_adj value of ≤0.05 (with 95% confidence) and R2-value of ≥0.10 were selected for further analyses.
2.5. Transcript map construction and genetic mapping
The genotyping data of TFGMS and TFFDMS markers and genomic microsatellite markers showing polymorphism between two parental small desi (ICCX-810800 with 100-seed weight 11 g) and large kabuli (ICC20268 with 100-seed weight 47 g) genotypes and 94 individuals of F3 mapping population derived from intra-specific crosses between above desi × kabuli genotypes were analysed using JoinMap 4.1 (http://www.kyazma.nl/index.php/mc.JoinMap) at higher logarithm of odds (LOD) threshold with Kosambi function. Finally, the genic microsatellite markers one in each TFs and genomic microsatellite markers were allocated into defined LGs, and the genetic map was constructed using the MapChart version 2.2.25
Genetic/QTL mapping was performed using the genotyping data of 96 parental polymorphic TFGMS and TFFDMS markers and 32 genomic microsatellite markers, 100-seed weight/size trait-specific precise phenotyping data of 94 F3 segregating individuals and 2 parental genotypes and genetic linkage map information of markers mapped on the eight LGs of chickpea. The segregating individuals along with parental genotypes were phenotyped in the field in randomized block design with at least two replications for two consecutive years, and 100-seed weight (g) was measured by taking the average weight of 100 seeds in each mapping individuals. The frequency distribution and analysis of variance (ANOVA) of 100-seed weight trait-specific phenotypic data in the 96 segregating mapping population were analysed using SPSS 17.0 (http://www.spss.com/statistics, IBM SPSS Inc. for window, Chicago, USA). The single marker analysis, interval mapping and composite interval mapping function of MapQTL 631 with an LOD threshold score of >3.0 at 1000 permutations were significantly considered (5% level of significance) to identify and to map the major TF genes/QTLs for 100-seed weight/size on the chickpea LGs.
2.6. Differential expression profiling
To access the utility of genic markers for regulatory gene functions, the differential expression analyses of seed and pod trait-specific TFGMS and TFFDMS-associated TF genes were performed in two chickpea genotypes. The total RNA was isolated (Trizol, Invitrogen, USA) from two different seed developmental stages (early cell division phase during 10–20 days after podding (DAP) and late maturation phase during 21–30 DAP) of small (desi ICCX-810800) and large (kabuli ICC20268) seed-size genotypes considering leaf at vegetative stage as control. The isolated total RNA was quantified and diluted to equal concentration and used for first-strand cDNA synthesis by the ImProm-II™ Reverese Transcription system (Promega). The synthesized cDNA was further amplified with above-said TF gene-based markers using the semi-quantitative and SYBR green chemistry-based real-time quantitative RT-PCR. The house-keeping gene elongation factor 1-alpha (EF1α) suitable for consistent expression across various organs and developmental stages of chickpea32 was used as internal control in RT-PCR assays. Three biological replicates of each sample and three technical replicates of each biological replicate, with no template and primer as control, were analysed for individual marker in quantitative RT-PCR. The expression level of trait-associated genic markers obtained in diverse seed developmental stages of two contrasting genotypes was compared with each other and with control. Based on this, a set of trait-associated TF genes showing differential expression during seed development in chickpea genotypes was identified. To confirm the presence of TFGMS and TFFDMS repeat motifs in the transcripts and further to derive the correspondence of differential expression profiling with fragment length polymorphism based on variable microsatellite repeat units, the cDNA and genomic DNA fragments amplified from seed and pod trait-associated TF gene-based markers in two contrasting chickpea genotypes were cloned and sequenced as mentioned above.
2.7. Functional relevance of TFFDMS markers in silico
To infer in silico, the functional significance of seed and pod trait-associated TFFDMS markers showing fragment length polymorphism in both small and large seed-size chickpea genotypes, the amino acid sequences of the functional domains carrying microsatellites in five TF genes was analysed using Modeller 9v8 (http://salilab.org/modeller). Three-dimensional homology modelling of these TFFDMS containing TF gene-encoding proteins were performed by selecting a suitable template in each case where 10 models of the target proteins were generated. These predicted models were energy minimized (1000 steps) and their overall stereochemical quality and accuracy were evaluated employing Ramchandran plot analysis.33 The best model was selected having >90% of its residues lying in the most favoured region of Ramchandran plot. Finally, the best models of each TFFDMS carrying TF gene-encoding proteins were visualized and analysed using a highly interactive and extensive molecular graphic programme of CHIMERA (www.cgl.ucsj.edu/chimera).
2.8. Estimation of gene-specific LD patterns
To determine the pattern of LD within the genes, the seed and pod trait-specific TFGMS and TFFDMS markers-associated TF genes were cloned and sequenced. The high-quality sequences generated for each gene were aligned among 96 chickpea genotypes (Supplementary Table S1) using the CLUSTALW multiple sequence alignment tool in MEGA 4.034 and mined the single nucleotide polymorphism (SNP) loci. The results were exported in meg format, and the meg files were analysed further using DNaSp version 5.035 to estimate the level of nucleotide diversity (π),36 Watterson's θ level of SNPs for the population mutation rate37 and Tajima's D statistic38 across the genotypes. Finally, the SNP (minor allele frequency ≥0.05), TFGMS and TFFDMS marker genotyping information generated in the TF genes were used for the constitution of haplotypes and the determination of haplotype diversity and LD patterns within these genes among desi and kabuli. The genic SNP and microsatellite marker-based haplotype genotyping information were further correlated with three major seed and pod trait-specific phenotypic information of 96 association mapping panel for trait association analysis using the TASSEL as mentioned earlier. In the TF genes, the LD decay was estimated by combining the r2-values of marker pairs present in each 100 bp equal interval sequenced regions between 0 and 1 kb. The graph was plotted between pooled r2 and physical distance based on the non-linear regression model;39,40 and ultimately, the trend of LD decay was estimated in desi and kabuli.
3. Results and discussion
3.1. Development of genic TFGMS and TFFDMS markers and their PCR amplification efficiency
A total of 1773 TF gene-encoding transcript sequences of chickpea ICC4958 were mined for microsatellite repeat motifs and used to design both the genic TFGMS and TFFDMS markers for large-scale genotyping applications. Forward and reverse primer pairs could be designed from the transcript sequences flanking 1269 perfect microsatellite repeat motifs present in 707 TF genes (Supplementary Table S2). The analysis led to the development of 1108, including 148 (13.4%) Class I and 960 (86.6%) Class II TFGMS markers in 564 TF genes of chickpea. A set of 567 (51.2%) and 541 (48.8%) TFGMS markers were designed from the ORF and 5′ and 3′ UTRs of the TF genes, respectively. The density of TFGMS markers in the ORF of TF genes was higher (1 per 1.1 kb) than that estimated in the UTRs (1 per 1.4 kb). The CAA-rich trinucleotide (82.2%) and non-triplet repeat motifs (57.7%) carrying TFGMS markers were predominant in the ORF and UTRs of TF genes, respectively. It could be due to more selection against the frameshift mutations in the ORF than the UTRs, resulting in limited expansion of non-triplet microsatellite motifs in the ORF of TF genes in chickpea.2–4,11,12 According to localization of the microsatellite repeat motifs adjacent/within the functional domains of TF genes (Fig. 1), a set of 161 including 20 (12.4%) Class I TFFDMS markers in the 143 TF genes was designed (Supplementary Table S2). It comprises 74 Type I and 87 Type II TFFDMS markers. The trinucleotide repeat motifs (87.7%) carrying TFFDMS markers were abundant in the TF genes. Remarkably, we identified 27 such genes in which multiple TFGMS and TFFDMS markers could be designed from individual genes. It thus resulted in the development of 64 markers, including 37 TFGMS and 27 TFFDMS, from 27 TF genes. All the designed 1108 TFGMS and 161 TFFDMS markers in the 707 TF genes were submitted to publicly available NCBI Probe database (Accession numbers PUID16584974 to PUID16586242) for unrestricted use (Supplementary Table S2). Our marker dataset was compared between earlier reported 657 TF gene-derived and 279 EST-based microsatellite markers in chickpea,6,7 where notably two genic microsatellite markers were found to be common in both. This confirms TF gene-based microsatellite markers developed in our study for chickpea genome to be novel and not reported earlier.
To evaluate the amplification efficiency of designed genic microsatellite markers, a selected set of 1000 including 148 Class I and 691 Class II perfect TFGMS markers and 161 TFFDMS markers were PCR amplified (Supplementary Table S2). A total of 801 (95.5%) TFGMS and 157 (97.5%) TFFDMS markers of these produced clear and reproducible amplicons with fragments of expected product size in metaphor agarose gel. The remaining (3–5%) did not give amplification in any of the 96 chickpea genotypes including the ICC4958 from which the primers were designed. To verify the amplicon for expected microsatellite repeat motifs and also to exclude the possibility of cross-amplification particularly for the TFFDMS markers, the amplified PCR products obtained from each of 24 TFGMS and TFFDMS markers in selected genotypes were cloned and sequenced. In about 97% of markers, the existence of target TFGMS and TFFDMS repeat motifs as well as their corresponding flanking transcript sequences were observed (Fig. 2A). A high (average 96.5%) amplification success rate of TFGMS and TFFDMS markers and their subsequent validation through large-scale cloned amplicon sequencing suggested the utility of TF gene-encoding transcript sequences in designing the informative sequence-based robust genic markers for their immense use in various large-scale genotyping applications in chickpea.
Figure 2.

Allelic variation detected among a representative set of desi and kabuli genotypes using normal unlabelled and fluorescent dye-labelled TFGMS and TFFDMS markers in gel-based assay (A) and automated fragment analyzer (B), respectively. A maximum of 8 and 10 polymorphic alleles were amplified by markers among 96 chickpea genotypes using the gel-based assay (A) and automated fragment analyzer (B), respectively. The fragment sizes (bp) for all the amplified polymorphic alleles are indicated. The sequencing of cloned amplicons from different TFGMS and TFFDMS markers showing fragment length polymorphism validated the presence of expected microsatellite repeat motifs and further corresponded with their variations and step-wise multiples of the number of repeat units.
3.2. Polymorphic potential of genic TFGMS and TFFDMS markers and molecular basis of their fragment length polymorphism
The 801 TFGMS (137 Class I and 664 Class II) and 157 TFFDMS markers showing successful amplification were used to study polymorphic potential among a set of 92 desi and kabuli genotypes and 4 accessions of a wild species (Supplementary Table S1). Two hundred and fifty-eight (32.2%) of the 801 TFGMS markers in the 203 TF genes were polymorphic (with average PIC of 0.44) among 96 genotypes in 3.5% metaphor agarose gel (Supplementary Table S2). It included 54 of the 137 (39.4%, with an average PIC of 0.51) Class I and 204 of the 664 (30.7%, 0.40) Class II TFGMS markers. The TFGMS markers designed specifically from the 5′ UTR (36.2%) of TF genes revealed more polymorphism than that from the conserved ORF sequences (30.7%). Two hundred and thirty-one (28.8%) of the 801 TFGMS markers in the 193 TF genes showed polymorphism (1–5 alleles and mean PIC of 0.41) among the 52 desi genotypes, whereas 192 (24%) markers in the 147 genes detected polymorphism (1–4 alleles and mean PIC of 0.36) in the 40 kabuli genotypes. The extent of polymorphism detected by the genic markers between desi and kabuli genotypes (31%) was higher than within the desi and kabuli genotypes (26%). The inter-specific polymorphism between cultivated and wild species (33.4%) was higher in contrast to that of intra-specific polymorphism in the desi and kabuli genotypes (28%). A total of 897 alleles were amplified by 258 polymorphic TFGMS markers in 96 genotypes. The number of alleles amplified by the polymorphic TFGMS markers in these genotypes varied from 1 to 8 with an average of 3.5 alleles per marker (Fig. 2A).
The efficiency of 157 TFFDMS markers in the 141 TF genes was compared with that of 801 TFGMS markers to detect polymorphism in the same set of 96 genotypes (Supplementary Table S1). The TFFDMS markers in contrast to TFGMS markers detected the low level of polymorphism (29.3%, 46 markers) with 1–4 alleles per locus giving an average PIC of 0.39 (Supplementary Table S2). The intra- (26%) and inter- (31%) specific polymorphism detected by TFGMS and TFFDMS markers among the 96 genotypes gel-based assay are comparable with that estimated earlier using the normal unlabelled EST-derived genic microsatellite markers (25–30%),8,10 but lower than for unlabelled genomic (40–65%)41–43 microsatellite markers. The higher polymorphic potential of Class I TFGMS and TFFDMS markers (39.4%) when compared with the Class II markers (29.4%) reflected the correspondence between the length of microsatellite repeats and level of polymorphism as observed earlier in many plant species.2,5,44 The microsatellites with longer repeat motifs have a tendency to be more polymorphic due to their high length-dependent replication slippage.20 Besides, high polymorphic potential of TFGMS markers derived from the UTRs than that from the conserved ORF, which are constrained by more purifying selection,3,5,44 suggested the utility of TF genes having such repeat motifs as a source of polymorphic microsatellite markers in chickpea. Higher polymorphic potential of UTR-derived TFGMS markers is expected due to an abundance of non-triplet microsatellite repeat motifs (57.7%), i.e. polymorphic class of di- and tetra-nucleotide motifs in the UTRs that are more prone to replication slippage. Overall, the hypervariable Class I and UTR-derived microsatellite markers designed in this study from the TF genes provided a strategy for the rapid selection of more polymorphic markers from the huge marker database and thus would have greater utility for large-scale validation and efficient genotyping applications in chickpea.
The level of polymorphism detected by automated fragment analysis using 50 of each fluorescent dye-labelled TFGMS (39.7% polymorphism, PIC 0.53 and 1–8 alleles) and TFFDMS markers (34.3%, 0.43 and 1–6) was much higher than based on metaphor agarose gel with the normal unlabelled markers. However, the trend of polymorphism observed in Classes I and II fluorescent dye-labelled TFGMS and TFFDMS markers and desi and kabuli genotypes using the automated fragment analysis remained intact as obtained with the gel electrophoresis. The fluorescent dye-labelled TFGMS and TFFDMS markers overall detected 1–10 alleles (average 5 alleles) per marker locus (37.8% polymorphic, PIC 0.47), with a total of 196 alleles in 96 genotypes (Fig. 2B). The level of intra-specific polymorphism estimated above in desi and kabuli is comparable with the level reported previously with labelled EST-derived microsatellite markers (37%).7 With the use of automated fragment analyzer, all the allelic variants of TFGMS and TFFDMS markers could be captured efficiently that enabled to generate precise allele size-based genotyping information for 96 genotypes. The acquired genotypic information thus would enable multiplexing of genic TFGMS and TFFDMS markers and their utility in many large-scale and high-throughput genotyping applications in chickpea. Genetic analysis has been hindered in chickpea due to the lack of sufficient usable and robust sequence-based informative molecular markers and low intra-specific polymorphism specifically among desi and kabuli genotypes. Therefore, a large number of experimentally validated informative genic microsatellite markers with relatively high intra-specific polymorphic potential developed in our study would be useful in chickpea genetics, genomics and breeding. Moreover, the TF genes have utility in controlling diverse cellular processes, including plant growth, differentiation and developmental life cycles and environmental abiotic and biotic stress responses as well as domestication in plant species and legumes.16–18 These designed microsatellite markers, particularly being derived from the different functionally relevant sequence components of TF genes, thus could be useful as functional markers for rapidly establishing marker–trait linkages and identifying genes for many qualitative and quantitative traits of agricultural importance in chickpea.
For determining the molecular basis of TFGMS and TFFDMS fragment length polymorphism, the size variant amplicons of 24 each TFGMS and TFFDMS markers from the selected genotypes were cloned and sequenced. The high-quality sequence analysis revealed the presence of expected microsatellite repeat-motif sequences with conserved primer binding sites, but variable numbers of repeat units in the size variant amplicons. However, the fragment size variation of sequenced alleles corresponded exactly to the differences in the number of repeat units and the step-wise multiples of the number of repeat units as well (Fig. 2A). Such fragment length polymorphism due to expansion/contraction of microsatellite repeat units have been observed previously in rice,3,45 maize,46 chickpea,41,47 sugarcane3,5 and Brassica.44 Specifically, in a selected set of 12 Type I TFFDMS markers, the fragment length polymorphism among the genotypes was explained by variation in the number of microsatellite repeat units and corresponded exactly to the expansion/contraction and step-wise multiples of the number of microsatellite repeats within the functional domains of TF genes (Fig. 2A). The association of genic microsatellite markers with many traits, including diseases like neuronal disorders and cancers in humans, based on the expansion/contraction of the repeated tracts of microsatellite encoding amino acid residues in the functional domain of proteins, has been well demonstrated.1 It would be thus interesting to understand the functional relevance of such designed TFFDMS markers based on their repeat expansion/contraction in the functional domain regions of TF genes for trait association analysis in chickpea.
3.3. Physical mapping and genome coverage of TFGMS and TFFDMS markers in chickpea
One thousand one hundred and forty-three (90.1%) of the 1243 TFGMS and TFFDMS markers developed from the TF genes showing an unique significant hit were physically mapped on the eight chickpea chromosomes (Supplementary Fig. S1 and Supplementary Table S3), with average map density of 303.8 kb. Maximum markers were physically mapped on the chromosome 4 (174 markers, 15.2%), followed by the chromosomes 1 (165, 14.4%), 5 (164, 14.3%) and 7 (163, 14.2%) and least on the chromosome 8 (84, 7.3%). The average marker density was maximum in the chromosome 8 (84 markers, 196.2 kb), followed by the chromosomes 3 (148 markers, 270.2 kb) and 4 (174 markers, 282.7 kb) and minimum in the chromosome 2 (91 markers, 402.5 kb). A high-density 1143 TFGMS and TFFDMS marker-based physical map constructed in our study could be used as a reference for the rapid selection of genic microsatellite markers at genome-wide scale/chromosomal level. It would be thus useful for rapid targeted mapping of genes/QTLs for useful traits, mapping the whole genome and sequencing of gene rich regions of the genome and eventually for comparative genome mapping across legumes.
3.4. Understanding the population genetic structure and functional molecular diversity in chickpea
The population genetic structure among the 96 genotypes based on 310 TFGMS and TFFDMS markers and 96 genomic microsatellite markers27 distributed over eight chickpea chromosomes/LGs using STRUCTURE with varying levels of K (K = 2–10) with 20 replications was determined (Supplementary Fig. S2). It revealed that, at K = 5, all the genotypes were classified into five distinct sub-populations grouped under three major model-based genetically distinct wild (I), desi (II) and kabuli (III) population (Supplementary Fig. S2B). At this K-value (K = 5), the best replicate gave maximum log-likelihood values with a sharp peak. The genotypes were grouped into five sub-populations at K = 5 with a high-resolution population structure that corresponded well with their expected pedigree relationships and parentage. Based on the population genetic structure analysis, 96 genotypes used in the study were classified into five distinct sub-populations (Supplementary Fig. S2B and Supplementary Table S1): Groups I (four wild genotypes and two kabuli landraces), IIa (23 desi varieties/genetic stocks/breeding lines and five desi landraces), IIb (18 desi landraces and six desi varieties/genetic stocks/breeding lines), IIIa (15 kabuli varieties/genetic stocks/breeding lines) and IIIb (15 kabuli landraces, three kabuli varieties/genetic stocks/breeding lines and five desi landraces). The genetic diversity and phylogenetic relationships established by the genic markers in most of the selected desi, kabuli and wild genotypes were in accordance with the expectation based on pedigree relationships. This is also comparable with earlier documentation using the random48 and microsatellite43,49 markers and more recently employing a larger set of genome-wide SNP and InDel markers.24 The close evolutionary relationships of domesticated desi and kabuli with its wild progenitor C. reticulatum have already been reported by different morphological,50 cytological,51 biochemical52 and molecular studies.41,43,49–56 Therefore, the microsatellite markers developed from the TF genes might assay more relevant transcribed sequence components of the chickpea genome for establishing distinctness and assaying functional diversity among the genotypes and thus, would be useful in chickpea breeding, including variety identification and understanding the diversity pattern.
Population structure is also an indicator of genetic differentiation among population groups comprising of many genotypes. The molecular genetic variation among and within the five sub-populations (three desi, kabuli and wild populations) based on 310 polymorphic TFGMS and TFFDMS markers and 96 genomic microsatellite markers revealed a wider level of quantitative genetic differentiation (FST varied from 0.03 to 0.82 with an average of 0.53) among these population groups. This is higher than the previously detected level with the EST-derived (0.03–0.4910) and genomic (0.37–0.8041 and 0.32–0.8042) microsatellite markers. Among three population groups, the divergence was maximum between kabuli and wild (FST = 0.61) and minimum between desi and kabuli (0.29). The proportion of FST and thus diversity between population groups (53%) were higher when compared with that estimated within the population (36%), which is expected in a self-pollinated crop species like chickpea. Higher population genetic differentiation within desi (FST 0.39), in contrast to kabuli, (FST 0.30) agrees well with the earlier observations.43,49 The TFGMS and TFFDMS markers developed from the TF genes assaying variation largely in the expressed component of the genome might be directly correlated with phenotypic variation and thus would be of much relevance in the selection of desirable plant types in breeding programme. Henceforth, a wider genetic base and functional molecular diversity detected by the genic markers among desi and kabuli genotypes would be of significance in the perspective of varietal improvement in chickpea.
All the 96 genotypes clearly belonged to a single population in which ∼91.7% of their inferred ancestry was derived from one of the model-based population and remaining ∼8.3% contained admixed ancestry (Supplementary Fig. S2B). The existence of admix ancestry among five sub-populations (three population groups) reflected their complex breeding history involving inter-crossing and introgression among genotypes coupled with different strong adaptive selection pressure during domestication. This is expected because most of the desi and kabuli genotypes analysed in this study were developed through multiple-crosses, mostly three-way crosses among diverse selected germplasm accessions by the joint effort of International Crops Research Institute for the Semi-Arid Tropics (ICRISAT) and National Agricultural Research systems (NARS) for widening the genetic base and improving the stress tolerance. For instance, ICC12968/ICCV2, a short-duration kabuli chickpea variety showing an admixture of desi population groups has been developed from a multiple inter-cross involving five parental desi and kabuli genotypes [(K850 × GW-5/7) × P458] × (L550 × Guamuchil) for Fusarium wilt resistance and adaptation to short-duration environment of Southern and Central India.
Maximum admixtures obtained between desi and kabuli population groups (5%) supported well with the commonly accepted presumption that the large seed-size domesticated kabuli types originated from the small seed-size domesticated desi chickpea.53 About 3% admixed ancestry between wild C. reticulatum and desi population groups and their evolutionary closeness is thus expected due to the resemblance of seed morphology between desi and wild progenitor (C. reticulatum) of domesticated chickpea at the archaeological sites of South Eastern Turkey nearly ∼10 000 years ago.54–56 An admixed ancestry of ∼0.3% between kabuli and wild population groups indicated that domesticated kabuli possibly originated directly from the spontaneous mutants of wild C. reticulatum in ancient South Eastern Turkey with a separate independent evolutionary pathway as suggested by the earlier archeobotanical,57 mutant53 and microsatellite marker-based58 evolutionary studies involving wild and kabuli genotypes. A higher admixture between the desi and wild population when compared with that between the desi and kabuli population groups might be attributed to maximum adaptation-based selection pressure during the multiple domestication of pre-adapted desi and wild C. reticulatum followed by the punctuation of a series of four sequential evolutionary bottlenecks that have narrowed down the genetic base in cultivated chickpea.53,54,59,60 However, complete understanding about the genetic structure, domestication and evolutionary history of desi, kabuli and wild chickpea populations would require analysis of a greater number of contrasting genotypes belonging to each of these three population groups using high-throughput marker genotyping information.
3.5. Genetic association potential of TFGMS and TFFDMS markers
The microsatellite marker-based trait association mapping has proven to be an effective approach for dissecting the complex quantitative traits in many plant species, including legumes.61–64 Genetic association analysis was performed by correlating the genotyping data of 310 informative TFGMS and TFFDMS markers and 96 genomic microsatellite markers with the phenotypic information of three major seed and pod traits on the 96 association mapping panel. Higher phenotypic variation was observed in the case of 100-seed weight (5–70 g), pod number per plant (20–130) and seed number per plant (32–198) based on the multi-location replicated field data. The phenotypically and genotypically (based on population structure) diverse association mapping panels selected in our study is a structured population, thus having significance for seed and pod trait-specific association analysis in chickpea. The combined results of GLM and MLM in TASSEL identified 23 TFFDMS and 21 TFGMS markers in the 34 TF genes, showing a significant association with 100-seed weight, pod number per plant and seed number per plant at P-value of ≤0.05 and R2 from 0.18 to 0.37 (Supplementary Table S2). However, none of the 96 genomic microsatellite markers distributed over eight chickpea LGs/chromosomes (used as controls) exhibited any significant seed and pod trait-specific association. It reflects the robustness, including reliability and utility of genic microsatellite markers, identified in the TF genes for trait association analysis in chickpea. Ten TFFDMS and nine TFGMS markers in the 12 TF genes revealed association with all the three seed and pod traits, whereas 13 TFFDMS and 12 TFGMS markers in the 22 genes had association with a single trait only. The significant association of multiple microsatellite markers in more than one TF genes distributed over eight chickpea chromosomes with multiple seed and pod traits provides clues for the complex quantitative genetic inheritance pattern of traits65 under study. In spite of low polymorphic potential, particularly 23 TFFDMS markers in the 22 TF genes showed higher seed and pod trait-specific association potential (significant P ≤ 0.001 and R2 0.23–0.38) in chickpea genotypes when compared with that obtained using the 21 TFGMS markers (P 0.01–0.05 and R2 0.18–0.31) in the 12 genes. Based on these observations, it is possible that the varied trait association potential estimated for TFGMS and TFFDMS markers are due to their presence in different TF genes. Henceforth, for better understanding and comparing the potential of these two genic marker types in trait association analysis in chickpea, the five seed and pod trait-associated TF genes carrying both polymorphic nine TFGMS and five TFFDMS markers were analysed in detail (Table 1). The above similar trend depicting the higher efficiency of four TFFDMS markers in contrast to eight TFGMS markers in four TF genes for the seed and pod trait association in chickpea genotypes was observed (Table 1). Interestingly, the remaining one TFGMS marker (P < 0.0024 and R2 0.31) in domain of unknown function (DUF)1635 TF gene showed higher seed and pod trait association potential in contrast to one TFFDMS marker (P < 0.047 and R2 0.23) in the functional domain of similar gene (Table 1). This ascertains a strategy to select the target sequence components of genes that are functionally more relevant for developing genic microsatellite markers for rapid trait association analysis in chickpea. Several recent reports have documented the diverse trait association potential of functional marker loci developed from different coding and UTR sequence components of a gene like starch biosynthesis66 and grain size (GS367 and GS561) genes in rice. Therefore, the selections of suitable marker loci from the different sequence components of target genes are always crucial for evaluating the definite potential of genes for trait association mapping.
Table 1.
Functional significance of TFGMS and TFFDMS markers designed from the five TF genes showed association with seed and pod traits in chickpea
| TFs | Functional domains | TFGMS markers (NCBI PUIDs) | TFGMS repeat motifs | Association (P and R2 value) and differentially expressed (DE)/not differentially expressed (NDE) during seed development | TFFDMS markers (NCBI PUIDs) | TFFDMS repeat motifs | Association (P and R2 value) and differentially expressed (DE)/not differentially expressed (NDE) during seed development | SNP loci discovered | Sequenced gene amplicon size (bp) | Frequency (SNPs/bp) | Association (P and R2 value) | Associated seed and pod traits | Genetic position (cM) on the LGs |
|---|---|---|---|---|---|---|---|---|---|---|---|---|---|
| Teosinte branched 1/cycloidea/proliferating cell factors (TCP) | TCP | TFGMS5 (16 584 978) |
(TCTCAT)4 | <0.046 0.19 NDE |
TFFDMS15-Type-I (16 586 183) |
(TCT)5 | <0.0034 0.31 NDE |
A/T, G/A, T/A, C/A, G/T, T/C |
1850 | 1/308.3 | <0.0026 0.40 |
Pod number per plant | LG1 55.4 |
| Squamosa-promoter-binding protein (SBP) | SBP | TFGMS21 (16 584 994) |
(CTC)4 | <0.014 0.25 NDE |
TFFDMS21-Type-Ia (16 586 189) |
(CAC)8 | <0.0019 0.38 NDE |
C/T, T/A, C/T, G/C, C/T, A/T, G/A, G/A, C/T, A/C, G/A |
3000 | 1/272.7 | <0.0012 0.45 |
Seed size/100-seed weight | LG1 74.5 |
| No apical meristem-arabidopsis transcription activation factor-cup shaped cotyledon (NAC) | NAM | TFGMS12 (16 584 985) |
(AATCCA)5 | <0.037 0.22 NDE |
TFFDMS18-Type-Ia 16 586 186 |
(GAT)6 | <0.0059 0.33 NDE |
A/G, T/C, G/C, T/A, G/A |
1400 | 1/280 | <0.0054 0.38 |
Seed size/100-seed weight Pod number per plant Seed number per plant |
LG1 73.9 |
| TFGMS17 (16 584 990) |
(CAA)5 | <0.032 0.25 NDE |
|||||||||||
| TFGMS3 (16 584 976) |
(TAA)5 | <0.049 0.18 NDE |
|||||||||||
| Domain of unknown function (DUF1635) | DUF1635 | TFGMS18a (16 584 991) |
(CTA)6 | <0.0024 0.31 DE |
TFFDMS16-Type-I (16 586 184) |
(CAA)6 | <0.047 0.23 NDE |
A/G, C/T, C/G, A/T, C/T, T/G |
2000 | 1/333.3 | <0.0046 0.43 |
Seed size/100-seed weight | LG1 73.5 |
| TFGMS1 (16 584 974) |
(GAA)6 | <0.043 0.18 NDE |
|||||||||||
| TFGMS4 (16 584 977) |
(AGA)8 | <0.041 0.19 NDE |
|||||||||||
| Domain of unknown function (DUF702) | DUF702 | TFGMS13 (16 584 986) |
(ACA)4 | <0.028 0.23 NDE |
TFFDMS20-Type-Ia (16 586 188) |
(ATA)5 | <0.0062 0.35 NDE |
C/T, G/A, A/C, G/C |
1100 | 1/275 | <0.0058 0.41 |
Seed size/100-seed weight Seed number per plant |
LG1 75.2 |
aValidated through traditional bi-parental genetic mapping.
The detail structural and functional annotation of five seed and pod trait-associated TFs were performed to identify their downstream structural gene targets in chickpea. Using the AGRIS regulatory network database (AtRegNet, http://arabidopsis.med.ohio-state.edu), the direct interactions of three seed and pod trait-associated chickpea TF genes [Teosinte branched 1/cycloidea/proliferating cell factors (TCP) squamosa-promoter-binding protein (SBP) and DUF702] with MCM1-agamous-deficiens-serum response factor (MADS) TFs, including SEPALLATA3 and AGL15, that are conserved in Arabidopsis were clearly evident. Among all MADS TF genes, the role of AGL15 has already been experimentally validated in controlling the downstream targets (LEAFY COTYLEDON2, FUSCA3 and ABA INSENSITIVE3) encoding B3 domain TFs, which are the key regulators of embryogenesis during seed development in Arabidopsis.18,68,69
3.6. Intra-specific functional transcript map of chickpea
For the construction of intra-specific genetic linkage map (transcript map), 74 TFMS and 22 FDMS markers one in each 96 TF genes and 32 previously reported genomic microsatellite markers27 showing parental polymorphism between desi (ICCX-810800) and kabuli (ICC20268) were genotyped among 94 individuals of a F3 mapping population. The linkage analysis of marker genotyping data mapped a total of 96 TFMS and FDMS marker loci carrying TF genes and 32 genomic microsatellite markers onto the eight LGs (CaLG1 to CaLG8, haploid chromosome numbers) of chickpea (Supplementary Fig. S3). The LGs were designated and numbered accordingly with Arabic numerals (LG1 to LG8) based on the common parental polymorphic 32 genomic microsatellite marker positions and groupings that shared between corresponding eight LGs as reported by previous studies.6–8,27,42,70 The transcript map constructed for eight LGs spanned a total map length of 782.8 cM with an average inter-marker distance of 6.12 cM (Supplementary Table S4). Based on genetic distance, the chromosome 8 showed shortest LG spanning of 78.7 cM, while the chromosome 1 had the longest LG with map length of 121.7 cM. The average inter-marker distance was maximum for chromosome 7 (6.75 cM), followed by chromosome 3 (6.67 cM), and minimum for chromosome 1 (5.07 cM). The average inter-marker distance estimated for the transcript map was comparable with that reported for previously constructed (1.77–8.01 cM) intra- and inter-specific genetic linkage maps of chickpea using a large number of genic and genomic microsatellite markers and a smaller set of SNP markers.6–8,42,70 The TFMS and FDMS markers carrying TF genes mapped genetically on the intra-specific transcript map would expedite large-scale genotyping applications, including the construction of high-density comparative genetic linkage (transcript) map and identification/mapping of genes/QTLs for important agronomic traits in chickpea.
3.7. Validation of trait-associated TF genes through genetic mapping
The traditional bi-parental genetic mapping in a 96 F3 mapping population (ICCX-810800 × ICC20268) contrasting for seed weight (100-seed weight varied from 5.4 to 49.6 g) using the 96 informative TFGMS and TFFDMS markers and 32 genomic microsatellite markers was performed. An ANOVA revealed a significant difference of 100-seed weight (5.4–49.6 g) between the parental desi and kabuli genotypes and among segregating individuals. The frequency distribution of 100-seed weight (g) among 96 segregating individuals of a F3 mapping population depicted a goodness of fit to the normal distribution (Supplementary Fig. S4), and the phenotypic trait values of two parental genotypes also lied within the range that estimated for the entire mapping population. It thus indicated the quantitative inheritance pattern of seed traits under study in the developed mapping population and its utility in seed weight trait-specific bi-parental linkage mapping. The genetic mapping identified and mapped one major and significant (LOD threshold score >3.7) QTL region (phenotypic effect variance/R2 = 30.7%) on the chickpea LG1 governing the 100-seed weight/size (Supplementary Fig. S5). The target 1.7-cM QTL region (73.5–75.2 cM) identified for seed weight based on both interval mapping and composite interval mapping spanned with three TFFDMS and one TFGMS markers, thus having high seed weight trait-specific association potential in desi and kabuli based on genetic association mapping. Therefore, the four seed weight trait-specific TFFDMS and TFGMS markers in the ORF and 5′ UTRs of TF genes validated both by traditional bi-parental linkage mapping and association mapping were selected further as the target candidate genes for controlling seed weight/size in desi and kabuli.
3.8. Differential expression profiling and functional significance of TFGMS and TFFDMS markers
To derive correlation between association analysis and differential expression profiling, the seed and pod trait-specific 23 TFFDMS and 21 TFGMS markers associated 34 TF genes were validated in two different seed developmental stages of two contrasting small and large seed-size chickpea genotypes namely, ICCX-810800 and ICC20268 through semi-quantitative and quantitative RT-PCR. None of the TFFDMS and seven (33.3%) of the 21 TFGMS markers associated seven TF genes revealed differential expression during seed development in two contrasting chickpea genotypes by both semi-quantitative and quantitative RT-PCR. When we compared the differential expression pattern of both seed and pod trait-specific five TFFDMS and nine TFGMS markers associated five TF genes, none of the TFFDMS markers in these genes showed differential expression in seed developmental stages of two contrasting genotypes (Table 1). In contrast, differential expression for one of the TFGMS marker associated TF gene during seed development in two contrasting small and large seed-size genotypes was observed (Table 1). For instance, the TFFDMS marker containing (CAC)8 repeat motif in the SBP functional domain of a high 100-seed weight-associated (R2 0.38 and P < 0.0019) TF gene namely, SBP, did not show differential regulation in seed developmental stages of ICCX-810800 and ICC20268 (Supplementary Fig. S6A). In contrast, the TFGMS marker containing (CTA)6 repeat motif in the 5′ UTR of seed weight/size-associated (R2 0.31 and P < 0.0024) DUF1635 TF gene revealed down-regulated expression (at least 3.5 times) specifically in seed developmental stages of a large seed-size kabuli genotype ICC20268 (Supplementary Fig. S6B and D). While in two seed developmental stages of a small seed-size desi genotype ICCX-810800, such TFGMS marker associated TF gene showed almost an equal level of expression. The higher association potential of TFGMS marker in the 5′ UTR of the TF gene and their further correlation with differential down-regulated pattern of gene expression during seed development in two contrasting small and large seed-size genotypes suggested the functional relevance of such identified microsatellite markers in the TF genes for trait association in chickpea.
The sequencing of cloned cDNA and genomic DNA amplicons from the seed and pod trait-associated five TF genes in ICCX-810800 and ICC20268 revealed the presence of expected microsatellite repeat-motif sequences. Interestingly, the amplicon sequences from the five TFFDMS markers associated five TF genes that did not show differential expression during seed development contained the variable number of microsatellite repeat units in the functional domains of these genes between ICCX-810800 and ICC20268. The amplicon sequences from the TFGMS markers of TF genes that did not show differential expression during seed development, including the one which revealed differential expression, contained varied microsatellite repeats between ICCX-810800 and ICC20268. The sequencing of amplicons from the TFFDMS marker of 100-seed weight-associated SBP TF gene contained the desired (CAC)8 repeat motif in the transcripts of ICCX-810800 as in ICC4958 from which the primers were designed (Supplementary Fig. S7A). Interestingly, the cDNA sequence alignment of such TFFDMS marker associated SBP TF gene between ICCX-810800 and ICC20268 showed the presence of variable number of repeat units like (CAC)8 and (CAC)10 in the SBP functional domain, respectively (Supplementary Fig. S7A). The comparison between cDNA and genomic DNA sequences from the 100-seed weight associated and differentially expressed TFGMS marker associated DUF1635 TF gene revealed the variable number of microsatellite repeats (CTA)6 and (CTA)8 between ICCX-810800 and ICC20268, respectively (Supplementary Fig. S8). The expansion and contraction of microsatellite repeats in the 5′ UTRs of genes have significance in regulating gene expression for many traits including amylose content in rice,71 quality protein in maize72 and light and salicylic responses in Brassica.73 These findings thus inferred the significant correlation between the number of microsatellite repeat units in the different sequence components (functional domain and 5′ UTR) of seed weight/size trait-specific TFFDMS and TFGMS associated TF genes and their differential expression in the genes preferentially with regard to seed development in contrasting chickpea genotypes. Understanding the adaptive and evolutionary significance of such TFFDMS and TFGMS repeat expansion/contraction in the functional domain and 5′ UTRs of TF genes, respectively, is of relevance that needs further systematic experimentation by assaying a large number of contrasting chickpea genotypes of different tissues and/or stages (embryogenesis to maturation) of seed development.
To further understand the functional significance of TFFDMS markers associated TF genes that are not showing differential expression during seed development, the high seed and pod trait-associated four TFFDMS markers showing fragment length polymorphism in the functional domains of four TF genes were selected (Table 1). The alteration of secondary protein structure and functional domain sites between the variant and native forms due to the presence of variable number of TFFDMS repeat units encoding the amino acid residues in the functional domains of four seed and pod trait-associated TF genes was observed (Supplementary Fig. S6B). For instance, the expansion of TFFDMS repeat motif from (CAC)8 in desi variety ICCX-810800 to (CAC)10 in kabuli variety ICC20268 encoding histidine amino acid residues in the DNA-binding functional domain of SBP TF gene created an altered secondary structure of protein (Supplementary Fig. S7B) and functional domain region that possibly affects the DNA binding and transcriptional activity of the target gene during developmental stages in chickpea. The altered transcriptional activity of SBP TF gene could be due to its differential sequence-specific DNA binding of all eight conserved cysteine/histidine amino acid residues (formed two separate novel zinc-binding sites) present in the DNA-binding domain with the recognition domains of promoter(s) of target gene(s).74 Differential DNA-binding selectivity of SBP TF towards consensus box in the target gene promoter due to alteration of conserved cysteine/histidine amino acid residues within the DNA-binding functional domain and their correlation with transcriptional activity during developmental process have been previously reported in many plant species, including Antirrhinum,75,76 Arabidopsis,77 rice78,79 and tomato.80 Overall, the correspondence of higher trait association potential of TFFDMS markers with fragment length polymorphism due to the presence of variable number of TFFDMS repeat units encoding amino acid residues in the functional domain of TF genes and alteration of secondary structure of proteins and functional domain sites suggested the utility of these functional genetic markers for rapidly establishing marker–trait linkages and identifying genes/QTLs for many useful agronomic traits in chickpea.
3.9. Gene-specific LD patterns in chickpea
Understanding the gene-specific LD pattern is of significance to determine the marker density required for association mapping of complex traits in a target plant population under study.81,82 For determining gene-specific LD estimates and extent of LD decay, the 32 SNP loci were identified in five seed and pod trait-associated TF genes among 96 chickpea genotypes based on cloned amplicon sequencing with an average SNP frequency of 1/297 bp. The nucleotide diversity (mean π = 4.7 × 10⁻³ bp) and frequency of Watterson's θ level (mean θ = 2.3 × 10⁻³) estimated for 32 SNP loci in the TF genes varied widely across the genotypes. Higher nucleotide diversity of the SNP loci within desi (−0.44) when compared with that of kabuli (−0.39) was evident from the test of Tajima's D neutrality pattern of nucleotide polymorphism. The haplotype analysis using the SNPs, TFGMS and TFFDMS marker genotyping data identified 10–21 haplotypes per gene amplicon resulting in higher haplotype-based PIC values among the genotypes that varied from 0.53 to 0.97 with an average of 0.74. The candidate gene-based association analysis by the inclusion of SNP and microsatellite marker-based haplotypes identified in the five TF genes revealed a strong association of these genes with the seed and pod traits studied at significant P ≤ 0.001 and R2 from 0.38 to 0.45 (Table 1). The genetic association potential of TF genes estimated combining the SNP, TFGMS and TFFDMS marker-based haplotypes was much higher than that obtained using the individual TFGMS, TFFDMS and SNP markers (Table 1). The LD estimates (r2) and extent of LD decay using the all possible pair-combinations of marker haplotypes were determined within the seed and pod trait-associated five TF genes. In desi and kabuli population groups, an LD did not decay below r2 = 0.1 within the 700-bp sequenced region of all the five TF genes (Supplementary Fig. S9). However, an overall decreasing trend of LD decay in the genes with an increase in the sequenced region (bp) was observed. It indicated the direct correlation of LD patterning with physical linkage of markers on chromosomes and marker density required in these genes. The diverse desi population groups showed faster LD decay than that of kabuli in all the seed and pod trait-associated five TF genes. In spite of inclusion of higher number of combined SNP and microsatellite haplotypes, the varied LD decay observed in other four TF genes (TCP, NAC, DUF1635 and DUF702) indicates the effect of factors other than marker density like genetic diversity, population genetic structure, population admixture and adaptive selection on shaping the LD patterns in these genes. Remarkably, the overall trend of LD decay was directly correlated with association potential of five TF genes for seed and pod traits in chickpea. The genes showing a low degree of association potential decayed LD much faster/earlier with an increase in the sequenced region (bp) when compared with the genes having higher association potential (Supplementary Fig. S9). These observations broadly suggested that, with the inclusion of additional SNP loci identified in the TF genes and their corresponding two TFGMS and three TFFDMS marker alleles, a higher number of haplotype pairs could be produced which in turn enhanced the LD resolution and trait association potential of the genes.
The SBP TF gene showing a strong genetic association with 100-seed weight/size did not decay its LD even across the 1000-bp sequenced region of desi and kabuli population. In 3000-bp sequenced amplicon of this TF gene (covering the ORF region), we identified the combinations of 11 synonymous SNP loci, 2 different alleles of TFGMS and 3 different alleles of TFFDMS polymorphic marker loci (Fig. 3A) across 96 chickpea genotypes that enabled to constitute a maximum of 21 haplotypes in this gene (Fig. 3B). The haplotype pair-based LD estimation displayed a significant LD, which persists at a high level (r2 > 0.15 and P < 0.0001) across the entire 3000-bp sequenced region of this gene (Fig. 3C). The feature of high LD estimates covering the complete ORF of such TF gene thus increased its overall potential for seed trait (100-seed weight/size) association (R2 0.45 and P < 0.0012) in chickpea (Table 1). Such microsatellite–SNP marker haplotype-based trait association analysis has already been implemented successfully for identification of genes/QTLs associated with infectious diseases in humans83 and seed shattering during rice domestication.84 Overall, these results suggested that the population genetic structure and marker density in the genes play a crucial role in LD patterning of TFs at the gene level in domesticated desi and kabuli.
Figure 3.

The genotyping of 13 polymorphic marker loci [11 and 1 single nucleotide polymorphisms (SNPs) of each TFFDMS and TFGMS markers] identified in different ORF and UTR sequence components of a high seed-size/weight-associated SBP TF gene (A) among 96 association mapping panel constituted 2 haplotypes in wild, 13 haplotypes in desi and 6 haplotypes in kabuli (B). The 21 haplotype marker-based genotyping information produced high LD estimates (r2 > 0.15 and P < 0.0001) covering the complete 3000-bp sequenced region of SBP TF gene (C) and thus enhanced its overall LD resolution. The specific haplotypes showing differentiation between small (ICCX-810800) and large (ICC20268) seed-size contrasting chickpea genotypes (B) were represented more in the 96 association mapping panel, which reemphasizes the strong potential of SBP TF for seed-size/weight-specific trait association.
3.10. Possible haplotype-based evolutionary history of SBP TF genes during chickpea domestication
The determination of step-wise haplotype sharing/changes in the genes among cultivated and wild species will have significance in understanding the evolutionary process of domestication of those target genes from ancestors to cultivated species. A set of 21 TFGMS–TFFDMS–SNP marker haplotypes identified in a high seed weight-associated SBP TF gene among desi, kabuli and wild population groups gave clues to study the hypothetical evolutionary history of SBP gene during chickpea domestication. It implied that three SNPs (mutations) and two microsatellite repeat expansion (constituting two haplotypes) in wild, two SNPs, three microsatellite repeat expansion/contraction and three recombination events among nine SNPs (13 haplotypes) in desi, and four SNPs and two microsatellite repeat expansion (six haplotypes) in kabuli, were adequate to explain the natural variation of SBP TF gene in chickpea (Fig. 3 and Supplementary Fig. S10). It also implied that the seed weight/size-associated TFFDMS alleles might be fixed in the SBP gene haplotypes of domesticated desi and kabuli chickpea as pre-existing natural variation from wild C. reticulatum. The seed weight/size-associated haplotypes, including the TFFDMS alleles, that differentiated the contrasting small seed-size desi from large seed-size kabuli based on the variation of TFFDMS repeats in the functional domain of SBP gene was represented mostly (89) among 96 genotypes under study. This ascertained the higher association potential of SBP TF gene for seed weight/size in chickpea. Maximum sharing of desi particularly the seed weight-associated contrasting small seed-size ICCX-810800-specific haplotypes (21) and TFFDMS alleles (16) with wild C. reticulatum was evident (Supplementary Fig. S10). It is supported well with the earlier reports on the resemblance and evolutionary closeness of small seed-size morphology between desi and wild C. reticulatum. In contrast, the sharing of kabuli particularly the seed weight/size-associated contrasting large seed-size ICC20268-specific haplotypes (16) and TFFDMS alleles (14) was more with desi when compared to that with wild. It gave clues that the divergence between kabuli and desi is much recent when compared with that between desi and wild progenitor C. reticulatum.
The occurrence of nucleotide polymorphisms, seed weight/size-associated TFFDMS repeat expansion/contraction and recombination events in the haplotypes of SBP gene among desi, kabuli and wild reflected that the strong artificial selection has played a major role during domestication of this gene towards assortment of more preferential seed weight/size traits in chickpea. This is in agreement with earlier archeological, phenotypic and molecular phylogeny studies53,54,59,60 that describe that the chickpea domestication (∼10 000 years) might have led through population bottlenecks during their evolutionary transition from wild C. reticulatum by the occurrence of spontaneous mutation, recombination and fixation. Such newly occurring changes would have become fixed through propagation in cultivated chickpea, which is self-pollinated in nature. The higher microsatellite expansion/contraction of seed weight/size-associated TFFDMS alleles and recombination among SNPs within the haplotypes of SBP TF gene attributed to more seed weight/size-specific haplotype diversity in desi in contrast to kabuli. It could have resulted from artificial selection and modern breeding efforts (inter-specific hybridization/introgression of small seed-size desi with large seed-size kabuli) continuously practiced during the genetic improvement of desi for different seed-size characteristics particularly for a large seed-size trait, which is of a high consumer preference and trade value. The molecular marker-based haplotyping in the SBP TF gene overall gave clues to understand the possible evolutionary pathway of the target gene in domesticated desi, kabuli and wild chickpea and the consequence of their natural variations on seed-size/weight-specific trait evolution during chickpea domestication. Therefore, the seed-size/weight supposed to represent an important component of domestication trait in chickpea. However, the complete understanding of evolutionary history of such seed-size/weight-associated SBP TF gene during chickpea domestication needs further systematic experimentation by assaying high-throughput marker genotyping information in a larger set of contrasting genotypes at the genome and gene level.
4. Conclusions
A larger set of experimentally validated TFGMS and TFFDMS markers with relatively high intra-specific polymorphic potential developed from the TF genes will have immense use in large-scale genotyping applications, including construction of high-density physical and functional transcript map as well as understanding the population genetic structure and functional molecular diversity in chickpea. The functional relevance of these informative genic markers was demonstrated by integrating seed and pod trait association analysis with genetic mapping, differential expression profiling, protein modelling and haplotype gene evolution study in relation to selected five TF genes, thereby suggesting the utility of markers in many aspects of chickpea breeding and genetic analysis.
Supplementary data
Supplementary Data are available at www.dnaresearch.oxfordjournals.org.
Acknowledgements
The authors gratefully acknowledge the financial support by the Department of Biotechnology (DBT), Government of India. We thank the DNA Sequencing Facility, NIPGR for automated fragment analysis and sequencing. Ms Alice Kujur acknowledges the Council of Scientific and Industrial Research (CSIR) for the award of Junior Research Fellowship (JRF).
Footnotes
Edited by Dr Satoshi Tabata
References
- 1.Li Y.C., Korol A.B., Fahima T., Nevo E. Microsatellites within genes: structure, function, and evolution. Mol. Biol. Evol. 2004;21:991–1007. doi: 10.1093/molbev/msh073. doi:10.1093/molbev/msh073. [DOI] [PubMed] [Google Scholar]
- 2.Varshney R.K., Graner A., Sorrells M.E. Genic microsatellite markers in plants: features and applications. Trends Biotechnol. 2005;23:48–55. doi: 10.1016/j.tibtech.2004.11.005. doi:10.1016/j.tibtech.2004.11.005. [DOI] [PubMed] [Google Scholar]
- 3.Parida S.K., Dalal V., Singh N.K., Mohapatra T. Genic non-coding microsatellites in the rice genome: characterization, marker design and use in assessing genetic and evolutionary relationships among domesticated groups. BMC Genomics. 2009;10:140. doi: 10.1186/1471-2164-10-140. doi:10.1186/1471-2164-10-140. [DOI] [PMC free article] [PubMed] [Google Scholar]
- 4.Parida S.K., Raj Kumar K.A., Dalal V., Singh N.K., Mohapatra T. Unigene derived microsatellite markers for the cereal genomes. Theor. Appl. Genet. 2006;112:808–17. doi: 10.1007/s00122-005-0182-1. doi:10.1007/s00122-005-0182-1. [DOI] [PubMed] [Google Scholar]
- 5.Parida S.K., Pandit A., Gaikwad K., et al. Functionally relevant microsatellites in sugarcane unigenes. BMC Plant Biol. 2010;10:251. doi: 10.1186/1471-2229-10-251. doi:10.1186/1471-2229-10-251. [DOI] [PMC free article] [PubMed] [Google Scholar]
- 6.Nayak S.N., Zhu H., Varghese N., et al. Integration of novel SSR and gene-based SNP marker loci in the chickpea genetic map and establishment of new anchor points with Medicago truncatula genome. Theor. Appl. Genet. 2010;120:1415–41. doi: 10.1007/s00122-010-1265-1. doi:10.1007/s00122-010-1265-1. [DOI] [PMC free article] [PubMed] [Google Scholar]
- 7.Gujaria N., Kumar A., Dauthal P., et al. Development and use of genic molecular markers (GMMs) for construction of a transcript map of chickpea (Cicer arietinum L.) Theor. Appl. Genet. 2011;122:1577–89. doi: 10.1007/s00122-011-1556-1. doi:10.1007/s00122-011-1556-1. [DOI] [PMC free article] [PubMed] [Google Scholar]
- 8.Choudhary S., Gaur R., Gupta S. EST-derived genic molecular markers: development and utilization for generating an advanced transcript map of chickpea. Theor. Appl. Genet. 2012;124:1449–62. doi: 10.1007/s00122-012-1800-3. doi:10.1007/s00122-012-1800-3. [DOI] [PubMed] [Google Scholar]
- 9.Varshney R.K., Close T.J., Singh N.K., Hoisington D.A., Cook D.R. Orphan legume crops enter the genomics era. Curr. Opin. Plant Biol. 2009;12:202–10. doi: 10.1016/j.pbi.2008.12.004. doi:10.1016/j.pbi.2008.12.004. [DOI] [PubMed] [Google Scholar]
- 10.Choudhary S., Sethy N.K., Shokeen B., Bhatia S. Development of chickpea EST-SSR markers and analysis of allelic variation across related species. Theor. Appl. Genet. 2009;118:591–608. doi: 10.1007/s00122-008-0923-z. doi:10.1007/s00122-008-0923-z. [DOI] [PubMed] [Google Scholar]
- 11.Garg R., Patel R.K., Tyagi A.K., Jain M. De novo assembly of chickpea transcriptome using short reads for gene discovery and marker identification. DNA Res. 2011;18:53–63. doi: 10.1093/dnares/dsq028. doi:10.1093/dnares/dsq028. [DOI] [PMC free article] [PubMed] [Google Scholar]
- 12.Garg R., Patel R.K., Jhanwar S., et al. Gene discovery and tissue-specific transcriptome analysis in chickpea with massively parallel pyrosequencing and web resource development. Plant Physiol. 2011b;156:1661–78. doi: 10.1104/pp.111.178616. doi:10.1104/pp.111.178616. [DOI] [PMC free article] [PubMed] [Google Scholar]
- 13.Hiremath P.J., Farmer A., Cannon S.B., et al. Large-scale transcriptome analysis in chickpea (Cicer arietinum L.), an orphan legume crop of the semi-arid tropics of Asia and Africa. Plant Biotechnol. J. 2011;9:922–31. doi: 10.1111/j.1467-7652.2011.00625.x. doi:10.1111/j.1467-7652.2011.00625.x. [DOI] [PMC free article] [PubMed] [Google Scholar]
- 14.Jhanwar S., Priya P., Garg R., Parida S.K., Tyagi A.K., Jain M. Transcriptome sequencing of wild chickpea as a rich resource for marker development. Plant Biotechnol. J. 2012;10:690–702. doi: 10.1111/j.1467-7652.2012.00712.x. doi:10.1111/j.1467-7652.2012.00712.x. [DOI] [PubMed] [Google Scholar]
- 15.Century K., Reuber T.L., Ratcliffe O.J. Regulating the regulators: the future prospects for transcription-factor-based agricultural biotechnology products. Plant Physiol. 2008;147:20–9. doi: 10.1104/pp.108.117887. doi:10.1104/pp.108.117887. [DOI] [PMC free article] [PubMed] [Google Scholar]
- 16.Libault M., Joshi T., Benedito V.A., Xu D., Udvardi M.K., Stacey G. Legume transcription factor genes: what makes legumes so special? Plant Physiol. 2009;151:991–1001. doi: 10.1104/pp.109.144105. doi:10.1104/pp.109.144105. [DOI] [PMC free article] [PubMed] [Google Scholar]
- 17.Udvardi M.K., Kakar K., Wandrey M., et al. Legume transcription factors: global regulators of plant development and response to the environment. Plant Physiol. 2007;144:538–49. doi: 10.1104/pp.107.098061. doi:10.1104/pp.107.098061. [DOI] [PMC free article] [PubMed] [Google Scholar]
- 18.Agarwal P., Kapoor S., Tyagi A.K. Transcription factors regulating the progression of monocot and dicot seed development. Bioessays. 2011;33:189–202. doi: 10.1002/bies.201000107. doi:10.1002/bies.201000107. [DOI] [PubMed] [Google Scholar]
- 19.Yu J.K., Paik H., Choi J.P., Han J.H., Choe J.K., Hur C.G. Functional domain marker (FDM): an in silico demonstration in Solanaceae using simple sequence repeats (SSRs) Plant Mol. Biol. Rep. 2010;28:352–6. doi:10.1007/s11105-009-0154-8. [Google Scholar]
- 20.Temnykh S., DeClerck G., Lukashova A., Lipovich L., Cartinhour S., McCouch S. Computational and experimental analysis of microsatellites in rice (Oryza sativa L.): frequency, length-variation, transposon associations and genetic marker potential. Genome Res. 2001;11:1441–52. doi: 10.1101/gr.184001. doi:10.1101/gr.184001. [DOI] [PMC free article] [PubMed] [Google Scholar]
- 21.Yilmaz A., Mejia-Guerra M.K., Kurz K., Liang X., Welch L., Grotewold E. AGRIS: the Arabidopsis gene regulatory information server, an update. Nucleic Acids Res. 2011;39:D1118–22. doi: 10.1093/nar/gkq1120. doi:10.1093/nar/gkq1120. [DOI] [PMC free article] [PubMed] [Google Scholar]
- 22.Mochida K., Yoshida T., Sakurai T., Yamaguchi-Shinozaki K., Shinozaki K., Tran L.S. LegumeTFDB: an integrative database of Glycine max, Lotus japonicus and Medicago truncatula transcription factors. Bioinformatics. 2010;26:290–1. doi: 10.1093/bioinformatics/btp645. doi:10.1093/bioinformatics/btp645. [DOI] [PubMed] [Google Scholar]
- 23.Singh N.K., Gupta D.K., Jayaswal P.K., et al. The first draft of the pigeonpea genome sequence. J. Plant Biochem. Biotechnol. 2011;21:98–112. doi: 10.1007/s13562-011-0088-8. doi:10.1007/s13562-011-0088-8. [DOI] [PMC free article] [PubMed] [Google Scholar]
- 24.Varshney R.K., Song C., Saxena R.K., et al. Draft genome sequence of chickpea (Cicer arietinum) provides a resource for trait improvement. Nat Biotechnol. 2013;31:240–46. doi: 10.1038/nbt.2491. [DOI] [PubMed] [Google Scholar]
- 25.Voorrips R.E. MapChart: software for the graphical presentation of linkage maps and QTLs. J. Hered. 2002;93:77–8. doi: 10.1093/jhered/93.1.77. doi:10.1093/jhered/93.1.77. [DOI] [PubMed] [Google Scholar]
- 26.Liu K., Muse S.V. PowerMarker: an integrated analysis environment for genetic marker analysis. Bioinformatics. 2005;21:2128–9. doi: 10.1093/bioinformatics/bti282. doi:10.1093/bioinformatics/bti282. [DOI] [PubMed] [Google Scholar]
- 27.Winter P., Pfaff T., Udupa S.M., et al. Characterization and mapping of sequence-tagged microsatellite sites in the chickpea (Cicer arietinum L.) genome. Mol. Gen. Genet. 1999;262:90–101. doi: 10.1007/s004380051063. doi:10.1007/s004380051063. [DOI] [PubMed] [Google Scholar]
- 28.Pritchard J.K., Stephens M., Donnelly P. Inference of population structure using multilocus genotype data. Genetics. 2000;155:945–59. doi: 10.1093/genetics/155.2.945. [DOI] [PMC free article] [PubMed] [Google Scholar]
- 29.Bradbury P.J., Zhang Z., Kroon D.E., Casstevens T.M., Ramdoss Y., Buckler E.S. TASSEL: software for association mapping of complex traits in diverse samples. Bioinformatics. 2007;23:2633–5. doi: 10.1093/bioinformatics/btm308. doi:10.1093/bioinformatics/btm308. [DOI] [PubMed] [Google Scholar]
- 30.Hardy O.J., Vekemans X. Spagedi: a versatile computer program to analyze spatial genetic structure at the individual or population levels. Mol. Ecol. Notes. 2002;2:618–20. doi:10.1046/j.1471-8286.2002.00305.x. [Google Scholar]
- 31.Van Ooijen J.W. MapQTL 6: Software for the Mapping of Quantitative Trait Loci in Experimental Populations of Diploid Species. Netherlands: B. V. Kyazma Wageningen; 2009. [Google Scholar]
- 32.Garg R., Sahoo A., Tyagi A.K., Jain M. Validation of internal control genes for quantitative gene expression studies in chickpea (Cicer arietinum L.) Biochem. Biophys. Res. Commun. 2010;396:283–8. doi: 10.1016/j.bbrc.2010.04.079. doi:10.1016/j.bbrc.2010.04.079. [DOI] [PubMed] [Google Scholar]
- 33.Ramachandran G.N., Ramakrishnan C., Sasisekharan V. Stereochemistry of polypeptide chain configurations. J. Mol. Biol. 1963;7:95–9. doi: 10.1016/s0022-2836(63)80023-6. doi:10.1016/S0022-2836(63)80023-6. [DOI] [PubMed] [Google Scholar]
- 34.Tamura K., Peterson D., Peterson N., Stecher G., Nei M., Kumar S. MEGA5: molecular evolutionary genetics analysis using maximum likelihood, evolutionary distance, and maximum parsimony methods. Mol. Biol. Evol. 2011;28:2731–9. doi: 10.1093/molbev/msr121. doi:10.1093/molbev/msr121. [DOI] [PMC free article] [PubMed] [Google Scholar]
- 35.Librado P., Rozas J. DnaSP v5: a software for comprehensive analysis of DNA polymorphism data. Bioinformatics. 2009;25:1451–2. doi: 10.1093/bioinformatics/btp187. doi:10.1093/bioinformatics/btp187. [DOI] [PubMed] [Google Scholar]
- 36.Nei M. Molecular Evolutionary Genetics. New York: Columbia University Press; 1987. [Google Scholar]
- 37.Watterson G.A. On the number of segregating sites in genetical models without recombination. Theor. Popul. Biol. 1975;7:256–76. doi: 10.1016/0040-5809(75)90020-9. doi:10.1016/0040-5809(75)90020-9. [DOI] [PubMed] [Google Scholar]
- 38.Tajima F. Statistical-method for testing the neutral mutation hypothesis by DNA polymorphism. Genetics. 1989;123:585–95. doi: 10.1093/genetics/123.3.585. [DOI] [PMC free article] [PubMed] [Google Scholar]
- 39.Mather K.A., Caicedo A.L., Polato N.R., Olsen K.M., McCouch S., Purugganan M.D. Extent of linkage disequilibrium in rice (Oryza sativa L.) Genetics. 2007;177:2223–32. doi: 10.1534/genetics.107.079616. doi:10.1534/genetics.107.079616. [DOI] [PMC free article] [PubMed] [Google Scholar]
- 40.Yan W.G., Li Y., Agrama H.A., et al. Association mapping of stigma and spikelet characteristics in rice (Oryza sativa L.) Mol. Breed. 2009;24:277–92. doi: 10.1007/s11032-009-9290-y. doi:10.1007/s11032-009-9290-y. [DOI] [PMC free article] [PubMed] [Google Scholar]
- 41.Sethy N.K., Shokeen B., Edwards K.J., Bhatia S. Development of microsatellite markers and analysis of intra-specific genetic variability in chickpea (Cicer arietinum L.) Theor. Appl. Genet. 2006;112:1416–28. doi: 10.1007/s00122-006-0243-0. doi:10.1007/s00122-006-0243-0. [DOI] [PubMed] [Google Scholar]
- 42.Gaur R., Sethy N.K., Choudhary S., Shokeen B., Gupta V., Bhatia S. Advancing the STMS genomic resources for defining new locations on the intra-specific genetic linkage map of chickpea (Cicer arietinum L.) BMC Genomics. 2011;12:117. doi: 10.1186/1471-2164-12-117. doi:10.1186/1471-2164-12-117. [DOI] [PMC free article] [PubMed] [Google Scholar]
- 43.Bharadwaj C., Srivastava R., Chauhan S.K., et al. Molecular diversity and phylogeny in geographical collection of chickpea (Cicer sp.) accessions. J. Genet. 2011;90:e94–e100. [PubMed] [Google Scholar]
- 44.Parida S.K., Yadava D.K., Mohapatra T. Microsatellites in Brassica unigenes: relative abundance, marker design and use in comparative physical mapping and genome analysis. Genome. 2010;53:55–67. doi: 10.1139/g09-084. doi:10.1139/G09-084. [DOI] [PubMed] [Google Scholar]
- 45.Cho Y.G., Ishii T., Temnykh S., et al. Diversity of microsatellites derived from genomic libraries and GenBank sequences in rice (Oryza sativa L.) Theor. Appl. Genet. 2000;100:713–22. doi:10.1007/s001220051343. [Google Scholar]
- 46.Matsuoka Y., Vigouroux Y., Goodman M.M., Sanchez G.J., Buckler E., Doebley J. A single domestication for maize shown by multilocus microsatellite genotyping. Proc. Natl. Acad. Sci. USA. 2002;99:6080–4. doi: 10.1073/pnas.052125199. doi:10.1073/pnas.052125199. [DOI] [PMC free article] [PubMed] [Google Scholar]
- 47.Udupa S.M., Baum M. High mutation rate and mutational bias at (TAA)n microsatellite loci in chickpea (Cicer arietinum L.) Mol. Genet. Genomics. 2001;265:1097–103. doi: 10.1007/s004380100508. doi:10.1007/s004380100508. [DOI] [PubMed] [Google Scholar]
- 48.Iruela M., Rubio J., Cubero J.I., Gil J., Millan T. Phylogenetic analysis in the genus Cicer and cultivated chickpea using RAPD and ISSR markers. Theor. Appl. Genet. 2002;104:643–51. doi: 10.1007/s001220100751. doi:10.1007/s001220100751. [DOI] [PubMed] [Google Scholar]
- 49.Upadhyaya H.D., Dwivedi S.L., Baum M., et al. Genetic structure, diversity, and allelic richness in composite collection and reference set in chickpea (Cicer arietinum L.) BMC Plant Biol. 2008;8:106. doi: 10.1186/1471-2229-8-106. doi:10.1186/1471-2229-8-106. [DOI] [PMC free article] [PubMed] [Google Scholar]
- 50.Robertson L.D., Ocampo B., Singh K.B. Morphological variation in wild annual Cicer species in comparison to the cultigens. Euphytica. 1997;95:309–19. doi:10.1023/A:1003004516921. [Google Scholar]
- 51.Ahmad F. A comparative study of chromosome morphology among the nine annual species of Cicer L. Cytobios. 2000;101:37–53. [PubMed] [Google Scholar]
- 52.Kazan K., Muehlbauer F.J. Allozyme variation and phylogeny in annual species of Cicer (Leguminosae) Plant Syst. Evol. 1991;175:11–21. doi:10.1007/BF00942142. [Google Scholar]
- 53.Toker C. A note on the evolution of kabuli chickpeas as shown by induced mutations in Cicer reticulatum Ladizinsky. Genet. Resour. Crop Evol. 2009;56:7–12. doi:10.1007/s10722-008-9336-8. [Google Scholar]
- 54.Abbo S., Berger J., Turner N.C. Evolution of cultivated chickpea: four bottlenecks limit diversity and constrain adaptation. Funct. Plant Biol. 2003;30:1081–7. doi: 10.1071/FP03084. doi:10.1071/FP03084. [DOI] [PubMed] [Google Scholar]
- 55.Lev-Yadun S., Gopher A., Abbo S. The cradle of agriculture. Science. 2000;288:1602–3. doi: 10.1126/science.288.5471.1602. doi:10.1126/science.288.5471.1602. [DOI] [PubMed] [Google Scholar]
- 56.Berger J., Abbo S., Turner N.C. Ecogeography of annual wild Cicer species: the poor state of the world collection. Crop Sci. 2003;43:1076–90. doi:10.2135/cropsci2003.1076. [Google Scholar]
- 57.Tanno K., Willcox G. The origins of cultivation of Cicer arietinum L. and Vicia faba L.: early finds from Tell el-Kerkh, north-west Syria, late 10th millennium B.P. Veg. Hist. Archaeobot. 2006;15:197–204. doi:10.1007/s00334-005-0027-5. [Google Scholar]
- 58.Choumane W., Winter P., Weigand F., Kahl G. Conservation and variability of sequence-tagged microsatellites (STMSs) from chickpea (Cicer aerietinum L.) within the genus Cicer. Theor. Appl. Genet. 2000;101:269–78. doi:10.1007/s001220051479. [Google Scholar]
- 59.Kumar J., Abbo S. Genetics of flowering time in chickpea and its bearing on productivity in semiarid environments. Adv. Agron. 2001;72:107–38. doi:10.1016/S0065-2113(01)72012-3. [Google Scholar]
- 60.Berger J.D., Buck R., Henzell J.M., Turner N.C. Evolution in the genus Cicer vernalisation response and low temperature pod set in chickpea (C. arietinum L.) and its annual wild relatives. Aust. J. Agric. Res. 2005;56:1191–200. doi:10.1071/AR05089. [Google Scholar]
- 61.Li Y., Fan C., Xing Y., et al. Natural variation in GS5 plays an important role in regulating grain size and yield in rice. Nat. Genet. 2011;43:1266–70. doi: 10.1038/ng.977. doi:10.1038/ng.977. [DOI] [PubMed] [Google Scholar]
- 62.Sakiroglu M., Sherman-Broyles S., Story A., et al. Patterns of linkage disequilibrium and association mapping in diploid alfalfa (M. sativa L.) Theor. Appl. Genet. 2012;125:577–90. doi: 10.1007/s00122-012-1854-2. doi:10.1007/s00122-012-1854-2. [DOI] [PMC free article] [PubMed] [Google Scholar]
- 63.Xiao Y., Cai D., Yang W., et al. Genetic structure and linkage disequilibrium pattern of a rapeseed (Brassica napus L.) association mapping panel revealed by microsatellites. Theor. Appl. Genet. 2012;125:437–47. doi: 10.1007/s00122-012-1843-5. doi:10.1007/s00122-012-1843-5. [DOI] [PubMed] [Google Scholar]
- 64.Hou J., Wang C., Hong X., et al. Association analysis of vegetable soybean quality traits with SSR markers. Plant Breed. 2011;113:413–506. [Google Scholar]
- 65.Chen Y., Zein I., Brenner E.A., et al. Polymorphisms in monolignol biosynthetic genes are associated with biomass yield and agronomic traits in European maize (Zea mays L.) BMC Plant Biol. 2010;10:12–22. doi: 10.1186/1471-2229-10-12. doi:10.1186/1471-2229-10-12. [DOI] [PMC free article] [PubMed] [Google Scholar]
- 66.Kharabian-Masouleh A., Waters D.L.E., Reinke R.F., Ward R., Henry R.J. SNP in starch biosynthesis genes associated with nutritional and functional properties of rice. Sci. Rep. 2012;2:557. doi: 10.1038/srep00557. doi:10.1038/srep00557. [DOI] [PMC free article] [PubMed] [Google Scholar]
- 67.Mao H., Sun S., Yao J., et al. Linking differential domain functions of the GS3 protein to natural variation of grain size in rice. Proc. Natl. Acad. Sci. USA. 2010;107:19579–84. doi: 10.1073/pnas.1014419107. doi:10.1073/pnas.1014419107. [DOI] [PMC free article] [PubMed] [Google Scholar]
- 68.Zheng Y., Ren N., Wang H., Stromberg A.J., Perry S.E. Global identification of targets of the Arabidopsis MADS domain protein AGAMOUS-Like15. Plant Cell. 2009;21:2563–77. doi: 10.1105/tpc.109.068890. doi:10.1105/tpc.109.068890. [DOI] [PMC free article] [PubMed] [Google Scholar]
- 69.Le B.H., Cheng C., Bui A.Q., et al. Global analysis of gene activity during Arabidopsis seed development and identification of seed-specific transcription factors. Proc. Natl. Acad. Sci. USA. 2010;107:8063–70. doi: 10.1073/pnas.1003530107. doi:10.1073/pnas.1003530107. [DOI] [PMC free article] [PubMed] [Google Scholar]
- 70.Winter P., Benko-Iseppon A.M., Huttel B., et al. A linkage map of chickpea (Cicer arietinum L.) genome based on recombinant inbred lines from a C. arietinum × C. reticulatum cross: localization of resistance genes for Fusarium wilt races 4 and 5. Theor. Appl. Genet. 2000;101:1155–63. doi:10.1007/s001220051592. [Google Scholar]
- 71.Bao J.S., Corke H., Sun M. Microsatellites in starch-synthesizing genes in relation to starch physicochemical properties in waxy rice (Oryza sativa L.) Theor. Appl. Genet. 2002;105:898–905. doi: 10.1007/s00122-002-1049-3. doi:10.1007/s00122-002-1049-3. [DOI] [PubMed] [Google Scholar]
- 72.Dresselhaus T., Cordts S., Heuer S., et al. Novel ribosomal genes from maize are differentially expressed in the zygotic and somatic cell cycles. Mol. Gen. Genet. 1999;261:416–27. doi: 10.1007/s004380050983. doi:10.1007/s004380050983. [DOI] [PubMed] [Google Scholar]
- 73.Zhang L., Zuo K., Zhang F., et al. Conservation of noncoding microsatellites in plants: implication for gene regulation. BMC Genomics. 2006;7:323. doi: 10.1186/1471-2164-7-323. doi:10.1186/1471-2164-7-323. [DOI] [PMC free article] [PubMed] [Google Scholar]
- 74.Yamasaki K., Kigawa T., Inoue M., et al. A novel zinc-binding motif revealed by solution structures of DNA-binding domains of Arabidopsis SBP-family transcription factors. J. Mol. Biol. 2004;337:49–63. doi: 10.1016/j.jmb.2004.01.015. doi:10.1016/j.jmb.2004.01.015. [DOI] [PubMed] [Google Scholar]
- 75.Fornara F., Parenicova L., Falasca G., et al. Functional characterization of OsMADS18, a member of the AP1/SQUA subfamily of MADS box genes. Plant Physiol. 2004;135:2207–19. doi: 10.1104/pp.104.045039. doi:10.1104/pp.104.045039. [DOI] [PMC free article] [PubMed] [Google Scholar]
- 76.Robles P., Pelaz S. Flower and fruit development in Arabidopsis thaliana. Int. J. Dev. Biol. 2005;49:633–43. doi: 10.1387/ijdb.052020pr. doi:10.1387/ijdb.052020pr. [DOI] [PubMed] [Google Scholar]
- 77.Zhang Y., Schwarz S., Saedler H., Huijser P. SPL8, a local regulator in a subset of gibberellin-mediated developmental processes in Arabidopsis. Plant Mol. Biol. 2006;63:429–39. doi: 10.1007/s11103-006-9099-6. doi:10.1007/s11103-006-9099-6. [DOI] [PubMed] [Google Scholar]
- 78.Xie K., Wu C., Xiong L. Genomic organization, differential expression, and interaction of SQUAMOSA promoter-binding-like transcription factors and micro-RNA156 in rice. Plant Physiol. 2006;142:280–93. doi: 10.1104/pp.106.084475. doi:10.1104/pp.106.084475. [DOI] [PMC free article] [PubMed] [Google Scholar]
- 79.Guo A.Y., Zhu Q.H., Gu X., et al. Genome-wide identification and evolutionary analysis of the plant specific SBP-box transcription factor family. Gene. 2008;418:1–8. doi: 10.1016/j.gene.2008.03.016. doi:10.1016/j.gene.2008.03.016. [DOI] [PubMed] [Google Scholar]
- 80.Manning K., Tor M., Poole M.Y., et al. A naturally occurring epigenetic mutation in a gene encoding an SBP-box transcription factor inhibits tomato fruit ripening. Nat. Genet. 2006;38:948–52. doi: 10.1038/ng1841. doi:10.1038/ng1841. [DOI] [PubMed] [Google Scholar]
- 81.Flint-Garcia S.A., Thornsberry J.M., Buckler E.S. Structure of linkage disequilibrium in plants. Annu. Rev. Plant Biol. 2003;54:357–74. doi: 10.1146/annurev.arplant.54.031902.134907. doi:10.1146/annurev.arplant.54.031902.134907. [DOI] [PubMed] [Google Scholar]
- 82.Gupta P.K., Rustgi S., Kulwal P.L. Linkage disequilibrium and association studies in higher plants: present status and future prospects. Plant Mol. Biol. 2005;57:461–85. doi: 10.1007/s11103-005-0257-z. doi:10.1007/s11103-005-0257-z. [DOI] [PubMed] [Google Scholar]
- 83.Amos W., Driscol E., Hoffman J.I. Candidate genes versus genome-wide associations: which are better for detecting genetic susceptibility to infectious disease? Proc. R Soc. B. 2011;278:1183–8. doi: 10.1098/rspb.2010.1920. doi:10.1098/rspb.2010.1920. [DOI] [PMC free article] [PubMed] [Google Scholar]
- 84.Konishi S., Izawa T., Lin S.Y., et al. An SNP caused loss of seed shattering during rice domestication. Science. 2006;312:1392–6. doi: 10.1126/science.1126410. doi:10.1126/science.1126410. [DOI] [PubMed] [Google Scholar]
Associated Data
This section collects any data citations, data availability statements, or supplementary materials included in this article.