Abstract
We have developed an atmospheric pressure ionization technique called liquid matrix-assisted laser desorption electrospray ionization (liq-MALDESI) for the generation of multiply-charged ions by laser desorption from liquid samples deposited onto a stainless steel sample target biased at a high potential. This variant of our previously reported MALDESI source does not utilize an ESI emitter to post-ionize neutrals. Conversely, we report desorption and ionization from a macroscopic charged droplet. We demonstrate high mass resolving power single-acquisition FT-ICR-MS analysis of peptides and proteins ranging from 1 to 8.6 kDa at atmospheric pressure. The liquid sample acts as a macroscopic charged droplet similar to those generated by electrospray ionization, whereby laser irradiation desorbs analyte from organic matrix containing charged droplets generating multiply-charged ions. We have observed a singly-charged radical cation of an electrochemically active species indicating oxidation occurs for analytes and therefore water; the latter would play a key role in the mechanism of ionization. Moreover, we demonstrate an increase in ion abundance and a concurrent decrease in surface tension with an increase in the applied potential.
Keywords: MALDESI, liq-MALDESI, LTQ-FT, Top-Down Proteomics, Atmospheric Pressure Ionization
Introduction
Mass spectrometry has become one of the most powerful techniques for characterization and identification of biological molecules. Since the advent of matrix-assisted laser desorption ionization (MALDI)1, 2 and electrospray ionization (ESI)3 the overall utility of mass spectrometry has increased significantly, particularly in the area of biological sciences including proteomics and metabolomics. Recently, several novel ambient ionization sources have been developed that enable direct analysis at atmospheric pressure such as laser desorption atmospheric pressure chemical ionization (LD-APCI),4, 5 desorption electrospray ionization (DESI),6 direct analysis in real time (DART),7 atmospheric pressure solids analysis probe (ASAP),8 laser induced acoustic desorption (LIAD)9 electrospray assisted laser desorption ionization (ELDI),10, 11 matrix-assisted laser desorption electrospray ionization (MALDESI)12, 13 and most recently laser ablation electrospray ionization (LAESI),14 atmospheric pressure matrix-assisted infrared laser desorption/ionization (AP-IR-MALDI)15 and infrared laser-assisted desorption electrospray ionization (IR-LADESI).16 The advantages of direct analysis under atmospheric pressure are direct access to samples during analysis and no additional sample preparation steps required for vacuum sensitive samples (e.g., tissue slices). Laser desorption ionization sources have the added benefits of minimal sample preparation and high spatial resolution due to the inherently small laser spot sizes which makes them ideal for analysis of biological molecules and tissue imaging applications.17, 18
ELDI, MALDESI and LAESI are based on laser desorption followed by post-ionization via electrospray ionization. Introduction of an internal calibrant via the ESI solution has been demonstrated to achieve high mass measurement accuracy of desorbed ions without interfering with the analyte/matrix co-crystallization of the sample.13 Recently, liquid sample analysis was demonstrated by ultraviolet laser desorption from matrix containing liquid samples followed by post-ionization by ESI using ELDI11 and using infrared laser desorption from liquid samples without ESI post-ionization using AP-IR-MALDI.15 In a similar method described herein, a variation of our MALDESI source, liquid matrix-assisted laser desorption electrospray ionization (liq-MALDESI) utilizes an ultraviolet laser directed onto the surface of an analyte containing liquid droplet biased at a high potential. In this method, the charged droplet acts as a macroscopic ESI droplet, from which offspring droplets are laser desorbed which then undergo an ESI-like desorption and ionization process generating multiply-charged ions.
Sample preparation using AP-IR-MALDI includes the addition of anhydrous glycerol and heating at 50°C for 20 minutes or placing into a desiccator for 1 hour to remove excess water prior to analysis. Glycerol is generally is added to increase the viscosity of the solvent/sample, which in this case may impede the desorption of analyte from the droplet possibly leading to the long analysis times and decreased sensitivity (25 times longer analysis time for 6 times the amount of deposited analyte, compared to liq-MALDESI, reported herein) demonstrated by Dreisewerd and coworkers.15 In contrast, sample preparation for liq-MALDESI involves mixing analyte with an ultraviolet absorbing organic matrix, both dissolved in aqueous acetonitrile. No lengthy sample heating or desiccation is required prior to analysis. Under our laboratory conditions, the surface tension of the liquid droplet impacts both the ion abundance and sensitivity.
In ESI, a high potential is applied to aqueous solution which causes the oxidation of water, generating excess protons in solution. The solution exits through an emitter tip and due to coulombic repulsion charged droplets are expelled from the emitter tip. The surface area of the droplet decreases due to evaporation of solvent, thereby increasing the charge density on the droplet surface. The increased charge density results in a decrease in the surface tension of the charged solvent droplets which plays a key role in the desorption of ions.19 For a static droplet deposited on a surface, as shown in Figure 1, the same general principles apply; an increase in applied potential necessarily increases the number of charges (due to oxidation of water) on the droplet surface which results in a decrease in the surface tension of the droplet. The surface tension for a static droplet on a surface is often determined by measuring the contact angle made at the three-phase line, the intersection of the solid, liquid and gas phases. The Gibbs, Johnson and Neumann approach can be used to relate the surface tension of a liquid drop to the contact angle measurements under a variety of equilibrium conditions including the addition of electric charges.20 The decrease in contact angle due to applied potential may be attributed to the reduction of surface tension.20 Charge separation occurs at the liquid-vapor interface due to Coulombic repulsions of like charges while an electrical double layer (EDL) forms at the solid-liquid interface (Figure 1) thereby minimizing the energy of the droplet on the surface.21
Figure 1.
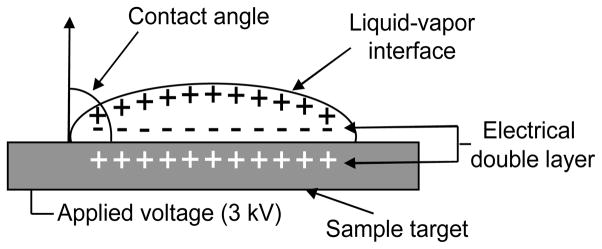
Diagram of a liquid sample drop deposited onto a stainless steel sample target biased at 3 kV. The solid-liquid-vapor contact angle measurement is demonstrated in addition to the electric double layer at the solid-liquid interface.
Herein, we demonstrate the generation and detection of multiply-charged peptide and protein ions by liq-MALDESI from liquid sample drops containing analyte mixed with organic matrix deposited onto a stainless steel sample target biased at a high potential. The high potential applied to the sample target was varied to optimize conditions for desorption and ionization, the contact angle was measured across the voltage range to determine the effects of increased applied potential on droplet surface tension and detection using liq-MALDESI.
Experimental
Materials
Bradykinin, melittin, ubiquitin, rubrene, 2,5-dihydroxybenzoic acid (DHB) and dichloromethane were purchased from Sigma-Aldrich (St. Louis, MO, USA) and used without further purification. High purity water and HPLC grade acetonitrile were purchased from Burdick and Jackson (Muskegon, MI, USA) and used as received.
The contact angle measurements were performed using a rame-hart CA-100-00 contact angle goniometer equipped with a microscope for silhouette viewing of liquid drops on a surface, two independently rotatable crosshairs and an internal readout protractor for precise contact angle measurements. The 2 μL liquid sample drops were deposited onto a stainless steel MALDI target mounted on a Teflon insulator attached to the goniometer. The sample target potential was applied using a high voltage power supply (Analytica of Branford, Branford, CT, USA).
liq-MALDESI-LTQ and LTQ-FT Mass Spectrometry
A new MALDESI source was constructed based partly on the design described previously,12 with the addition of a high precision computer controlled motion control system (ESP-300, Newport Corporation, Irvine, CA, USA) and a 349 nm UV laser (Explorer, 349-120-1KE, Newport Corporation, Irvine, CA, USA) all mounted to an independent support frame (PFP51505, Thorlabs, Newton, NH, USA). Two UV enhanced aluminum mirrors and a fused silica convex lens (10D20AL.2 and SPX017+AR.10, Newport Corporation, Irvine, CA, USA) were assembled using a periscope assembly (RS 99, Thorlabs, Newton, NH, USA) onto a vibrationally damped breadboard (PBI11111, Thorlabs, Newton, NH, USA) supported by the passively isolated support frame which also houses the high voltage power supply (Analytica of Branford, Branford, CT, USA), XYZ stage positioning controller and laptop computer.
The high repetition rate (1–5000 Hz) computer controlled Explorer laser was affixed to the breadboard such that the beam could be directed using the directional mirrors and focused onto the sample target directly in front of the mass spectrometer and connected to the onboard laptop computer. The laser repetition rate was set to 50 Hertz at 90 μJ laser power, measured internally. The stainless steel 192 well sample target (4333375, Applied Biosystems, Foster City, CA, USA) was affixed to a Teflon insulator attached to a XYZ motorized linear stage (436, Newport Corporation, Irvine, CA, USA). A high magnification CCD camera was positioned above the sample plate for live monitoring of the sample during analysis. A full description of the source construction including a complete parts list is described elsewhere.22
A LTQ linear ion trap and a hybrid LTQ-FT Ultra mass spectrometer, both from Thermo-Electron (San Jose, CA, USA), were used in these experiments. The LTQ-FT was equipped with an Oxford Instruments 7 Tesla superconducting magnet and spectra were collected at a resolving power setting of 100,000FWHM at m/z = 400. The ion transfer capillary voltage and temperature were set to 40 V and 200°C, respectively.
Results and Discussion
liq-MALDESI-LTQ Liquid Sample Analysis
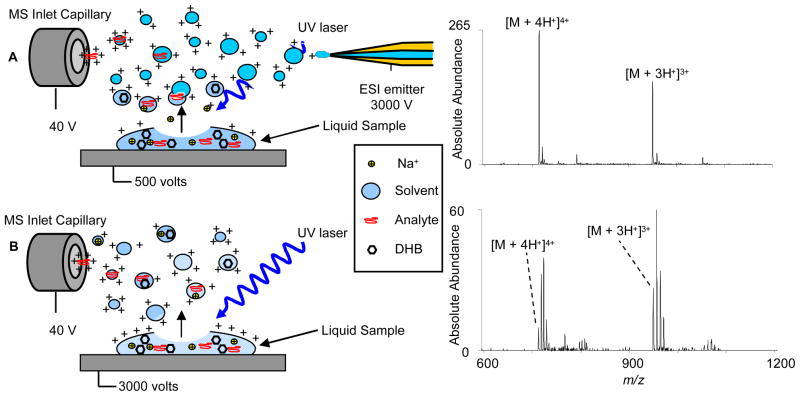
Analyte mixed with matrix was deposited onto the sample target for immediate (1 – 30 seconds) analysis of the liquid sample. In this experiment, a reproduction of the work done by Loo’s group,11 the analyte (melittin, 100 μM) mixed with an organic matrix (DHB, 75 mg/mL) was deposited (0.5 μL) onto the sample target and immediately analyzed by laser ablation of the liquid sample while electrospraying 50% acetonitrile in water. The ESI emitter and stainless steel sample target were biased at 2.6 kilovolts (kV) and 500 volts, respectively. A schematic and representative mass spectrum of melittin are shown in Figure 2A. The ion abundances are similar to those obtained by solid-state MALDESI; however, the sample target was not moved during analysis and the shot-to-shot reproducibility was improved yielding long lasting signal (~ 30 seconds/spot). The laser energy absorbed by the matrix is readily transferred to the surrounding analyte or solvent molecules in the liquid phase thereby enhancing desorption. The improved duration of signal from the liquid drop compared with solid state MALDESI indicates that desorption and/or ionization efficiency are improved for a comparable volume (0.5 μL) and concentration of analyte (100 μM) mixed with DHB to create a dried sample spot. The control experiment was attempted to exclude desorption of ions from the liquid droplet on the surface without the ESI emitter in place by laser desorption of a new liquid drop of the same analyte solution with the sample target biased at 500 V. This experiment yielded a weak analyte signal.
Figure 2.
Ionization schemes and representative mass spectra for A) liq-MALDESI from liquid drop containing analyte mixed with matrix while electrospraying 50 % acetonitrile in water and B) liq-MALDESI without ESI post-ionization, the sample target was at biased at 3 kV.
Based on this observation from the control experiment it was evident that the ESI emitter was not necessary for generation of multiply-charged ions. Therefore we purposefully applied a high-voltage to the sample target in the absence of the ESI emitter. The potential applied to the sample target was increased from 500 V to 3 kV, resulting in an increase in ion abundance. Ion abundances increase up to 2–3 kV, then decreases with additional applied voltage (up to 5 kV) (vida infra). A schematic of liq-MALDESI and representative mass spectrum of melittin mixed with DHB are shown in Figure 2B. Sodium adduction is very prevalent in the liq-MALDESI mass spectra with the ESI emitter removed. The role of the electrosprayed solvent in the ionization process for both solid-state and liq-MALDESI in previous experiments is that it functions as an intermediate, fusing with desorbed neutral analyte molecules (solid-state) or analyte, matrix and sodium containing desorbed droplets (liquid-state) which then undergo an ESI-like desorption and ionization process. Sodium adduction is not encountered in solid-state MALDESI as a result of the exclusion of charged sodium adducted ions from the electrosprayed droplets. In the absence of the ESI plume, multiply-charged ions desorbed from the charged liquid sample drop, including sodium adducted ions are readily sampled by the mass spectrometer. The control experiments were conducted for a liquid droplet on an unbiased target and for dried samples with and without applied voltage (0–5 kV), all without ESI post-ionization, yielding no analyte signal, providing evidence that this is not a pure AP-MALDI process, as suggested by Dreisewerd.15
liq-MALDESI Ion Abundance Versus Sample Target Potential
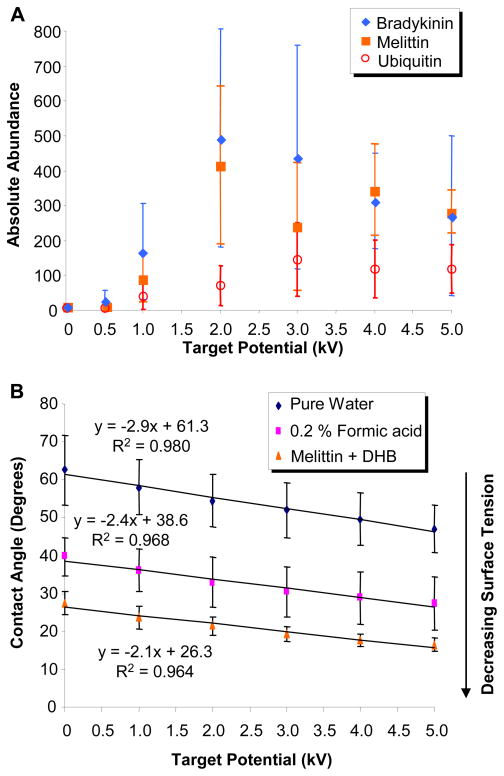
Liquid drop samples of bradykinin, melittin and ubiquitin (10 μM mixed with DHB) were used to characterize the ion abundance dependence on the sample target potential. Each 0.5 μL sample was deposited onto the biased sample target for immediate (1 – 30 seconds) analysis by liq-MALDESI (without ESI post-ionization). The sample target bias was varied between 0 and 5000 volts in 1000 volt increments and mass spectra were collected utilizing a fresh sample drop at each potential. A plot of the absolute abundance versus the sample plate potential is shown in Figure 3A. At a potential of 0 volts, liq-MALDESI did not yield detectable signal in the mass spectrometer. The ion abundance for bradykinin and melittin demonstrated a steady increase up to 2 kV (maximum abundance), whereas for ubiquitin the maximum ion abundance was observed at 3 kV. The increased potential required for larger molecules may be necessary to increase the surface charge density of the drop, thereby increasing the number of charges available to the analyte facilitating its desorption from the droplet. One interesting observation is there was no shift in the average charge-state across the range of applied potentials, only a change in absolute ion abundances.
Figure 3.
Plot of A) absolute abundance versus target potential for 10 μM solutions of bradykinin, melittin and ubiquitin mixed with DHB using liq-MALDESI and B) plot of contact angle versus applied target potential for pure water, 0.2% formic acid in water and a solution of melittin (10 μM) mixed with DHB (10 mM). Without ESI post-ionization, sample target bias was varied.
Contact Angle Versus Sample Target Potential
We hypothesized that with an increase in the applied potential we should observe a reduction in the surface tension of the drop. A method commonly used to determine surface tension (surface energy) on a drop is to measure the contact angle made by the solid, liquid and gas phase interface (three phase contact line) of the droplet on a surface.
The contact angle was measured for liquid droplets (2 μL) of pure water, water with 0.2 % formic acid and a sample of melittin (10 μM) mixed with DHB across the voltage range (0 – 5 kV, 1 kV increments). Each drop was placed onto the sample target, the contact angle was measured, the potential was increased and the contact angle was re-measured, this was repeated across the voltage range. These results are shown in Figure 3B. The contact angle for each sample decreased for increasing applied potential. The decrease in the contact angle is influenced by the formation of an electric double layer (EDL) at the solid-liquid interface (negative charges align on the liquid side opposite the positive charges on the sample target) and the build-up of positive charges on the liquid-vapor interface. The EDL results in a reduction in the energy of the solid-liquid interface, allowing more of the droplet surface to interact with the sample target while the positive charge build-up at the liquid-vapor interface corresponds to a decrease in surface tension. The decrease in the surface tension with increasing applied potential supports the theory that charges accumulate on the surface and that laser desorption liberates analyte containing charged droplets which then undergo and ESI-like desorption and ionization process. This data also supports the oxidation of water at the target/water interface.
liq-MALDESI-LTQ-FT-ICR Analysis of Peptides and Proteins
Although sodium adduction is evident in the initial liq-MALDESI mass spectra at high analyte + matrix concentrations, reduced concentrations of analyte mixed with DHB show significantly reduced or no sodium adduction. A 0.5 μL drop of bradykinin, melittin or ubiquitin mixed with DHB was deposited onto the stainless steel sample target biased at 3 kV for immediate (1 – 30 seconds) analysis. The concentration of DHB was varied for each analyte and the optimal ratio was found to be 1:1000 for bradykinin and melittin and 1:2500 for ubiquitin (data not shown). The analyte-to-matrix ratio range (1:1000 to 1:2500) was acceptable to desorb and ionize any of the standard peptides and proteins used in these experiments with only marginal gain/loss in ion abundances across the range for each analyte. Several spectra were obtained for both bradykinin and melittin at high analyte concentrations (100 μM) without addition of matrix; however, the ion abundance was low and the signal was short lived (2–3 spectra/sample drop), relative to samples with matrix. No signal was obtained from ubiquitin without matrix. It is important to note, as mentioned previously, no analyte signal was observed after the liquid has evaporated.
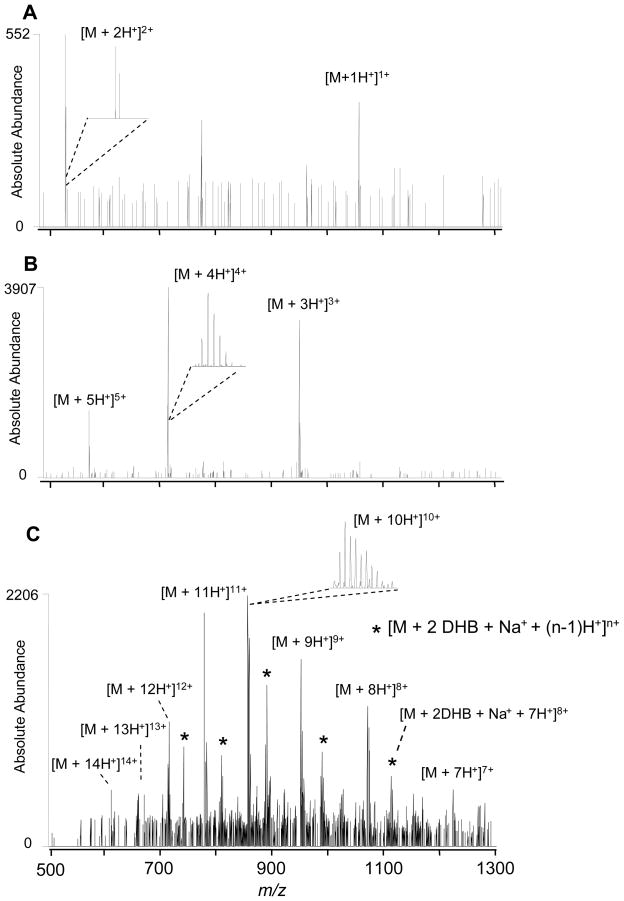
The amount of analyte deposited for analysis was reduced by diluting the original solution, thereby preserving the optimal analyte-to-matrix ratio. The amount of analyte deposited onto the surface in a 0.5 μL droplet of a 5 μM solution was 2.5 picomoles (bradykinin and melittin) and 25 picomoles deposited for 0.5 μL of a 50 μM solution (ubiquitin). Representative liq-MALDESI-FT-ICR mass spectra of bradykinin (5 μM), melittin (5 μM) and ubiquitin (50 μM) are shown in Figure 4 A, B and C. Bradykinin and melittin FT-ICR mass spectra were readily obtained from 5 μM solutions with no sodium adduction as shown in Figure 4 A and B; however, for ubiquitin a 50 μM solution was necessary to achieve appreciable ion abundance, as a result of the increased concentration, the concentration of matrix in the sample was also increased (preserving the analyte-to-matrix ratio), contributing to the observed matrix and sodium adduction.
Figure 4.
liq-MALDESI-LTQ-FT-ICR mass spectra from 5 μM solutions of A) bradykinin and B) melittin and C) 50 μM solution of ubiquitin mixed with DHB. Without ESI post-ionization, sample target biased at 3 kV.
The volume desorbed from the 0.5 μL precursor droplet for each mass spectrum can be estimated based on the time required to desorb/evaporate the droplet to dryness on the surface (~ 30 seconds). An approximation can be made for the amount of analyte removed per mass spectrum utilizing several basic assumptions (e.g., desorption rate, constant concentration). Assuming a constant rate of desorption, approximately 17 nanoliters are desorbed per second. For a 5 μM solution this corresponds to ~ 85 femtomoles desorbed and detected per spectrum (1 second collection). Detectable FT-ICR signal was obtained from a 1 μM bradykinin + DHB solution (S/N = 6.8, data not shown); using the same desorption rate this corresponds to ~ 17 femtomoles desorbed and detected per spectrum, equivalent to electrospray ionization of a 1 μM solution at a flow rate 1 μL/min with a 1 second collection.
The liq-MALDESI (without ESI post-ionization) ionization mechanism is hypothesized to result from the generation of excess protons in the bulk solution by oxidation of water at the sample target interface, which is supported by the data in Figure 3B. The excess protons are electrostatically repulsed by the high potential at the sample target as well as from other protons, resulting in a high charge density at the droplet surface, similar to the high charge density found at the surface of electrosprayed droplets.19 The UV laser energy is absorbed by organic matrix (DHB) dissolved in the droplet, resulting in an eruption of small highly-charged droplets (offspring droplets) into the space above the macroscopic droplet, which then undergo an ESI-like desorption and ionization process generating multiply-charged ions en route to the mass spectrometer.
liq-MALDESI-LTQ-FT-ICR Electrochemical Ionization
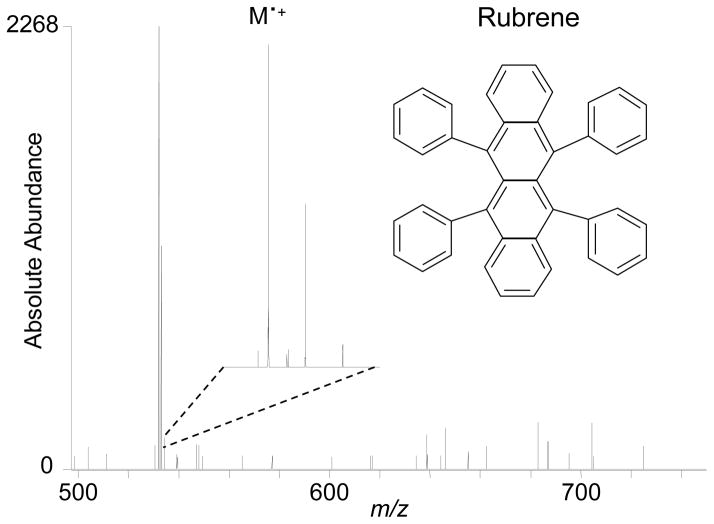
Detailed examination of the liq-MALDESI-FT-ICR mass spectra of melittin revealed a small peak in the DHB adduct that corresponds to the triply-charged doubly adducted radical cation (data not shown). This unexpected result led to the investigation of the electrochemical ionization potential of this technique using a rubrene, a molecule used by Van Berkel’s group, with demonstrated ability to form a stable radical cation by electrochemical oxidation.23 Rubrene dissolved in dichloromethane was diluted with acetonitrile to give a 50 μM final concentration in 25 % dichloromethane 75 % acetonitrile. Liquid sample droplets (1.0 μL) were deposited onto the sample target biased at 3 kV for immediate (1 – 15 seconds, due to increased evaporation rate) laser desorption at a laser power of 50 μJ and 50 Hz repetition rate. The liq-MALDESI-FT-ICR mass spectrum of rubrene is shown in Figure 5. The singly-charged radical cation was detected and determined by exact mass. The presence of the radical cation demonstrates the potential of this technique for ionization of electrochemically active molecules via oxidation.
Figure 5.
liq-MALDESI-FT-ICR mass spectrum from 50 μM rubrene without ESI post-ionization, sample target biased at 3 kV.
Conclusions
liq-MALDESI is a sensitive atmospheric pressure ionization technique used to generate multiply-charged ions from a liquid sample drop biased at high potential. The relatively easy sample preparation and sample accessibility during analysis are key features demonstrated by liq-MALDESI. Laser desorption from the liquid droplet eliminates the need for electrosprayed solvent for fast and sensitive analysis. The surface tension is attenuated by the applied voltage and may play a key role in desorption and ionization using liq-MALDESI. The generation of multiply-charged ions by liq-MALDESI results in increased top-down efficiency and when coupled to high resolving power high mass accuracy FT-ICR mass spectrometry is an excellent platform for identification and characterization of biological molecules. liq-MALDESI also offers the advantage of eliminating carryover or cross-contamination between samples as each drop is deposited separately on a new portion of the sample target for analysis. We are currently investigating electronically addressable sample targets (e.g., patterned surfaces) for independent control over applied potential and coupling to online HPLC for analysis of complex biological samples (e.g., biological fluids). Furthermore, we are studying liq-MALDESI as an ionization method for electrochemically active molecules not normally ionizable using ESI.23, 24
Acknowledgments
The authors thank Dr. Edmond F. Bowden for the loan of the goniometer and the machine shop personnel in the College of Physical and Mathematical Sciences at North Carolina State University for their assistance with the MALDESI/liq-MALDESI source construction. The authors gratefully acknowledge financial support received from the National Cancer Institute, National Institutes of Health (R33 CA105295), the W.M. Keck Foundation, the William R. Kenan, Jr. Fund for Engineering, Technology & Science, and North Carolina State University.
References
- 1.Karas M, Hillenkamp F. Anal Chem. 1988;60:2299–2301. doi: 10.1021/ac00171a028. [DOI] [PubMed] [Google Scholar]
- 2.Tanaka K, Waki H, Ido Y, Akita S, Yoshida Y, Yoshida T. Rapid Commun Mass Spectrom. 1988;2:151–153. [Google Scholar]
- 3.Fenn JB, Mann M, Meng CK, Wong SF, Whitehouse CM. Science. 1989;246:64–71. doi: 10.1126/science.2675315. [DOI] [PubMed] [Google Scholar]
- 4.Kolaitis L, Lubman DM. Anal Chem. 1986;58:2137–2142. [Google Scholar]
- 5.Coon JJ, McHale KJ, Harrison WW. Rapid Commun Mass Spectrom. 2002;16:681–685. doi: 10.1002/rcm.626. [DOI] [PubMed] [Google Scholar]
- 6.Takats Z, Wiseman JM, Gologan B, Cooks RG. Science. 2004;306:471–473. doi: 10.1126/science.1104404. [DOI] [PubMed] [Google Scholar]
- 7.Cody RB, Laramee JA, Durst HD. Anal Chem. 2005;77:2297–2302. doi: 10.1021/ac050162j. [DOI] [PubMed] [Google Scholar]
- 8.McEwen CN, McKay RG, Larsen BS. Anal Chem. 2005;77:7826–7831. doi: 10.1021/ac051470k. [DOI] [PubMed] [Google Scholar]
- 9.Crawford KE, Campbell JL, Fiddler MN, Duan P, Qian K, Gorbaty ML, Kenttamaa HI. Anal Chem. 2005;77:7916–7923. doi: 10.1021/ac0511501. [DOI] [PubMed] [Google Scholar]
- 10.Shiea J, Huang MZ, Hsu HJ, Lee CY, Yuan CH, Beech I, Sunner J. Rapid Commun Mass Spectrom. 2005;19:3701–3704. doi: 10.1002/rcm.2243. [DOI] [PubMed] [Google Scholar]
- 11.Peng IX, Shiea J, Loo RRO, Loo JA. Rapid Commun Mass Spectrom. 2007;21:2541–2546. doi: 10.1002/rcm.3154. [DOI] [PubMed] [Google Scholar]
- 12.Sampson JS, Hawkridge AM, Muddiman DC. J Am Soc Mass Spectrom. 2006;17:1712–1716. doi: 10.1016/j.jasms.2006.08.003. [DOI] [PubMed] [Google Scholar]
- 13.Sampson JS, Hawkridge AM, Muddiman DC. Rapid Commun Mass Spectrom. 2007;21:1150–1154. doi: 10.1002/rcm.2947. [DOI] [PubMed] [Google Scholar]
- 14.Nemes P, Vertes A. Anal Chem. 2007;79:8098–8106. doi: 10.1021/ac071181r. [DOI] [PubMed] [Google Scholar]
- 15.Konig S, Kollas O, Dreisewerd K. Anal Chem. 2007;79:5484–5488. doi: 10.1021/ac070628t. [DOI] [PubMed] [Google Scholar]
- 16.Rezenom YH, Dong J, Murray KK. Analyst. 2008;133:226–232. doi: 10.1039/b715146b. [DOI] [PubMed] [Google Scholar]
- 17.Todd PJ, Schaaff TG, Chaurand P, Caprioli RM. J Mass Spectrom. 2001;36:355–369. doi: 10.1002/jms.153. [DOI] [PubMed] [Google Scholar]
- 18.Caprioli RM, Farmer TB, Gile J. Anal Chem. 1997;69:4751–4760. doi: 10.1021/ac970888i. [DOI] [PubMed] [Google Scholar]
- 19.Fenn JB. J Am Soc Mass Spectrom. 1993;4:524–535. doi: 10.1016/1044-0305(93)85014-O. [DOI] [PubMed] [Google Scholar]
- 20.Digilov R. Langmuir. 2000;16:6719–6723. [Google Scholar]
- 21.Grahame DC. Chem Rev. 1947;41:441–501. doi: 10.1021/cr60130a002. [DOI] [PubMed] [Google Scholar]
- 22.Sampson JS, Hawkridge AM, Muddiman DC. J Am Soc Mass Spectrom. 2008 doi: 10.1016/j.jasms.2008.06.013. submitted. [DOI] [PMC free article] [PubMed] [Google Scholar]
- 23.Van Berkel GJ, Zhou FM. Anal Chem. 1995;67:2916–2923. [Google Scholar]
- 24.Blades AT, Ikonomou MG, Kebarle P. Anal Chem. 1991;63:2109–2114. [Google Scholar]


