Abstract
Objective
To evaluate the expression and regulation of a novel B7-like protein, PD-L1, the ligand for the immunoinhibitory receptor PD-1 expressed on activated T-cells, on microvascular endothelial cells (ECs)
Methods
PD-L1 expression on ECs in vitro and in vivo was quantified by using a dual radiolabeled antibody technique after treatment with interferons (IFN) and IL-12, respectively. Changes in the level of PD-L1 mRNA were determined by using RT-PCR.
Results
PD-L1 was observed to be present on ECs under basal conditions. Treatment of ECs with IFN-α, -β and -γ, but not LPS, was observed to induce elevations in the mRNA and surface expression of PD-L1 on ECs. By using a dual radiolabeled monoclonal antibody (mAb) technique, PD-L1 expression in various tissues of control and IL-12 challenged wild-type and IFN-γ-deficient mice was measured. A significant increase in PD-L1 expression was observed in tissues at 24 hours after IL-12-challenge, with peak levels of PD-L1 occurring 72 hours after IL-12 challenge. IL-12 was not effective at inducing PD-L1 expression in tissues of IFN-γ-deficient mice.
Conclusions
These data show the expression of a novel B7-like molecule on murine ECs that is mediated by IFN-α, -β, and -γ, and suggest a potential pathway by which ECs may modulate T-cell function.
Keywords: endothelial cell, costimulation, T-lymphocyte, cellular activation
INTRODUCTION
Endothelial cells regulate the movement of leukocytes from the vascular bed to interstitial compartments through a variety of complex adhesive interactions (33). Endothelial cells also have the capacity to serve as antigen-presenting cells because they can express both MHC class I and II molecules (23,27,28). It is possible that, in addition to their well-established role in cell trafficking, endothelial cells may also directly regulate T activation in an antigen-specific fashion during the series of adhesive interactions that lead to cell migration. For optimal T-cell stimulation, a costimulatory signal, in addition to TCR receptor engagement by peptides bound to MHC molecules, is required. The most extensively characterized costimulatory signal is delivered through engagement of CD28 on the T cell with its natural ligands B7.1 and B7.2 on the APC. Although human umbilical vein endothelial cells (ECs) (HUVECs) express a variety of molecules that are capable of providing costimulation to T cells, including LFA-3 and CD40, it is generally accepted that they lack both B7.1 and B7.2 (6,17,26,32). This absence of B7 expression may account in part for the relative inability of HUVECs to activate naïve T cells compared with other APCs such as dendritic cells (24).
Unlike HUVECs, microvascular ECs isolated from human cardiac tissue express B7.1 after CD40 ligation and are capable of supporting lymphocyte proliferation (16). This is consistent with murine studies in which constitutive and/or inducible B7 expression has been observed on microvascular ECs both in vitro and in vivo (13,20,27). These findings suggest that the array of costimulatory molecules expressed on the surface of an EC may depend not only on the source (i.e., microvascular vs. macrovascular) but also the activation state of the cell. If this is the case, it is perhaps not surprising that studies addressing the ability of EC’s to regulate T-cell function in vitro have yielded somewhat conflicting results, with both positive and negative effects on T-cell proliferation, cytokine secretion, and migration reported. Once again, the outcome of this EC/T cell interaction is likely to be influenced by the source of the EC and the state of activation.
A novel immunoinhibitory molecule called PD-L1, which belongs to the B7 family, was recently identified as the ligand for PD-1, a type I transmembrane receptor expressed on activated T and B cells (11,22). Like CTLA4, PD-1 contains an immunoreceptor tyrosine-based inhibitory (ITIM) motif in its cytoplasmic region and acts as a negative regulator of lymphocyte function. Based on findings from PD1-deficient mice, PD-1 may play a central role in maintaining peripheral tolerance (29). To date, PD-L1 expression has been detected on human peripheral blood monocytes and murine and human dendritic cells after activation with IFN-γ and lipopolysaccharide (LPS) (11). Using a variety of in vitro cell-based assays, engagement of PD-1 by PD-L1 was shown to inhibit TCR-mediated activation of lymphocytes. In addition to its expression on antigen-presenting cells, PD-L1 mRNA can be readily detected in nonlymphoid tissue such as heart and lung, raising the possibility that PD-L1 may regulate lymphocyte function at sites of inflammation. Here we report that the PD-L1 immunoinhibitory molecule PD-L1 is rapidly expressed on murine microvascular ECs after activation with IFN-α, -β, and -γ, but not LPS or TNF-α. Consistent with this finding, IL-12-challenged wild-type but not IFN-γ-deficient mice exhibit an elevation of PD-L1 expression in blood vessels of various tissues. These results suggest a potential novel pathway whereby ECs may directly regulate lymphocyte activation and attenuate the immune response and inhibit the pathogenesis of immunological diseases.
MATERIALS AND METHODS
Cytokines and Antibodies
Recombinant murine IFN-γ was obtained from R and D Systems, Minneapolis MN). Recombinant murine IFN-α and IFN-β were obtained from Biosource International (Camarillo, CA). A rat immunoglobulin (IgG) G2b isotype control was obtained from Pharmingen (San Diego, CA).
Mice
Male C57Bl/6 and IFN-γ-deficient mice (C57Bl/6 background), 8–12 weeks of age, were obtained from Charles River and Jackson Laboratory, respectively, and housed in our animal resource facility under pathogen-free conditions. IFN-γ-deficient mice were generated as described by Dalton et al. (4).
Cell Line and Culture Conditions
The murine EC line, MS1 EC (American Tissue and Cell Culture, Rockville, MD), is an immortalized EC derived from pancreatic islets of C57Bl/6 mice (1). ECs were subcultured in Dulbecco’s Modified Eagle Medium (DMEM) containing 5% fetal bovine serum, 2 mM L-glutamine, 1% sodium pyruvate, and 1% antibiotic-antimycotic solution. All reagents were obtained from Life Technologies (Rockville, MD). ECs were subcultured into six-well plates and allowed to grow to 80–90 of confluency, approximately 3–4 days. ECs were detached from the plates by brief exposure to 0.05% Trypsin-EDTA. Trypsin was inactivated by the addition of media containing fetal bovine serum.
Generation of PD-L1 mAb
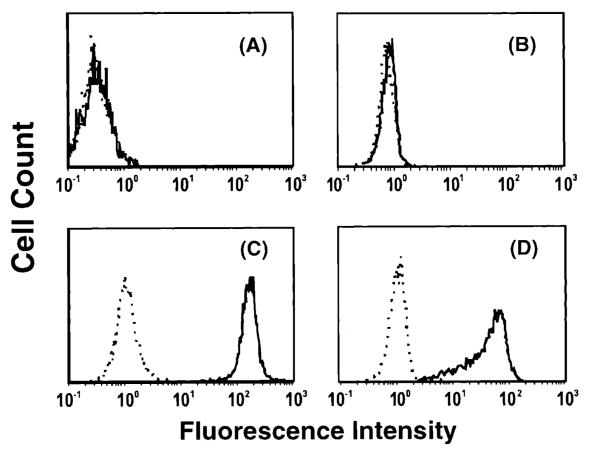
Female Lewis strain rats (Harlan Sprague-Dawley, Inc., Indianapolis, IN) were prepared for cDNA immunization by injecting 100 μL of 10 mM cardiotoxin (Sigma Chemical Company, St. Louis, MO) in 0.9% saline into the tibialis anterior muscle of each hind limb. Five days later, 100 μL of 1 mg/mL purified murine PD-L1 cDNA in the pAXEF mammalian expression vector in 0.9% saline was injected into each regenerating anterior tibialis anterior muscle of each rat. The cDNA immunization was repeated three times at 2- to 3-week intervals. Rats were then immunized with 1–5 × 10⁷ CHO-mPD-L1 transfectants four times at 2- to 5-week intervals. Five days before fusion the rat was immunized with both cDNA (200 μg) and cells (5 × 10⁷). Spleen cells were fused with SP2/0 myeloma cells, cloned, and the hybridomas screened by ELISA for reactivity with a murine PD-L1 fusion protein (mPD-L1-mIgG2a), followed by cell surface staining of murine PD-L1 transfected 300.19 cells and COS cells and for lack of reactivity with untransfected cells and murine PD-L2 transfected cells. Hybridoma 10F.9G2 (rat IgG2b) was chosen for further analysis. Figure 1 illustrates the specificity of 10F.9G2 to bind to mPD-L1, as evidenced of CHO-mPD-L1 and EL-4-mPD-L1 transfected cells to bind 10F.9G2, but not mock-transfected and untransfected cells.
Figure 1.
CHO and EL4 PD-L1 transfectants, CHO-mPD-L1 and EL4-mPD-L1, respectively, were made by coelectroporation of linearized mPD-L1 cDNA in the pAXEF mammalian expression vector and a plasmid containing the puromycin resistance gene. Puromycin-resistant cells were stained with PD-1-Ig, sorted twice, and cloned. (A) CHO cells (B) mock-transfected EL4 cells, (C) CHO-mPD-L1 cells, and (D) EL4-mPD-L1 cells were stained with 10 μg/mL 10F.9G2 (solid line) or rat IgG2b isotype control (dash line) and goat anti-rat IgG-FITC or goat anti-rat IgG-PE and analyzed by flow cytometry. 10F.9G2 was observed to bind to CHO-mPD-L1 and EL4-mPD-L1 cells but not the mock-transfected cells, indicating the specificity of 10F.9G2 for mPD-L1.
FACs Analysis
After detachment, ECs were washed twice with PBS and resuspended in a blocking solution (10% rabbit serum in PBS + 100 mg/mL Goat IgG) for 15 minutes at 4 °C. Thereafter, either PD-L1 mAb (10F.9G2) or rat IgG2b was added to the cells at a concentration of 1 μg/106 cells. Cells were washed and resuspended in PBS (200 μL) containing 10% rabbit serum. Biotin-labeled anti-rat IgG2b at 1 μg/ 106 cells was added to the cells and allowed to incubate for 30 minutes at 4 °C. Subsequently, cells were washed, resuspended in PBS, and incubated in PE-labeled strepavidin (1 μg/106 cells) for 30 minutes at 4 °C. Cells were washed in PBS, fixed in 1% gluteraldehyde, and analyzed by using the flow cytometer (FACs Scan, Becton Dickinson, Waltham, MA).
RNA Extraction and Quantitative RT-PCR
Total RNA was extracted from EC monolayers by enzymatic lysis of ECs, and contaminants were removed by using Qiagen RNeasy kits (Qiagen Inc., Valencia, CA) according to manufacturer’s specifications. Isolated RNA was treated with RQ1 Dnase I (Promega, Madison, WI) and Rnase inhibitor (Five Prime Three Prime Inc., Boulder, CO) for 30 minutes at 37 °C. RNA cleanup was performed by using Qiagen Rneasy Minicolumns (Qiagen Inc.) according to manufacturer’s specification. rTth DNA polymerase was used to reverse transcribe and amplify 50 ng of total RNA by using the Perkin Elmer Taqman EZ RT-PCR kit (Perkin Elmer Applied Biosystems, Foster City, CA) with gene-specific forward and reverse primers and flourescently labeled probe at the 5′ end with 6-carboxy-flourescein (6-FAM). Primer and probe sequences were generated by using Primer Express software (Perkin Elmer, Boston, MA). The forward and reverse primers for murine PD-L1 were TGCGGACTACAAGCGAATCA and GATCCACGGAAATTCTCTGGTT, respectively. Duplicate samples were reverse transcribed for 30 minutes at 60 °C, followed by 40 cycles of amplification for 15 seconds at 95 °C and 1 minute at 60 °C using the ABI Prism 7700 sequence detection system as described by the manufacturer (Perkin Elmer). Gene-specific amplification was detected as a fluorescent signal during the amplification cycle. Gene-specific message quantification was evaluated by fluorescence intensity levels of unknown samples compared to fluorescence intensity of known mRNA levels. Amplification of a housekeeping gene, murine GAPDH, was performed on all samples to account for RNA levels variations. All genes were normalized to GAPDH mRNA levels, and levels of gene-specific messages were depicted as normalized Taqman units as determined by standard curve.
Radio-Iodination of Monoclonal Antibody
PD-L1 mAb (10F.9G2) and rat IgG2b were labeled with 125I and 131I (Du Pont NEN, Boston, MA), respectively, by using the iodogen method (7,8,10,14). In brief, iodogen (Sigma T-0656) was dissolved in chloroform at a concentration of 0.5 mg/mL, and 1 mL of this solution was placed in glass tubes and evaporated under nitrogen. A 1-mg sample of mAb was added to each iodogen-coated tube, and either 125I or 131I with a total activity of 2 mCi was added. The mixture was incubated in ice, with periodic stirring for 20 minutes. The total volume was brought to 2.5 mL by adding phosphate-buffered saline (PBS, pH = 7.4). Thereafter, the coupled mAb was separated from free 125I or 131I by gel filtration on a Sephadex PD-10 column. The column was equilibrated and then eluted with PBS containing 1% bovine serum albumin. Two fractions of 2.5 mL were collected, the second of which contained the radiolabeled antibody. Finally, previous studies have shown that mAbs retain their functional activity after radio-iodination as evidenced by a similar effectiveness of labeled and unlabeled mAbs to block leukocyte adherence in rat mesenteric venules (30).
Animal Procedures
Male C57Bl/6 wild-type and IFN-γ-deficient mice (background, C57Bl/6) (N = 35) (8–12 weeks of age) were used in the radiolabeled antibody experiments. The mice were anesthetized by intraperitoneal (i.p.) injection of a mixture of ketamine and xylazine at a dose of 150 mg/kg and 7.5 mg/kg, respectively. The left jugular vein and abdominal aorta were cannulated with polyethylene tubing (PE-10). For assessing PD-L1 expression, a mixture of 10 μg of 125I labeled PD-L1 mAb + 40 μg unlabeled PD-L1 mAb, and a dose (0.5–15.0 μg) of 131I labeled rat IgG2b was injected through the jugular vein catheter. A blood sample was obtained through the carotid artery catheter at 5 minutes after injection of the mAb mixture. The animals were then heparinized (40 U sodium heparin) and rapidly exsanguinated, by perfusion of bicarbonate buffered saline (BBS) through the jugular vein catheter with simultaneous blood withdrawal through the abdominal aorta catheter. This was followed by perfusion of 10 mL of BBS through the abdominal aorta catheter after severing the inferior vena cava at the thoracic level. Entire organs were harvested and weighed.
Calculation of PD-L1 Expression
The method for calculating the expression of PD-L1 has been described previously for other EC molecules (7). In brief, the 125I labeled PD-L1 mAb and the 131I labeled rat IgG2b activities in different tissues and in 50-μL samples of cell-free plasma were counted in a 14800 Wizard 3 gamma-counter (Wallac, Turku, Finland), with automatic correction for background activity and spillover. The total injected activity in each experiment was calculated by counting a 4-μL sample of the radiolabeled mAb mixture. The radioactivities remaining in the tube used to mix the mAbs and the syringe used to inject the mixture were subtracted from the total injected activity. PD-L1 expression was calculated by subtracting the accumulated activity per gram tissue of the 131I labeled rat IgG2b from the activity of the 125I labeled PD-L1 mAb. The difference in accumulated activities was multiplied by the ratio of 125I/131I plasma activities and the total amount of PD-L1 mAb injected and expressed as μg of PD-L1 mAb per gram of tissue.
To compare the relative levels of PD-L1 between tissues, the ratio of PD-L1 to PECAM-1 was calculated by using previously reported values of 125I labeled PECAM-1 accumulation in murine tissues (9). PECAM-1 expression on ECs was observed to be invariant with tissue activation by LPS (14) and TNF-α (9) and correlated to the level of EC surface area within tissues (9). In brief, values of mean ± standard error for PD-L1 expression (μg of PD-L1 Ab/gram tissue) for constitutive and IL-12 activation at 72 hours and values of mean ± standard error [obtained from (9)] for constitutive PECAM-1 expression (μg of PECAM-1 Ab/gram tissue) were used to calculate the ratio of PD-L1 to PECAM-1 ± 95% confidence intervals, as described by Tallarida and Murray (34). Constitutive values of PECAM-1 expression for tissues were used for all calculations because PECAM-1 levels did not change after cytokine activation (9).
Experimental Protocols
Constitutive and IFN-induced expression of PD-L1 on MS1 ECs in vitro was assessed by culturing MS1 ECs in 48-well tissue culture plates and allowing them to grow to confluency. Once confluent, ECs were treated with media alone or media containing IFN-α (1000 U/mL), -β (1000 U/mL), and -γ (100 ng/mL) for various time points. After a period of activation, 1 μg of 125I labeled anti-PD-L1 mAb + 1 μg of 131I labeled Rat IgG2b was added to each well and incubated for 30 minutes at 37 °C. Cells were washed three times with PBS, removed by brief trypsinization, and placed in tubes to measure radioactivity. The percentage of 131I labeled Rat IgG2b was subtracted from the 125I labeled anti-PD-L1 mAb, and the total amount of PD-L1 mAb (ng) per cm2 surface area of ECs was determined.
Constitutive and IL-12-induced expression of PD-L1 were assessed by injecting a mixture of radiolabeled binding and nonbinding mAbs. The mixture consisted of 10 μg of 125I labeled anti-PD-L1 mAb, 40 μg unlabeled PD-L1 mAb, and a dose of 131I labeled rat IgG2b ranging from 5 to 15 μg. A variable dose of nonbinding mAb was used to compensate for the decay in activity of the 131I isotope, which has a half-life of approximately 8 days. The magnitude of IL-12-induced PD-L1 expression in tissues was determined in wild-type mice receiving 10 μg of recombinant murine IL-12 (in 0.5 mL PBS) or vehicle (0.5 mL PBS) i.p. PD-L1 expression was determined at 0 (n = 5), 24 (n = 5), 48 (n = 5), 72 (n = 5), and 120 (n = 5) hours after IL-12 administration. PD-L1 expression was determined in IFN-γ-deficient mice receiving 10 μg of recombinant murine IL-12 (in 0.5 mL PBS) or vehicle (0.5 mL PBS), i.p. at 0 (n = 5) and 72 (n = 5) hours after administration. Specificity of the PD-L1 mAb for its ligand is supported by evidence showing that the accumulation of radiolabeled PD-L1 mAb in tissues can be displaced by the simultaneous administration of unlabeled PD-L1 mAb and that the PD-L1 mAb inhibits the binding of a PD1-Ig fusion protein to MS1 ECs (data not shown).
Immunohistochemistry
Brains from control and IL-12-challenged mice brains were cryopreserved in Optimal Cutting Temperature (OCT) embedding medium (Tissue Tek, Miles Inc., Elkhart, IN) by liquid nitrogen-cooled isopentane method. Tissues were sectioned at 5 μm on a Hacker/Bright cryomicrotome (Model OTF, Hacker Instruments, Fairfield, NJ), placed on superfrost plus slides (Fischer Scientific, Inc.), and fixed for 10 minutes in acetone at −20 °C. Tissues were assayed immunohistochemically for the presence and localization of PDL-1 and von Willebrand Factor (vWF) (Dako Corporation, Carpinteria, CA). The vWF antibody and rabbit IgG were used at a concentration of 3.8 μg/mL, and the PDL-1 and Rat IgG2b were used at a concentration of 2.0 μg/mL.
Sections were first washed three times in PBS for 2 minutes and blocked with a 5% nonimmune serum from the species of which the secondary antibody was derived. Sections were exposed for 1 hour to PD-L1 mAb or Rat IgG2b. Thereafter, a fluorescein-conjugated secondary antibody (Jackson Immuno Research Laboratories, Inc., West Grove, PA) was applied to the sections for 30 minutes. Sections were washed three times in PBS for 2 minutes and incubated for 1 hour with the vWF antibody or rabbit IgG. Then, tissue sections were incubated with Texas red-conjugated secondary antibody (Jackson ImmunoResearch Laboratories, Inc.) for 30 minutes. Tissue sections were washed in PBS and mounted with Vectashield mounting media (Vector Laboratories, Burlingame, CA) and evaluated by using a Nikon Eclipse E800M fluorescent microscope for the colocalization of PD-L1 and vWF.
Statistical Analysis
PD-L1 expression (mg mAb/gram tissue) in a tissue after various periods of Il-12 challenge was compared by ANOVA, followed by Bonferroni’s test for multiple comparisons. Statistical significance was set at p < 0.05. To assess statistical significance in PD-L1, the ratio of PD-L1 to PECAM-1 expression between tissues, the 95% confidence intervals were calculated according to Tallarida and Murray (34). The ratio of PD-L1 to PECAM-1 expression between tissues was determined to be significantly different, p < 0.05, if the 95% confidence intervals did not overlap.
RESULTS
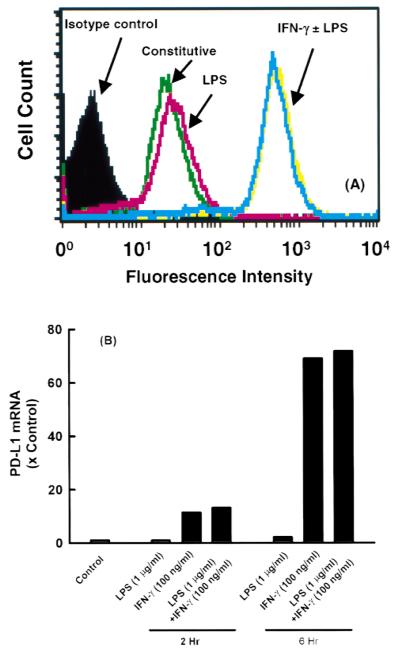
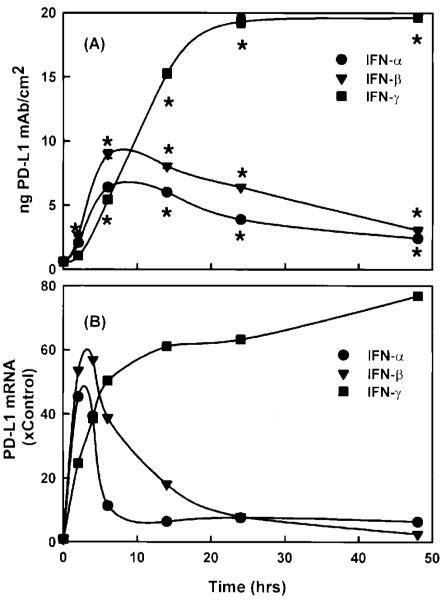
Figure 2 illustrates the presence of PD-L1 on the surface of resting MS1 ECs. Treatment with IFN-γ (0.01 to 100 ng/mL) resulted in a dose-dependent increase in PD-L1 expression at 24 hours (Fig. 2). In contrast, treatment with LPS (1 μg/mL) for 24 hours had no effect on expression. LPS, in combination with IFN-γ, led to additional increase in PD-L1 expression, compared to IFN-γ alone (Fig. 3A). The elevation in PD-L1 surface expression after IFN-γ activation was preceded by a rise in PD-L1 mRNA at 2 and 6 hours, as detected by RT-PCR (Fig. 3B). LPS had no effect on PD-L1 mRNA levels alone and did not affect the IFN-γ-induced elevations in PD-L1 mRNA. In addition, TNF-α did not induce an elevation in the level of PD-L1 mRNA (data not shown). Although LPS and TNF-α did not induce PD-L1 expression on ECs, LPS and TNF-α were effective at upregulating ICAM-1 and VCAM-1 expression on ECs in this study (data not shown). Figure 4A illustrates the expression of PD-L1 on MS1 ECs after activation with IFN-α (1000 U/mL), IFN-β (1000 U/mL), or IFN-γ (100 ng/mL). Within 2 hours, IFN-α and -β induced elevations of PD-L1 expression, with peak expression of PD-L1 occurring 6 hours after activation. Thereafter, PD-L1 expression declined toward baseline values over 48 hours. In contrast, IFN-γ induced a peak expression of PD-L1 at 24 hours and remained at this level over 48 hours. Figure 4B illustrates the kinetics of PD-L1 mRNA levels on MS1 ECs after activation of IFN-α (1000 U/mL), IFN-β (1000 U/mL), and IFN-γ (100 ng/mL). Within 1 hour after activation with IFN-α, -β, and -γ, an increase in the level of PD-L1 mRNA was observed. Peak levels of PD-L1 were observed between 2 and 4 hours after activation with IFN-α and -β and at 14 hours after activation with IFN-γ. Although PD-L1 mRNA levels remained elevated during 48 hours with IFN-γ treatment, IFN-α and -β-induced PD-L1 mRNA returned toward baseline by 14 hours after activation.
Figure 2.
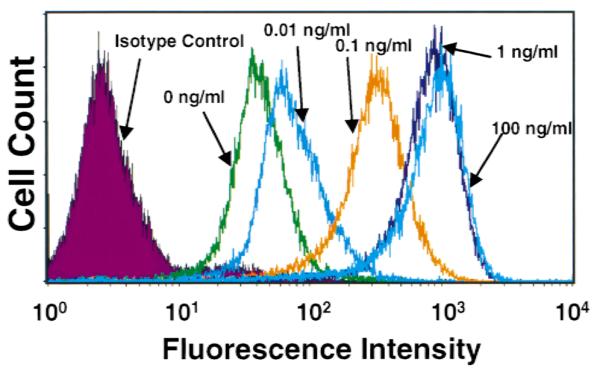
Dose-response effect of IFN-γ-induced PD-L1 expression on microvascular endothelial cells. FACs analysis of PD-L1 expression on MS1 ECs demonstrates an appreciable level of PD-L1 present on resting ECs. At 24 hours after activation, IFN-γ was observed to elevate the expression of PD-L1 in a dose-dependent manner.
Figure 3.
PD-L1 expression on microvascular endothelial cells after activation with LPS and IFN-γ. (A) MS1 ECs were grown to confluency in 12-well tissue culture plates and treated with IFN-γ (100 ng/mL) and/or LPS (1 μg/ mL) for 24 hours, and the expression of PD-L1 was measured by using FACs analysis. (B) Relative levels of PD-L1 mRNA in MS1 ECs after 2 and 6 hours of activation with IFN-γ (100 ng/mL) and/or LPS (1 μg/mL). LPS had no effect on PD-L1 mRNA levels.
Figure 4.
Kinetics of (A) PD-L1 surface expression and (B) PD-L1 mRNA in MS1 ECs after activation with IFN-α, -β, and -γ. Confluent MS1 ECs in 48-well tissue culture plates were treated with IFN-α (1000 U/mL), IFN-β (1000 U/mL), and IFN-γ (100 ng/mL), and PD-L1 mRNA and PD-L1 surface expression was measured by using RT-PCR and radiolabeled mAbs, respectively, as described in Materials and Methods. Values are means ± SEM and represent n = 4. *Significantly different from constitutive levels (t = 0), p < 0.05.
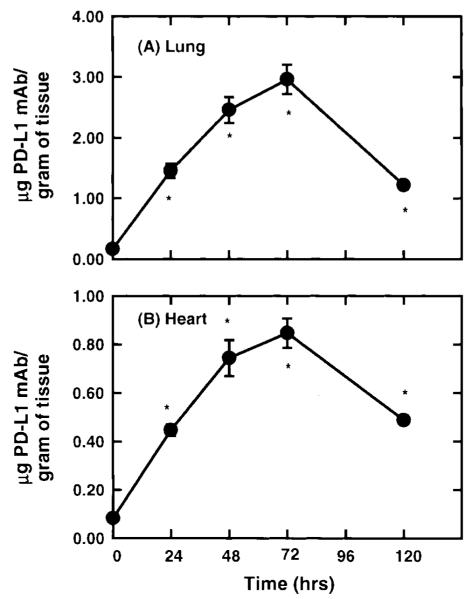
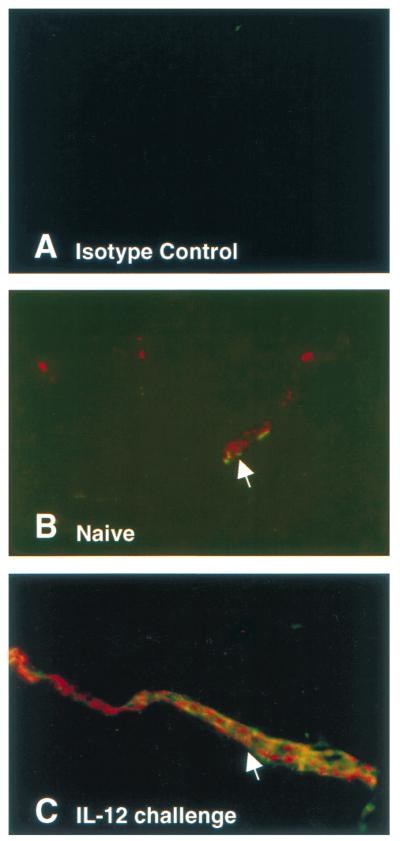
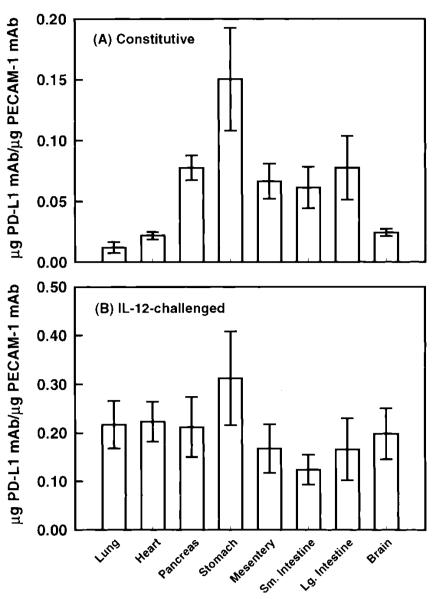
Figure 5 shows the expression of PD-L1 in the lung and the heart in wild-type mice challenged with Il-12. Given that IFN-γ was observed to regulate PD-L1 expression in vitro, Il-12 was selected as an agonist to induce PD-L1 in vivo because IL-12 has been shown to induce IFN-γ production in mice within 12 hours after administration (12). Under unstimulated conditions, a significant level of PD-L1 mAb was observed to accumulate, suggesting the presence of constitutive levels of PD-L1 on vascular endothelium. This is supported by observations of PD-L1 staining on ECs from unstimulated murine brains, compared to isotype controls (Fig. 6A and B). A significant increase in the accumulation of PD-L1 mAb was measured 24 hours after IL-12 challenge, with maximum levels of PD-L1 expression occurring at 48 hours and remaining at this level during 72 hours. In IL-12-challenged mice, PD-L1 was observed to expresses solely on ECs in the brain, as determined by PD-L1 colocalization with vWF, a cell marker for vascular ECs (Fig. 6C). The relative increase in PD-L1 expression in the lung and heart were 20- and 10-fold, respectively, over unstimulated tissue levels. Thereafter, the level of PD-L1 expression was observed to significantly decline at 120 hours after IL-12 challenge but remained elevated compared to baseline values. In contrast, PD-L1 expression in the pancreas and mesentery reached peak levels by 24 hours after IL-12 challenge; however, the relative increase in PD-L1 levels was only two- to threefold in these tissues (Table 1). However, in the stomach and the small intestine, a significant accumulation of PD-L1 mAb was not detected until 48 and 72 hours after IL-12 challenge (Table 1). To compare the expression of PD-L1 under baseline and IL-12-challenge conditions, the accumulation of PD-L1 mAb per gram of tissue was normalized to the accumulation of PECAM-1 mAb in the tissue, as measured by Eppihimer et al. (9). In this study, the accumulation of PECAM-1 was observed to correlate with endothelial surface area in a tissue, and the level of PECAM-1 did not change after cytokine challenge. In general, organs of the gastrointestinal tract had a significantly greater level (relative to PECAM-1 values) of PD-L1 expression under unstimulated conditions, with the stomach having the greatest baseline level compared to all tissues examined (Fig. 7). In contrast, at 72 hours after IL-12-challenge, the level of PD-L1 expression was very similar among all tissues examined. However, the small intestine was observed to have two- to threefold less IL-12-induced PD-L1 expression compared to tissues such as the lung, heart, and stomach.
Figure 5.
Kinetics of PD-L1 expression in the lung and heart of IL-12-challenged wild-type mice was determined after the administration of radiolabeled PD-L1 mAb. Within 24 hours after IL-12 challenge, a significant accumulation of PD-L1 mAb was measured in the heart and lung (p < 0.05). Peak expression of PD-L1 was observed between 48 and 72 hours after IL-12 challenged. By 120 hours, PD-L1 expression was observed to decline but remained significantly above baseline values (p < 0.05). Values shown are means ± SEM.
Figure 6.
Immunohistochemical analysis of PD-L1 expression in unstimulated and IL12-challenged murine brains. (A) Frozen tissues sections of unstimulated brains from mice were stained with rat IgG2b and rabbit Ig. (B) Unstimulated and Il-12-challenged brains were stained for the presence of PD-L1 (green) and vWF (red). Colocalization of PD-L1 and vWF indicate that PD-L1 is expressed solely on ECs in these tissues, as indicated by white arrows. (C) A more intense fluorescent intensity of PD-L1 (green) was observed in vessels from IL-12-challenged mice.
Table 1.
PD-L1 expression in various tissues in wild-type and IFN-γ-deficient mice under control conditions and after IL-12-challenge
| Wild-type mice |
IFN-γ-deficient mice |
||||||
|---|---|---|---|---|---|---|---|
| Tissue | Constitutive | IL-12 24 hr | IL-12 48 hr | IL-12 72 hr | IL-12 120 hr | Constitutive | IL-12 72 hr |
| Pancreas | 0.096 ± 0.004 | 0.214 ± 0.006* | 0.241 ± 0.017* | 0.263 ± 0.033* | 0.164 ± 0.015 | 0.101 ± 0.018 | 0.088 ± 0.005 |
| Mesentery | 0.100 ± 0.007 | 0.230 ± 0.027* | 0.263 ± 0.041* | 0.252 ± 0.029* | 0.236 ± 0.012* | 0.133 ± 0.016 | 0.106 ± 0.016 |
| Stomach | 0.211 ± 0.022 | 0.325 ± 0.013 | 0.406 ± 0.039* | 0.438 ± 0.052* | 0.320 ± 0.036 | 0.220 ± 0.024 | 0.211 ± 0.014 |
| Small intestine | 0.173 ± 0.013 | 0.257 ± 0.022 | 0.277 ± 0.025 | 0.350 ± 0.018 | 0.275 ± 0.039 | 0.135 ± 0.010 | 0.104 ± 0.022 |
| Large intestine | 0.085 ± 0.006 | 0.158 ± 0.004* | 0.194 ± 0.025* | 0.182 ± 0.020* | 0.133 ± 0.005 | 0.091 ± 0.013 | 0.082 ± 0.009 |
| Brain | 0.006 ± 0.001 | 0.022 ± 0.001* | 0.035 ± 0.003* | 0.049 ± 0.005* | 0.024 ± 0.001* | 0.007 ± 0.001 | 0.006 ± 0.001 |
Value is significantly different from constitutive values, p < 0.05.
Figure 7.
Ratio of PD-L1 to PECAM-1 expression in various tissues under control conditions and after IL-12-challenge. Under control conditions, the organs of the gastrointestinal tract were observed to three- to sixfold greater expression of PD-L1 than the lung and heart, as evidence of a greater PD-L1 to PECAM-1 ratio. After IL-12-challenge (72 hours), an invariance in PD-L1 expression was observed between tissues, suggesting that the peak expression of PD-L1 was not different among tissues. Values shown are means ± 95% confidence intervals.
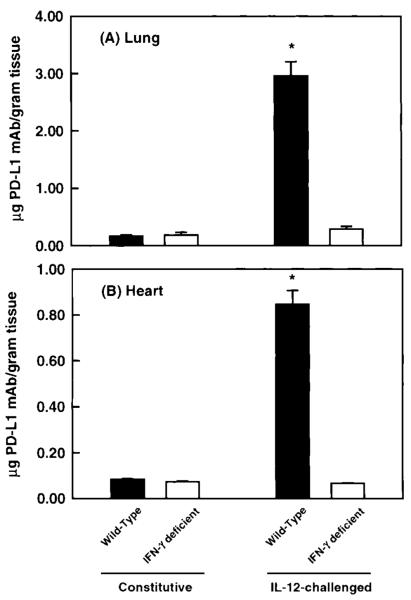
To elucidate the regulation of PD-L1 expression in vivo, the accumulation of PD-L1 mAb was measured in tissues of unstimulated and IL-12-challenged IFN-γ-deficient mice. As shown in Fig. 8 and Table 1, constitutive levels of PD-L1 were not significantly different between tissues of wild-type and IFN-γ-deficient mice, suggesting that basal expression of PD-L1 is not dependent on IFN-γ. After IL-12 challenge, the accumulation of PD-L1 mAb in tissues of wild-type increased significantly, whereas no accumulation of PD-L1 mAb above baseline values was observed in tissues from IL-12-challenged IFN-γ-deficient mice. These data show that the production of IFN-γ in mice after IL-12 challenge is responsible for the upregulation of PD-L1 expression on endothelial cells in vivo.
Figure 8.
Constitutive and IL-12-induced expression of PD-L1 in wild-type and IFN-γ deficient mice after the administration of a radiolabeled PD-L1 mAb. In comparison, the constitutive expression of PD-L1 was not significantly different between wild-type and IFN-γ-deficient mice. However, administration of IL-12 induced a significant accumulation of PD-L1 mAb in wild-type mice. In contrast, IL-12 administration had no effect on PD-L1 expression in IFN-γ-deficient mice, suggesting that IFN-γ was responsible for mediating the elevation in PD-L1 expression in wild-type mice. Values shown are means ± SEM.
DISCUSSION
With the recent identification of a B7-like immuno-inhibitory molecule on APCs, PD-L1, (11,22), and studies showing the ability of ECs to inhibit T-cell proliferation (18,19,27), transmigration (25), and IL-2 secretion (19), we hypothesized that ECs may express PD-L1 and potentially function as a T-cell inhibition signal to limit the extent of the immune response at sites of inflammation. To address the expression of PD-L1 on microvascular and its regulation after cytokine challenge, expression of PD-L1 mRNA and surface protein on endothelial cells were measured and compared with the expression of PD-L1 in vivo as measured by using a radiolabeled mAb technique.
In our experiments, PD-L1 is found on resting (unstimulated) ECs and is upregulated with IFN-α, -β, and -γ. Activation with IFN-α and -β resulted in similar kinetics of PD-L1 surface expression and mRNA levels, whereas treatment of ECs with IFN-γ produced a slower rise but greater in magnitude expression of PD-L1 than IFN-α and -β. These differences probably arise because IFN-α/IFN-β bind to the type 1 IFN receptor and IFN-γ binds to the type 2 IFN receptor (31).
MS1 cells were also examined for the expression of B7-1/B7-2, because PD-L1 is a member of the B7-family. Under resting conditions, a nominal expression of B7-1 mRNA was observed in MS1 ECs by RT-PCR and was not inducible after treatment with LPS + IFN-γ (data not shown). However, this nominal expression of B7-1 mRNA did not correspond to B7-1 expression on the EC surface, as evidenced by an absence of staining using FACs analysis. B7-2 mRNA and protein expression were not detected in MS1 ECs under resting conditions and after activation with LPS + IFN-γ (data not shown). In contrast, other APCs, such as monocytes and dendritic cells, expressed B7-1/B7-2 and PD-L1 when stimulated with IFN-γ (11). Freeman et al. (11) and Latchman et al. (22) showed that the inhibitory effects of PD-L1 on T-cell activation was dependent on the strength of the T-cell receptor (TCR) and CD28 signals, where high levels of CD28 or TCR signals were dominant and abolished the inhibition produced by engagement of PD-1/ PD-L1. Thus, the relative levels of inhibitory PD-L1 and costimulatory B7-1/B7-2 on APCs may determine the effect on T-cell activation. Therefore, PD-L1 on ECs, which do not express B7-1/B7-2, may provide a greater inhibitory effect on T cells compared to other APCs that coexpress B7-1/B7-2.
Recently, a second ligand for PD1, PD-L2, was reported. It is conceivable that PD-L2 and other ligands for PD1 may act in parallel to PD-L1 as redundant pathways. However, an absence of PD-L2 mRNA in murine endothelial cells in vitro was observed under resting and activated conditions similar to those that upregulate PD-L1 (unpublished observations). In addition, binding of a PD1 fusion protein to murine endothelial cells in vitro was inhibited by a PD-L1 Ab, suggesting that PD-L1 is the ligand for PD1 on murine endothelial cells. Although PD-L2 was not observed to be present on murine ECs in vitro, it does not exclude the possibility that ECs express other molecules capable of modulating T-cell activation that are redundant to PD-L1.
This is the first study to show the expression and regulation of PD-L1 in vivo on microvascular endothelium after cytokine challenge and to delineate the differences in PD-L1 expression between tissues. In general, a constitutive level of PD-L1 could be detected in the tissues by using both a radiolabeled PD-L1 mAb and immunohistochemistry. This finding agrees favorably with in vitro data in this study showing the presence of constitutive levels of PD-L1 mRNA and surface protein staining. Furthermore, the lung and heart exhibited the greatest accumulation of PD-L1 mAb per gram of tissue under control conditions, which coincides with observations that the lung and heart had the greatest level of PD-L1 mRNA (11) and suggests that the source of PD-L1 mRNA in that study may be from vascular endothelium. PD-L1 expression was significantly elevated within 24 hours of IL-12 challenge, with peak levels occurring between 48 and 72 hours. This study clearly shows that level of constitutive expression and the extent of upregulation of PD-L1 on vascular endothelium is variable among tissues. Clearly in the lung and heart, there exists a lesser basal expression of PD-L1 compared to tissues of the gastrointestinal tract. Although PD-L1 expression is elevated severalfold more in the lung and heart, the peak expression of PD-L1 was invariant between tissues, as evidenced by the similarity in the ratios of PD-L1 to PECAM-1 expression. Although the ratio of PD-L1 to PECAM-1 expression in the lung after cytokine challenge was approximately 0.22 and is 4–10 greater than that observed for the ratio of P-selectin, E-selectin, and VCAM-1 to PECAM-1 in the lung (9), comparisons between the relative density of PD-L1 and these other cell adhesion molecules to PECAM-1 cannot be made because the distribution of PD-L1 within the vascular network is unknown. For example, the lower values of the ratio of selectins to PECAM-1 compared to PD-L1, VCAM-1, and ICAM-1 may reflect that selectins are primarily restricted to postcapillary venules, compared to the expression of other EC molecules on arterioles and capillaries. It is also arguable that PD-L1 on ECs can act only if T cells are adherent to the endothelium, indicating that PD-L1 density on postcapillary venules may be more relevant than in other segments of the vascular network.
In animal cell systems, ECs have induced a hyporesponsiveness in T-cell activation, as evidenced by an inhibition of IL-2 production (19) and/or cell proliferation (18,27). Con A-stimulated cells cultured with rat corneal ECs were observed to produce significantly less IL-2 than activated T cells alone (19). ECs had no effect on T-cell expression of IL-2 receptor or their ability to respond to exogenous IL-2. Although IFN-γ was not measured in this study, Con-A is a potent stimulator of IFN-γ secretion, suggesting that IFN-γ secreted from Con-A-activated T cells would be sufficient to induce the expression of PD-L1 on the ECs. Because engagement of PD-L1 with its receptor inhibits IL-2 secretion from activated T cells and T-cell proliferation (11), it is possible that the hyporesponsiveness induced by ECs may function through the PD-L1/PD-1 pathway. Furthermore, the inhibition of T-cell proliferation by murine and rat ECs may also be attributed to engagement of PD-L1, because PD-L1 has been shown to inhibit T-cell proliferation. In contrast, studies using human cell systems, in particular HUVECs, have shown that ECs induce a hyperesponsiveness in T cells, where HUVECs have been shown to act as costimulators to T cells by increasing IFN-γ (3) and IL-2 production (24) and/or cell proliferation (6). A possible explanation for these differences may be the origin of the ECs, umbilical vein versus lung and cornea. Another explanation for the absence of an EC-induced hyporesponsiveness on HUVECs may be associated with the relative level of PD-L1 on human ECs. Future studies examining the expression and role of the PD-L1 pathway on human ECs, HUVECs, as well as microvascular, are warranted.
Although IFN-γ has generally been recognized as a proinflammatory mediator, several studies have suggested that IFN-γ may act to induce immunosuppression. For example, during experimental autoimmune encephalomyelitis (EAE), mice deficient of IFN-γ (21) or administered anti-IFN-γ mAbs (2,5) had exacerbated disease symptoms, whereas administration of exogenous IFN-γ reduced the incidence and severity of EAE (15). In addition, mAbs directed against IFN-γ have been shown to increase the severity of arthritic lesions during collagen-induced arthritis (36). In mice deficient of the IFN-γ receptor, the onset of CIA is more rapid and with a greater severity, compared to wild-type mice (35). In these studies, CIA-induced mice deficient of IFN-γ receptor had a significant increase in IL-2 secretion, whereas IL-2 levels in CIA-induced wild-type mice were not significantly different from control mice (35). It is reasonable that in IFN-γ-deficient mice or suppressed mice, the level of inducible PD-L1 is severely reduced and may lead to less inhibition of T-cell activation by the PD-L1/PD-1 pathway and, therefore, contribute to the severity of the disease. Recently, PD-1-deficient mice that exhibit an auto-immune-like disease characterized by infiltration of inflammatory cells into tissues have been developed (15). Thus, it is conceivable that the expression of PD-L1 on ECs may be important in regulating a balanced immune response, where in its absence or dysfunction there is a tendency for the development of immune-related diseases.
However, the function of PD-L1 on ECs remains to be determined, and although one may speculate that PD-L1 on ECs has an inhibitory effect on T-cell activation and/or effector function, it cannot be excluded that PD-L1 on ECs functions in some capacity, such as regulating cell adhesion and/or transmigration, that is significantly different from the function of PD-L1 on other cell types.
Acknowledgments
Supported by National Institutes of Health grants AI39671, AI41584, and CA84500 (GF).
REFERENCES
- 1.Arbiser JL, Moses MA, Fernandez CA, Ghiso N, Cao Y, Klauber N, et al. Oncogenic H-ras stimulates tumor angiogenesis by two distinct pathways. Proc Natl Acad Sci USA. 1997;94:861–866. doi: 10.1073/pnas.94.3.861. [DOI] [PMC free article] [PubMed] [Google Scholar]
- 2.Billiau A, Heremans H, Vandekerckhove F, Dijkmans R, Sobis H, Meulepas E, Carton H. Enhancement of experimental allergic encephalomyelitis in mice by antibodies against IFN-gamma. J Immunol. 1988;140:1506–1510. [PubMed] [Google Scholar]
- 3.Briscoe DM, Henault LE, Geehan C, Alexander S, Lichtman AH. Human endothelial cell costimulation of T cell IFN-gamma production. J Immunol. 1997;159:3247–3256. [PubMed] [Google Scholar]
- 4.Dalton DK, Pitts-Meek S, Keshav S, Figari IS, Bradley A, Stewart TA. Multiple defects of immune cell function in mice with disrupted interferon-g genes. Science. 1993;259:1739–1742. doi: 10.1126/science.8456300. [DOI] [PubMed] [Google Scholar]
- 5.Duong TT, St Louis J, Gilbert JJ, Finkelman FD, Strejan GH. Effect of anti-interferon-gamma and anti-interleukin-2 monoclonal antibody treatment on the development of actively and passively induced experimental allergic encephalomyelitis in the SJL/J mouse. J Neuroimmunol. 1992;36:105–115. doi: 10.1016/0165-5728(92)90042-j. [DOI] [PubMed] [Google Scholar]
- 6.Epperson DE, Pober JS. Antigen-presenting function of human endothelial cells: direct activation of resting CD8 T cells. J Immunol. 1994;153:5402–5412. [PubMed] [Google Scholar]
- 7.Eppihimer MJ, Granger DN. In vivo measurements of endothelial cell adhesion molecule expression. Methods Enzymol. 1999;301:14–22. doi: 10.1016/s0076-6879(99)01064-2. [DOI] [PubMed] [Google Scholar]
- 8.Eppihimer MJ, Russell J, Anderson DC, Wolitzky BA, Granger DN. Endothelial cell adhesion molecule expression in gene-targeted mice. Am J Physiol. 1997;273:H1903–H1908. doi: 10.1152/ajpheart.1997.273.4.H1903. [DOI] [PubMed] [Google Scholar]
- 9.Eppihimer MJ, Russell J, Langley R, Vallien G, Anderson DC, Granger DN. Differential expression of platelet-endothelial cell adhesion molecule-1 (PECAM-1) in murine tissues. Microcirculation. 1998;5:179–188. [PubMed] [Google Scholar]
- 10.Eppihimer MJ, Wolitzky B, Anderson DC, Labow MA, Granger DN. Heterogeneity of E- and P-selectins in vivo. Circ Res. 1996;79:560–569. doi: 10.1161/01.res.79.3.560. [DOI] [PubMed] [Google Scholar]
- 11.Freeman GJ, Long AJ, Iwai Y, Bourque K, Chernova T, Nishimura H, et al. Engagement of the PD-1 immunoinhibitory receptor by a novel B7 family member leads to negative regulation of lymphocyte activation. J Exp Med. 2000;192:1027–1034. doi: 10.1084/jem.192.7.1027. [DOI] [PMC free article] [PubMed] [Google Scholar]
- 12.Gately MK, Warrier RR, Honasoge S, Carvajal DM, Faherty DA, Connaughton SE, et al. Administration of recombinant IL-12 to normal mice enhances cytolytic lymphocyte activity and induces production of IFN-gamma in vivo. Int Immunol. 1994;6:157–167. doi: 10.1093/intimm/6.1.157. [DOI] [PubMed] [Google Scholar]
- 13.Hancock WW, Sayegh MH, Zheng XG, Peach R, Linsley PS, Turka LA. Costimulatory function and expression of CD40 ligand, CD80, and CD86 in vascularized murine cardiac allograft rejection. Proc Natl Acad Sci USA. 1996;93:13967–13972. doi: 10.1073/pnas.93.24.13967. [DOI] [PMC free article] [PubMed] [Google Scholar]
- 14.Henninger DW, Panes J, Eppihimer MJ, Russell J, Gerritsen M, Anderson DC, et al. Cytokine-induced VCAM-1 and ICAM-1 expression in different organs of the mouse. J Immunol. 1997;158:1825–1832. [PubMed] [Google Scholar]
- 15.Heremans H, Dillen C, Groenen M, Martens E, Billiau A. Chronic relapsing experimental autoimmune encephalomyelitis (CREAE) in mice: enhancement by monoclonal antibodies against interferon-gamma. Eur J Immunol. 1996;26:2393–2398. doi: 10.1002/eji.1830261019. [DOI] [PubMed] [Google Scholar]
- 16.Jollow KC, Zimring JC, Sundstrom JB, Ansari AA. CD40 ligation induced phenotypic and functional expression of CD80 by human cardiac microvascular endothelial cells. Transplantation. 1999;68:430–439. doi: 10.1097/00007890-199908150-00016. [DOI] [PubMed] [Google Scholar]
- 17.Karmann K, Hughes CC, Schechner J, Fanslow WC, Pober JS. CD40 on human endothelial cells: inducibility by cytokines and functional regulation of adhesion molecule expression. Proc Natl Acad Sci USA. 1995;92:4342–4346. doi: 10.1073/pnas.92.10.4342. [DOI] [PMC free article] [PubMed] [Google Scholar]
- 18.Kawashima H, Gregerson DS. Corneal endothelial cells block T cell proliferation, but not T cell activation or responsiveness to exogenous IL-2. Curr Eye Res. 1994;13:575–585. doi: 10.3109/02713689408999891. [DOI] [PubMed] [Google Scholar]
- 19.Kawashima H, Prasad SA, Gregerson DS. Corneal endothelial cells inhibit T cell proliferation by blocking IL-2 production. J Immunol. 1994;153:1982–1989. [PubMed] [Google Scholar]
- 20.Knolle PA, Schmitt E, Jin S, Germann T, Duchmann R, Hegenbarth S, et al. Induction of cytokine production in naive CD4(+) T cells by antigen-presenting murine liver sinusoidal endothelial cells but failure to induce differentiation toward Th1 cells. Gastroenterology. 1999;116:1428–1440. doi: 10.1016/s0016-5085(99)70508-1. [DOI] [PubMed] [Google Scholar]
- 21.Krakowski M, Owens T. Interferon-gamma confers resistance to experimental allergic encephalomyelitis. Eur J Immunol. 1996;26:1641–1646. doi: 10.1002/eji.1830260735. [DOI] [PubMed] [Google Scholar]
- 22.Latchman Y, Wood CR, Chernova T, Chaudhary D, Borde M, Chernova I, et al. PD-L2 is a second ligand for PD-I and inhibits T cell activation. Nat Immunol. 2001;2:261–268. doi: 10.1038/85330. [DOI] [PubMed] [Google Scholar]
- 23.Limmer A, Ohl J, Kurts C, Ljunggren HG, Reiss Y, Groettrup M, et al. Efficient presentation of exogenous antigen by liver endothelial cells to CD8+ T cells results in antigen-specific T-cell tolerance. Nat Med. 2000;6:1348–1354. doi: 10.1038/82161. [DOI] [PubMed] [Google Scholar]
- 24.Ma W, Pober JS. Human endothelial cells effectively costimulate cytokine production by, but not differentiation of, naive CD4+ T cells. J Immunol. 1998;161:2158–2167. [PubMed] [Google Scholar]
- 25.Marelli-Berg FM, Frasca L, Weng L, Lombardi G, Lechler RI. Antigen recognition influences transendothelial migration of CD4+ T cells. J Immunol. 1999;162:696–703. [PubMed] [Google Scholar]
- 26.Marelli-Berg FM, Hargreaves RE, Carmichael P, Dorling A, Lombardi G, Lechler RI. Major histocompatibility complex class II-expressing endothelial cells induce allospecific nonresponsiveness in naive T cells. J Exp Med. 1996;183:1603–1612. doi: 10.1084/jem.183.4.1603. [DOI] [PMC free article] [PubMed] [Google Scholar]
- 27.Marelli-Berg FM, Scott D, Bartok I, Peek E, Dyson J, Lechler RI. Activated murine endothelial cells have reduced immunogenicity for CD8+ T cells: a mechanism of immunoregulation? J Immunol. 2000;165:4182–4189. doi: 10.4049/jimmunol.165.8.4182. [DOI] [PubMed] [Google Scholar]
- 28.Murray AG, Libby P, Pober JS. Human vascular smooth muscle cells poorly co-stimulate and actively inhibit allogeneic CD4+ T cell proliferation in vitro. J Immunol. 1995;54:151–161. [PubMed] [Google Scholar]
- 29.Nishimura H, Nose M, Hiai H, Minato N, Honjo T. Development of lupus-like autoimmune diseases by disruption of the PD-1 gene encoding an ITIM motif-carrying immunoreceptor. Immunity. 1999;11:141–151. doi: 10.1016/s1074-7613(00)80089-8. [DOI] [PubMed] [Google Scholar]
- 30.Panes J, Perry MA, Anderson DC, Manning A, Leone B, Cepinskas G, et al. Regional differences in constitutive and induced ICAM-1 expression in vivo. Am J Physiol. 1995;269:H1955–H1964. doi: 10.1152/ajpheart.1995.269.6.H1955. [DOI] [PubMed] [Google Scholar]
- 31.Platanias LC, Fish EN. Signaling pathways activated by interferons. Exp Hematol. 1999;27:1583–1592. doi: 10.1016/s0301-472x(99)00109-5. [DOI] [PubMed] [Google Scholar]
- 32.Savage CO, Hughes CC, Pepinsky RB, Wallner BP, Freedman AS, Pober JS. Endothelial cell lymphocyte function-associated antigen-3 and an unidentified ligand act in concert to provide costimulation to human peripheral blood CD4+ T cells. Cell Immunol. 1991;137:150–163. doi: 10.1016/0008-8749(91)90065-j. [DOI] [PubMed] [Google Scholar]
- 33.Springer TA, Lasky LA. Sticky sugars for selecting. Nature. 1991;349:196–197. doi: 10.1038/349196a0. [DOI] [PubMed] [Google Scholar]
- 34.Tallarida RJ, Murray RB. Manual of Pharmacologic Calculations with Computer Programs. Springer-Verlag; New York: 1987. pp. 1–297. [Google Scholar]
- 35.Vermeire K, Heremans H, Vandeputte M, Huang S, Billiau A, Matthys P. Accelerated collagen-induced arthritis in IFN-gamma receptor-deficient mice. J Immunol. 1997;158:5507–5513. [PubMed] [Google Scholar]
- 36.Williams RO, Williams DG, Feldmann M, Maini RN. Increased limb involvement in murine collagen-induced arthritis following treatment with anti-interferon-gamma. Clin Exp Immunol. 1993;192:323–327. doi: 10.1111/j.1365-2249.1993.tb03399.x. [DOI] [PMC free article] [PubMed] [Google Scholar]


