

Abstract
A fungal colony is a syncytium composed of a branched and interconnected network of cells. Chimerism endows colonies with increased virulence and ability to exploit nutritionally complex substrates. Moreover, chimera formation may be a driver for diversification at the species level by allowing lateral gene transfer between strains that are too distantly related to hybridize sexually. However, the processes by which genomic diversity develops and is maintained within a single colony are little understood. In particular, both theory and experiments show that genetically diverse colonies may be unstable and spontaneously segregate into genetically homogenous sectors. By directly measuring patterns of nuclear movement in the model ascomycete fungus Neurospora crassa, we show that genetic diversity is maintained by complex mixing flows of nuclei at all length scales within the hyphal network. Mathematical modeling and experiments in a morphological mutant reveal some of the exquisite hydraulic engineering necessary to create the mixing flows. In addition to illuminating multinucleate and multigenomic lifestyles, the adaptation of a hyphal network for mixing nuclear material provides a previously unexamined organizing principle for understanding morphological diversity in the more-than-a-million species of filamentous fungi.
Keywords: heterokaryon, hydrodynamics, biological networks
Genetic diversity between individuals is important to the resilience of species (1) and ecosystems (2). However, physical and genetic barriers constrain internal genetic diversity within single organisms: Cell walls limit nuclear movement between cells, whereas separation of germ and somatic cell lines means that diversity created by somatic mutations is not transmitted intergenerationally. However, in syncytial organisms, including filamentous fungi and plasmodial slime molds (3), populations of genetically different and mobile nuclei may share a common cytoplasm (Fig. 1A and Movie S1). Internal diversity may be acquired by accumulation of mutations as the organism grows or by somatic fusion followed by genetic transfer between individuals. For filamentous fungi, intraorganismic diversity is ubiquitous (4, 5). Shifting nuclear ratios to suit changing or heterogeneous environments enhances growth on complex substrates such as plant cell walls (6) and increases fungal virulence (7). Fusion between different fungal individuals is limited by somatic (heterokaryon) compatibility barriers (8), and most internal genetic diversity results from mutations within a single, initially homokaryotic individual (4). However, somatic compatibility barriers are not absolute (9), and exchange of nuclei between heterospecific individuals is now believed to be a motor for fungal diversification (10–12).
Fig. 1.

Dynamics of hH1-GFP and hH1-DsRed nuclear populations in a Neurospora crassa chimera. (A) Two homokaryotic mycelia, one with red-labeled nuclei and one with green-labeled nuclei, freely fuse to form a single chimeric colony (see Movie S1 for nuclear dynamics). (Scale bar, 25 μm.) (B) Nucleotypes become more mixed as the colony grows. We measured genetic diversity in 1D colonies (i.e., having a single well-defined growth direction), using the SD of the proportion of hH1-DsRed nuclei between samples of 130 tip nuclei as an index of mixing (Materials and Methods). Lower SDs mean more uniformly mixed nucleotypes. Nucleotypes may not reflect nuclear genotypes because of histone diffusion, so we also measured the mixing index from conidial chains formed after the mycelium had covered the entire 5-cm agar block (red square and dotted line).
A fungal chimera must maintain its genetic richness during growth. Maintenance of richness is challenging because fungal mycelia, which are made up of a network of filamentous cells (hyphae), grow by extension of hyphal tips. A continual tipward flow of vesicles and nuclei provides the new material needed to generate the new cell wall and populates the space created at hyphal tips (Movie S2). The minimum number of nuclei needed to populate a single growing hyphal tip increases with the growth rate. In Neurospora crassa, which is among the fastest-growing filamentous fungi, we estimate that a minimum of 840 μm of hypha or equivalently 130 nuclei are needed per hyphal tip (SI Text). In growing Fusarium oxysporum germlings, a single nucleus suffices (13). In the absence of mixing, mathematical modeling shows that small populations of randomly dividing nuclei rapidly lose diversity, creating genetically homogeneous hyphae or sectors of mycelia (SI Text and Fig. S1).
Does diversity loss occur in real chimeric mycelia? In fact, sectoring of different genotypes is seen in many species (14–16). A suite of adaptations, including synchronous nuclear division and autonomous translocation of nuclei between tips (17), may help to preserve genetic diversity in a small apical population. However, there is no evidence of these adaptations in many species for which nuclear division is asynchronous and nuclei in the apical population are not autonomously motile (18). Here, using N. crassa as a model for these species, we show that physical mixing of nuclei can preserve the colony’s internal genetic diversity. Remarkably, nucleotypes are mixed even down to the scale of individual hyphae by the same gentle pressure gradients that drive colony growth. Our analyses expose the precise hydraulic engineering needed to shape and direct these mixing flows. In this work, we focus on the topology of hyphal branching, which can be shown to be optimal for nuclear mixing, and discuss also the necessity of hyphal fusions in forming the mixing network. In addition to revealing how some species are adapted for chimeric lifestyles, nuclear mixing by hydraulic flows may provide a physical key to the morphological diversity of fungal mycelia.
Results
In a chimeric N. crassa mycelium, different genotypes become better mixed at all length scales during growth. We created heterokarya containing nuclei expressing either GFP or DsRed-labeled H1 histones (Materials and Methods). These fluorescently tagged proteins allow nucleotypes to be distinguished by their red or green fluorescence (Fig. 1A). We created one-dimensional (1D) colonies by inoculating colonies on one edge of rectangular agar blocks—the hyphal tips of the colony then advance unidirectionally across the block. We measured genetic well-mixedness by measuring the proportion pr of hH1-DsRed nuclei in samples of 130 neighboring nuclei from the hyphal tip region of growing heterokaryotic colonies. We used the SD of pr between samples as an index for the well-mixedness of nucleotypes—more mixing of nucleotypes produces smaller values of std(pr) (Fig. S2). Nucleotypes were not well mixed initially but became better mixed with growth (Fig. 1B). To determine the endpoint for this mixing and to check whether histone diffusion was creating apparent mixing (SI Text), we measured nucleotype proportions in chains of asexual spores produced 24 h after the colony had covered the entire 5-cm agar block. The fluorescence of a conidium accurately represents the genotypes of the nuclei present within (Table S1). We found that the mixing index of conidial chains was comparable with that of the mycelium after 5 cm growth (Fig. 1B).
Colonies rapidly disperse new nucleotypes. To follow the fates of nuclei from the colony interior we inoculated hH1-gfp conidia into wild-type (unlabeled) colonies (Materials and Methods, SI Text, Figs. S3 and S4). The germinating conidia readily fused with nearby hyphae, depositing their GFP-labeled nuclei into the mature mycelium (Fig. 2A), after which the marked nuclei move to the growing tips, traveling up to 10 mm in 1 h, i.e., more than three times faster than the growth rate of the colony (Fig. 2B). Hypothesizing that the redistribution of nucleotypes throughout the mycelium was associated with underlying flows of nuclei, we directly measured nuclear movements over the entire colony, using a hybrid particle image velocimetry–particle tracking (PIV-PT) scheme to make simultaneous velocity measurements of several thousand hH1-GFP nuclei (Materials and Methods, SI Text, Figs. S5 and S6). Mean flows of nuclei were always toward the colony edge, supplying the extending hyphal tips with nuclei, and were reproducible between mycelia of different sizes and ages (Fig. 3A). However, velocities varied widely between hyphae, and nuclei followed tortuous and often multidirectional paths to the colony edge (Fig. 3B and Movie S3).
Fig. 2.

N. crassa colonies actively mix nuclei introduced up to 16 mm behind the growing tips. (A) (Upper) Transmitted light image of hH1-gfp conidia (circled in green) inoculated into an unlabeled colony. (Scale bar, 1 mm.) (Lower) GFP-labeled nuclei enter and disperse (arrows) through a calcofluor-stained colony. (Scale bar, 20 μm.) Reprinted with permission from Elsevier from ref. 12. (B) Probability density function (pdf) of dispersed nuclei vs. time after first entry of nuclei into the colony and distance in the direction of growth. Lines give summary statistics: solid line, mean distance traveled by nuclei into colony; dashed line, maximum distance traveled.
Fig. 3.
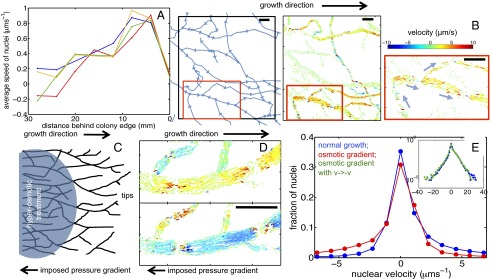
Rapid dispersal of new nucleotypes is associated with complex nuclear flows. (A) Growing tips at the colony periphery are fed with nuclei from 20–30 mm into the colony interior. Average nuclear speeds are almost identical between wild-type colonies of different ages (key to colors: blue, 3 cm growth; green, 4 cm; red, 5 cm) and between wild-type and so mutant mycelia (orange: so after 3 cm growth). (B) Individual nuclei follow complex paths to the tips (Left, arrows show direction of hyphal flows). (Center) Four seconds of nuclear trajectories from the same region: Line segments give displacements of nuclei over 0.2-s intervals, color coded by velocity in the direction of growth/mean flow. (Right) Subsample of nuclear displacements in a magnified region of this image, along with mean flow direction in each hypha (blue arrows). (C) Flows are driven by spatially coarse pressure gradients. Shown is a schematic of a colony studied under normal growth and then under a reverse pressure gradient. (D) (Upper) Nuclear trajectories in untreated mycelium. (Lower) Trajectories under an applied gradient. (E) pdf of nuclear velocities on linear–linear scale under normal growth (blue) and under osmotic gradient (red). (Inset) pdfs on a log–log scale, showing that after reversal  , velocity pdf under osmotic gradient (green) is the same as for normal growth (blue). (Scale bars, 50 μm.)
Nuclei are propelled by bulk cytoplasmic flow rather than moved by motor proteins. Although multiple cytoskeletal elements and motor proteins are involved in nuclear translocation and positioning (19, 20), pressure gradients also transport nuclei and cytoplasm toward growing hyphal tips (18, 21). Hypothesizing that pressure-driven flow accounted for most of the nuclear motion, we imposed osmotic gradients across the colony to oppose the normal flow of nuclei. We observed perfect reversal of nuclear flow within the entire local network (Fig. 3C and Movie S4), while maintaining the relative velocities between hyphae (Fig. 3 D and E).
Network geometry, created by the interplay of hyphal growth, branching, and fusion, shapes the mixing flows. Because fungi often grow on crowded substrates, such as the spaces between plant cell walls, which constrain the ability of hyphae to fuse or branch, we speculated that branching and fusion may operate independently to maximize nuclear mixing. To test this hypothesis, we repeated our experiments on nucleotypic mixing and dispersal in a N. crassa mutant, soft (so), that is unable to undergo hyphal fusion (22). so mycelia grow and branch at the same rate as wild-type mycelia, but form a tree-like colony rather than a densely interconnected network (Fig. 4).
Fig. 4.

Mathematical models and the hyphal fusion mutant so reveal the separate contributions of hyphal branching and fusion to nuclear mixing. (A) pdf of distance traveled by nuclei entering a so colony. Mean (solid blue) and maximal (dashed blue) dispersal distances are similar to those of wild-type colonies (red curves, reproduced from Fig. 2B). (B) In so colonies, and <3 mm from the tips of a wild-type colony the network is tree-like, with a leading hypha (red arrowhead) feeding multiple tips (green circles). Hyphal flow rate is proportional to the number of tips fed so can be used to infer position in the branching hierarchy. (Inset) correlation of flow rate with number of tips fed in a real hyphal network. Blue, 3-cm colony; green, 4 cm; red, 5 cm 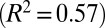 . (C) The probability
  of sibling nuclei being sent to different tips was optimized by Monte Carlo simulations (SI Text). Optimal branching increases
  from 0.37 in a random branching network (Upper) to a value close to 0.46 (Lower). Branches are color coded by their flow rates. (D) For real colonies the distribution of branches at each stage of the hierarchy (blue, 3-cm mycelium; green, 4 cm; red, 5 cm) is close to optimal (solid black curve and crosses) rather than random branching (dashed black curve). (E) Despite having close to optimal branching, a so chimera becomes unmixed with growth. Conidial chains of a his-3::hH1-gfp; Pccg1-DsRed so + his-3::hH1-gfp; so heterokaryon tend to contain only hH1-GFP so nuclei (Left) or hH1-GFP DsRed so nuclei (Center); compare a heterokaryotic wild-type conidial chain in which hH1-DsRed and hH1-GFP nuclei are evenly mixed (Upper Right). (Scale bars, 20 μm.) Graph showing narrow spread of
  between wild-type conidial chains (black line) indicates more mixing of nucleotypes than in so (dashed red line).
Even in the absence of fusion, nuclei are continually dispersed from the colony interior. Histone-labeled nuclei introduced into so colonies disperse as rapidly as in wild-type colonies (Fig. 4A). We studied the mixing flows responsible for the dispersal of nuclei in so mycelia. In so colonies nuclear flow is restricted to a small number of hyphae that show rapid flow. We follow previous authors by calling these “leading” hyphae (23). Each leading hypha could be identified more than 2 cm behind the colony periphery, and because flows in the leading hyphae (up to 5 μm⋅s−1, Fig. 3B) are up to 20 times faster than the speed of tip growth (0.3 μm⋅s−1), each hypha must feed up to 20 hyphal tips. Any nucleus that enters one of these leading hyphae is rapidly transported to the colony periphery.
Restricting flow to leading hyphae increases the energetic cost of transport but also increases nuclear mixing. Suppose that nuclei and cytoplasm flow to the growing hyphal tips at a total rate (vol/time) Q, equally divided into flow rates Q/N in each of N hyphae. To maintain this flow the colony must bear an energetic cost equal to the total viscous dissipation  , per length of hypha, where a is the diameter of a hypha and μ is the viscosity of the cell cytoplasm. In so mycelia there are 20 nonflowing hyphae per leading hyphae; by not using these hyphae for transport, the colony increases its transport costs 20-fold. However, restriction of transport to leading hyphae increases nuclear mixing: Nuclei are produced by mitoses within the leading hyphae and delivered to growing hyphal tips at the edge of the mycelium. Because each nucleus ends up in any of the growing tips fed by the hypha with equal probability, the probability of two daughter nuclei being separated within the colony and arriving at different hyphal tips is 19/20.
The branching topology of N. crassa optimizes nuclear mixing. We identified optimally mixing branching structures as maximizing the probability, which we denote by  , that a pair of nuclei originating from a single mitotic event ultimately arrive at different hyphal tips. In the absence of fusions the network has a tree-like topology with each leading hypha feeding into secondary and tip hyphae (Fig. 4B). Nuclei can travel only to tips that are downstream in this hierarchy. To evaluate the optimality of the network, we compared the hierarchical branching measured in real N. crassa hyphal networks with random and optimal branching models. In both cases, the probability of a pair of nuclei that are produced in a given hypha being delivered to different tips is inversely proportional to the number of downstream hyphal tips, so we can calculate
  from the branching distribution of the colony. To model random branching, we allow each hypha to branch as a Poisson process, so that the interbranch distances are independent exponential random variables with mean
  . Then if
  is the probability that after growing a distance x, a given hypha branches into k hyphae (i.e., exactly k − 1 branching events occur), the
  satisfy master equations
 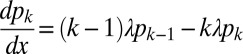 . Solving these equations using standard techniques (SI Text), we find that the likelihood of a pair of nuclei ending up in different hyphal tips is
 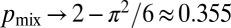 , as the number of tips goes to infinity. Numerical simulations on randomly branching colonies with a biologically relevant number of tips (SI Text and Fig. 4C,“random”) give
  , very close to this asymptotic value. It follows that in randomly branching networks, almost two-thirds of sibling nuclei are delivered to the same hyphal tip, rather than becoming separated in the colony.
Hyphal branching patterns can be optimized to increase the mixing probability, but only by 25%. To compute the maximal mixing probability for a hyphal network with a given biomass we fixed the x locations of the branch points but rather than allowing hyphae to branch randomly, we assigned branches to hyphae to maximize  . Suppose that the total number of tips is N (i.e., N − 1 branching events) and that at some station in the colony there are m branch hyphae, with the ith branch feeding into
  tips
tips  . Then the likelihood of two nuclei from a randomly chosen hypha arriving at the same tip is
  . The harmonic-mean arithmetric-mean inequality gives that this likelihood is minimized by taking
  , i.e., if each hypha feeds into the same number of tips. However, can tips be evenly distributed between hyphae at each stage in the branching hierarchy? We searched numerically for the sequence of branches to maximize
  (SI Text). Surprisingly, we found that maximal mixing constrains only the lengths of the tip hyphae: Our numerical optimization algorithm found many networks with highly dissimilar topologies, but they, by having similar distributions of tip lengths, had close to identical values for
  (Fig. 4C, “optimal,” SI Text, and Fig. S7). The probability of two nuclei ending up at different tips is
  in the limit of a large number of tips (SI Text) and for a network with a biologically appropriate number of tips, we compute
  . Optimization of branching therefore increases the likelihood of sibling nuclei being separated within the colony by 25% over a random network. In real N. crassa cells, we found that the flow rate in each hypha is directly proportional to the number of tips that it feeds (Fig. 4B, Inset); this is consistent with conservation of flow at each hyphal branch point—if tip hyphae have similar growth rates and dimensions, viz. the same flow rate Q, then a hypha that feeds N tips will have flow rate NQ. Thus, from flow-rate measurements we can determine the position of each hypha in the branching hierarchy. We checked whether real fungal networks obey the same branching rules as theoretically optimal networks by making a histogram of the relative abundances of hyphae feeding 1, 2, … tips. Even for colonies of very different ages the branching hierarchy for real colonies matches quite precisely the optimal hyphal branching, in particular by having a much smaller fraction of hyphae feeding between 1 and 3 tips than a randomly branching network (Fig. 4D).
In fact, real N. crassa colonies achieve better than optimal values of  by coregulating flow rates with hyphal diameters. We computed
  by sampling nuclei at random from the growing periphery of real N. crassa colonies. Averaged over all hyphae we found that
  , i.e., larger than the optimal value of 0.5. In real N. crassa colonies, hyphae exhibit a hierarchy of diameters, with the leading hyphae that feed the most tips having the largest diameters, primary branches having smaller diameters, and secondary branches even smaller diameters (for a 5-mm–sized colony, ref. 24 gives the respective hyphal diameters to be 12 μm, 8 μm, and 6 μm). As a result, nuclear division is more likely to occur in leading hyphae, where the probability of sibling nuclei being separated is larger.
Despite optimization of its branching topology for mixing, a colony lacking hyphal fusion is not able to maintain genetic richness during growth. We compared the conidia (asexual spores) from a so (his-3::hH1-gfp; so + his-3::hH1-gfp; Pccg1-DsRed so) heterokaryon with a WT (his-3::hH1-gfp + his-3::hH1-DsRed) heterokaryon. The proportion of so hH1-GFP DsRed (cytoplasmic) nuclei in the so heterokaryon was initially matched to the proportions of hH1-DsRed nuclei in the WT heterokaryon 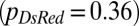 . In the so chimera, nucleotypes segregated out, rather than becoming better mixed (compare Fig. 1B): Many so conidiophores contained only so hH1-GFP nuclei (Fig. 4E, Left) or only so hH1-GFP DsRed nuclei (Fig. 4E, Center), and the mixing index was much larger
 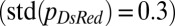 than for wild-type colonies [
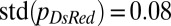 , Fig. 4E], suggestive of weaker mixing at the scale of individual hyphae and conidiophores.
Lack of mixing of nucleotypes in so chimeras surprised us because even though branching separates only a fraction of sibling nuclei, we expected nuclei to become hydrodynamically dispersed through the mycelium. Generally, particles flowing through hydraulic networks are dispersed at rates 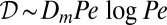 (25, 26), where
  is the particle diffusivity (for a 2-μm nucleus,
  due to Brownian motion) and the Péclet number
  is constructed from the mean speed of flow,
  , and the typical interbranch distance,
  . Our velocimetry and nuclear dispersion experiments show that nuclei travel distances of
  or more, at average speeds of ∼3 mm/h (Fig. 2B), so take time
  to reach the growing tips. The dispersion in arrival times under hydraulic network theory is therefore
  , which exceeds the time that the tip will grow between branching events (on the order of 4–10 min, if branches occur at 200-μm intervals, and the growth rate is 0.3−0.8 μm⋅s−1). It follows that even if sibling nuclei follow the same path through the network, they will typically arrive at different enough times to feed into different actively growing tips. However, hydraulic network theory assumes a parabolic profile for nuclei within hyphae, with maximum velocity on the centerline of the hypha and no-slip (zero velocity) condition on the walls (27). Particles diffuse across streamlines, randomly moving between the rapid flow at the hyphal center and the slower flow at the walls. Fluctuations in a particle’s velocity as it moves between fast- and slow-flowing regions lead to enhanced diffusion in the direction of the flow [i.e., Taylor dispersion (28)]. By contrast, in fungal hyphae, although velocities vary parabolically across the diameter of each hypha, confirming that they are pressure driven, there is apparent slip on the hyphal walls (Fig. S8). Absence of slow-flowing regions at the hyphal wall weakens Taylor dispersion by a factor of 100 (SI Text).
Why do nucleotypes remain mixed in wild-type colonies? We noted that nuclei became more dispersed during their transit through wild-type colonies (Fig. S4). Because Taylor dispersion is weak in both strains, we hypothesized that hyphal fusions might act in wild-type strains to create velocity differences between hyphae. In a multiconnected hyphal network, nuclei can take different routes between the same start and end points; i.e., although sibling nuclei may be delivered to the same hyphal tip, they can take different routes, travel at different speeds, and arrive at different times (Movie S3).
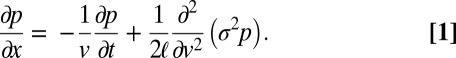
Interhyphal velocity variations replace intrahyphal Taylor dispersion to disperse and mix nuclei. To model interhyphal velocity variation, we consider a nucleus flowing from the colony interior to the tips as undergoing a random walk in velocity, with the steps of the walk corresponding to traveling at constant speed along a hypha, and velocity changes occurring when it passes through a branch or fusion point. If branch or fusion points are separated by some characteristic distance ℓ, and the velocity jumps are modeled by steps  , where ξ is a random variable with mean 0 and variance 1, then the probability density function,
  , for a nucleus traveling a distance x in time t and with ending velocity v obeys the Fokker–Planck equation (29):
 |
The size of velocity jumps,  , at branch and fusion points can be determined from the marginal probability density function (pdf) of nuclear velocities,
  , which, for real colonies, can be extracted from velocimetry data. By integrating 1, we obtain that
 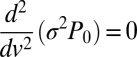 ; i.e.,
  . For arbitrary functional forms
  , Aris’ method of moments (30) gives that the SD in time taken for nuclei to travel a large distance x increases like
  , where D can be computed from
  (see SI Text for the general expression). In real N. crassa colonies, hyphal velocities are uniformly distributed over an interval
  (Fig. 5), so both
  and
and  are approximately constant. Therefore (SI Text),
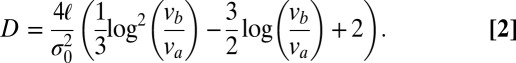 |
For a real N. crassa network,  and
and  , and estimating
  , we compute that the expected difference in arrival times of two sibling nuclei originating 10 mm behind the edge of the colony is 60 min, large enough to separate sibling nuclei by hydrodynamic dispersion.
Fig. 5.

Hyphal velocities are almost uniformly distributed in wild-type mycelia; i.e., fraction of flow carried by a hypha whose speed is v is almost constant up to  , independent of colony size (blue, 3-cm mycelium; green, 4 cm; red, 5 cm). We use this result to estimate the variance in travel times for sibling nuclei traveling from the colony interior to a growing hyphal tip (main text).
Discussion
The frequency of chimerism in nature has been a matter of long-standing debate (31). Although heterokaryon incompatibility mechanisms limit nuclear exchange between genetically dissimilar individuals (8), chimeras can also arise from spontaneous mutations within a single mycelium (4), are often observed in natural isolates (5), and occur frequently enough to provide a pathway for lateral gene transfer (10, 11). Far from being random, branching and fusion within the N. crassa hyphal network mix genetically diverse nuclei and create well-mixed conidial spores, supporting the point of view that for this species, chimerism may be common.
There are more than 1 million species of filamentous fungi (32), yet the physiological trade-offs that have shaped their immense morphological diversity remain little understood. Our demonstration that mixing is achieved only with a considerable increase in the energetic cost of cytoplasmic transport suggests that competing principles, i.e., mixing and transport (33), may provide a physical axis for explaining morphological diversity. N. crassa continually mixes nucleotypes at considerable energetic cost, whereas species such as the woodland basidiomycete Phanerochaete velutina may be optimized for transport (33). Neurospora chimeras are known to be more stable than other ascomycetes (34): Our results suggest that this stability is derived from optimization of the Neurospora network for nuclear mixing.
Here, fluctuations in nucleotypic proportions were driven by the stochasticity of nuclear division. However, the experimental model also allows study of the additional population dynamics arising when nucleotypes have functional differences. Nucleotypes created by mutation or mitotic recombination are likely to have lower fitness as homokarya, but sharing cytoplasm with wild-type nuclei may shield them from fitness defects (35). Nonetheless, selective forces must also act on novel nucleotypes, both for the evolution of new strains and to purify colonies (12). Experiments with heterokarya in which one nucleotype has, e.g., antibiotic resistance will open a new window on the nuclear ecology of syncytia in which nuclei can interact either antagonistically or cooperatively (4).
Materials and Methods
N. crassa conidia were transformed by electroporation, using a 1.5-kV voltage and 1-mm-gap cells, following ref. 36. Previously developed hH1-gfp (pMF280 his-3+::Pccg1-hH1-sgfp) (37), hH1-DsRed (pMF332 his-3+::Pccg1-hH1-DsRed), and empty pBM61 plasmids were targeted to the his-3 locus in R15-07 (his-3 a) by homologous recombination. Single his-3+ colonies able to grow on unsupplemented media were selected from each transformation. We formed 1D colonies by inoculating conidia along one edge of 45 × 60-mm rectangles of Vogel’s minimal media (MM) agar (3% wt/vol agar). The growing edge of each colony advances unidirectionally along the agar block.
Heterokaryon Formation and Mixing.
One-dimensional colonies were initiated from a line of well-mixed conidia containing 90% hH1-DsRed conidia and 10% hH1-gfp conidia. We used imbalanced ratios because of vacuolization of DsRed in the oldest colonies, accompanied by a gradual disappearance of DsRed label from nuclei. Cultures were grown in uniform constant light and temperature conditions. We measured the mixedness of the two nucleotypes from images of hyphal tips in 1-, 2-, 3-, and 5-cm–sized colonies taken using the 10× objective of a Zeiss Axioskop II microscope with a Hamamatsu Orca C4742-95 CCD camera, controlled by OpenLab. One hundred thirty neighboring nuclei, corresponding approximately to the minimum population size needed to supply a single hyphal tip, were located by autolocal thresholding, from 40 tip regions spaced at least 1 mm apart, and the proportion of DsRed containing nuclei  was calculated for each sample. We use the SD of
  between these samples (four replicate cultures at each colony age) as an index of nucleotypic mixing: Smaller values of
  are associated with more nuclear mixing. The value of the mixing index was not sensitive to the number of nuclei in each sample (SI Text).
Tracking hH1-GFP Nuclei in WT and so Colonies.
Unlabeled (either WT or so) colonies were grown on MM plates as above. After unlabeled colonies had grown to a length of 2 cm, 0.75 μL of WT hH1-gfp conidia (∼75,000 conidia) were inoculated at points 4–12 mm behind the colony periphery. The first fusions between hH1-GFP conidia and the unlabeled colony occurred 4 h after inoculation in WT colonies and after 12 h for so colonies. Colonies were checked hourly for evidence of fusions, and hH1-GFP–labeled nuclei that entered the unlabeled colony were located by automated image analysis. Nuclear dispersal statistics were insensitive to the number of conidia inoculated into the colony (Fig. S3). WT (and therefore so+) hH1-GFP nuclei introduced into a so colony complement the so mutation, setting off a wave of fusion events in the existing so colony. The first hyphal fusions occurred ∼3 h after arrival of WT nuclei; nuclear dispersal rates therefore reflect the flows and architecture in so mycelia.
Manipulation of Pressure Gradients in WT Colonies.
Ten microliters of 0.6 M sucrose liquid MM was added directly close to the imaged area of the colony and on the opposite side from the growing tips (Fig. 3 C–E). Addition of hyperosmotic solution draws fluid from hyphae in the network, creating a local sink for cytoplasmic flow. Flow reversal began within seconds of applying the osmotic gradient and persisted for 1–2 min after it was applied. Flows returned to their initial directions and speeds 3–5 min later, consistent with ref. 38.
Nuclear Mixing in so Colonies.
Because so hyphae are not able to fuse, so heterokarya cannot be created by fusion of conidia. We therefore transformed multinucleate his-3::hH1-gfp; so conidia with a vector pBC phleo::Pccg1-DsRed (integration into the genome was ectopic and random). Phleomycin-resistant transformants were selected and multinucleate (his-3::hH1-gfp; Pccg1-DsRed so + his-3::hH1-gfp; so) conidia were used to initiate heterokaryotic mycelia. Intact conidial chains containing at least five conidia were used to estimate the proportion of DsRed-expressing nuclei in each condiophore.
Nuclear Tracking.
We simultaneously tracked thousands of nuclei in 0.7 × 0.7-mm fields. Particle image velocimetry (MatPIV) (39) was first used to follow coordinated movements of groups of nuclei. To track individual nuclei, a low pass filter was applied to remove pixel noise, and a high pass filter to subtract the image background, leaving nuclei as bright spots on a dark background (40). These bright spots were characterized morphologically (by size and mean brightness), and their centroids were calculated to subpixel precision, using cubic interpolation. For each nucleus identified in one frame an initial displacement was calculated by interpolation of the PIV-measured displacement field. A greedy algorithm was then used to find the morphologically most similar nucleus closest to its predicted location in the next frame (SI Text, Figs. S5 and S6). To check accurate measurement of subpixel displacements, we tracked slow-moving nuclei for up to five consecutive frames. Measured tip velocities under experimental conditions were ∼0.3 μm⋅s−1 (SI Text), slightly less than optimal growth rates (0.8 μm⋅s−1).
Supplementary Material
Acknowledgments
We thank Javier Palma Guerrero for providing plasmids and for assistance with microscopy; Karen Alim, Roger Lew, and Mark Fricker for useful discussions; Mark Dayel for comments on the manuscript; and Nhu Phong and Linda Ma for experimental assistance. M.R. acknowledges support from the Alfred P. Sloan Foundation and setup funds from University of California, Los Angeles, and additional funding from the Miller Institute for Basic Research in Sciences and the Oxford Center for Collaborative Applied Mathematics. A.S. and A.L. were supported by National Science Foundation grants MCB 0817615 and MCB 1121311 (to N.L.G.).
Footnotes
The authors declare no conflict of interest.
This article is a PNAS Direct Submission. J.P.T. is a guest editor invited by the Editorial Board.
This article contains supporting information online at www.pnas.org/lookup/suppl/doi:10.1073/pnas.1220842110/-/DCSupplemental.
References
- 1.Booy G, Hendirks R, Dmulders M, Van Groenendael J, Vosman B. Genetic diversity and the survival of populations. Plant Biol. 2000;2:379–395. [Google Scholar]
- 2.Crutsinger GM, et al. Plant genotypic diversity predicts community structure and governs an ecosystem process. Science. 2006;313(5789):966–968. doi: 10.1126/science.1128326. [DOI] [PubMed] [Google Scholar]
- 3.Gray W, Alexopoulos C. Biology of the Myxomycetes. New York: Ronald Press; 1968. [Google Scholar]
- 4.Maheshwari R. Nuclear behavior in fungal hyphae. FEMS Microbiol Lett. 2005;249(1):7–14. doi: 10.1016/j.femsle.2005.06.031. [DOI] [PubMed] [Google Scholar]
- 5.Sidhu G. Genetics of Giberella fujikuroi. iii. Significance of heterokaryosis in naturally occurring corn isolates. Can J Bot. 1983;61:3320–3325. [Google Scholar]
- 6.Jinks JL. Heterokaryosis; a system of adaption in wild fungi. Proc R Soc Lond B Biol Sci. 1952;140(898):83–99. doi: 10.1098/rspb.1952.0046. [DOI] [PubMed] [Google Scholar]
- 7.Caten C. The mutable and treacherous tribe revisited. Plant Pathol. 1996;45(1):1–12. [Google Scholar]
- 8.Glass NL, Dementhon K. Non-self recognition and programmed cell death in filamentous fungi. Curr Opin Microbiol. 2006;9(6):553–558. doi: 10.1016/j.mib.2006.09.001. [DOI] [PubMed] [Google Scholar]
- 9.Biella S, Smith ML, Aist JR, Cortesi P, Milgroom MG. Programmed cell death correlates with virus transmission in a filamentous fungus. Proc Biol Sci. 2002;269(1506):2269–2276. doi: 10.1098/rspb.2002.2148. [DOI] [PMC free article] [PubMed] [Google Scholar]
- 10.Friesen TL, et al. Emergence of a new disease as a result of interspecific virulence gene transfer. Nat Genet. 2006;38(8):953–956. doi: 10.1038/ng1839. [DOI] [PubMed] [Google Scholar]
- 11.Tsai HF, et al. Evolutionary diversification of fungal endophytes of tall fescue grass by hybridization with Epichloë species. Proc Natl Acad Sci USA. 1994;91(7):2542–2546. doi: 10.1073/pnas.91.7.2542. [DOI] [PMC free article] [PubMed] [Google Scholar]
- 12.Roper M, Ellison C, Taylor JW, Glass NL. Nuclear and genome dynamics in multinucleate ascomycete fungi. Curr Biol. 2011;21(18):R786–R793. doi: 10.1016/j.cub.2011.06.042. Available at http://www.sciencedirect.com/science/journal/09609822. [DOI] [PMC free article] [PubMed] [Google Scholar]
- 13.Ruiz-Roldán MC, et al. Nuclear dynamics during germination, conidiation, and hyphal fusion of Fusarium oxysporum. Eukaryot Cell. 2010;9(8):1216–1224. doi: 10.1128/EC.00040-10. [DOI] [PMC free article] [PubMed] [Google Scholar]
- 14.Pontecorvo G, Gemmell A. Colonies of Penicilium notatum and other moulds as models for the study of population genetics. Nature. 1944;154:532–534. [Google Scholar]
- 15.Steiner S, Wendland J, Wright MC, Philippsen P. Homologous recombination as the main mechanism for DNA integration and cause of rearrangements in the filamentous ascomycete Ashbya gossypii. Genetics. 1995;140(3):973–987. doi: 10.1093/genetics/140.3.973. [DOI] [PMC free article] [PubMed] [Google Scholar]
- 16.Li L, Pischetsrieder M, St Leger RJ, Wang C. Associated links among mtDNA glycation, oxidative stress and colony sectorization in Metarhizium anisopliae. Fungal Genet Biol. 2008;45(9):1300–1306. doi: 10.1016/j.fgb.2008.06.003. [DOI] [PubMed] [Google Scholar]
- 17.Gladfelter AS. Nuclear anarchy: Asynchronous mitosis in multinucleated fungal hyphae. Curr Opin Microbiol. 2006;9(6):547–552. doi: 10.1016/j.mib.2006.09.002. [DOI] [PubMed] [Google Scholar]
- 18.Ramos-García SL, Roberson RW, Freitag M, Bartnicki-García S, Mouriño-Pérez RR. Cytoplasmic bulk flow propels nuclei in mature hyphae of Neurospora crassa. Eukaryot Cell. 2009;8(12):1880–1890. doi: 10.1128/EC.00062-09. [DOI] [PMC free article] [PubMed] [Google Scholar]
- 19.Suelmann R, Sievers N, Fischer R. Nuclear traffic in fungal hyphae: In vivo study of nuclear migration and positioning in Aspergillus nidulans. Mol Microbiol. 1997;25(4):757–769. doi: 10.1046/j.1365-2958.1997.5131873.x. [DOI] [PubMed] [Google Scholar]
- 20.Schuchardt I, Assmann D, Thines E, Schuberth C, Steinberg G. Myosin-V, Kinesin-1, and Kinesin-3 cooperate in hyphal growth of the fungus Ustilago maydis. Mol Biol Cell. 2005;16(11):5191–5201. doi: 10.1091/mbc.E05-04-0272. [DOI] [PMC free article] [PubMed] [Google Scholar]
- 21.Lew RR. Mass flow and pressure-driven hyphal extension in Neurospora crassa. Microbiology. 2005;151(Pt 8):2685–2692. doi: 10.1099/mic.0.27947-0. [DOI] [PubMed] [Google Scholar]
- 22.Fleissner A, et al. The so locus is required for vegetative cell fusion and postfertilization events in Neurospora crassa. Eukaryot Cell. 2005;4(5):920–930. doi: 10.1128/EC.4.5.920-930.2005. [DOI] [PMC free article] [PubMed] [Google Scholar]
- 23.Steele GC, Trinci AP. Morphology and growth kinetics of hyphae of differentiated and undifferentiated mycelia of Neurospora crassa. J Gen Microbiol. 1975;91(2):362–368. doi: 10.1099/00221287-91-2-362. [DOI] [PubMed] [Google Scholar]
- 24.Simonin A, Palma-Guerrero J, Fricker M, Glass NL. Physiological significance of network organization in fungi. Eukaryot Cell. 2012;11(11):1345–1352. doi: 10.1128/EC.00213-12. [DOI] [PMC free article] [PubMed] [Google Scholar]
- 25.de Jong GDJ. Longitudinal and transverse diffusion in granular deposits. 2006. Theory and Applications of Transport in Porous Media (Springer, Dordrecht, The Netherlands) Vol 19, pp 261–268.
- 26.Saffman P. A theory of dispersion in a porous medium. J Fluid Mech. 1959;6:321–349. [Google Scholar]
- 27.Batchelor GK. An Introduction to Fluid Dynamics. Cambridge, UK: Cambridge Univ Press; 1967. [Google Scholar]
- 28.Taylor G. Dispersion of soluble matter in solvent flowing slowly through a tube. Proc R Soc Lond A. 1953;219(1137):186–203. [Google Scholar]
- 29.Gardiner C. Handbook of Stochastic Methods for Physics, Chemistry and the Natural Sciences, Series in Synergetics. Berlin: Springer; 1985. [Google Scholar]
- 30.Aris R. On the dispersion of a solute in a fluid flowing through a tube. Proc R Soc Lond A. 1956;235(1200):67–77. [Google Scholar]
- 31.Caten CE, Jinks J. Heterokaryosis: Its significance in wild homothallic ascomycetes and fungi imperfecti. Trans Br Mycol Soc. 1966;49(1):81–93. [Google Scholar]
- 32.Hawksworth DL. The magnitude of fungal diversity: The 1.5 million species estimate revisited. Mycol Res. 2001;105:1422–1432. [Google Scholar]
- 33.Bebber DP, Hynes J, Darrah PR, Boddy L, Fricker MD. Biological solutions to transport network design. Proc Biol Sci. 2007;274(1623):2307–2315. doi: 10.1098/rspb.2007.0459. [DOI] [PMC free article] [PubMed] [Google Scholar]
- 34.Pontecorvo G. Genetic systems based on heterocaryosis. Cold Spring Harb Symp Quant Biol. 1946;11:193–201. [Google Scholar]
- 35.Maheshwari R, Navaraj A. Senescence in fungi: The view from Neurospora. FEMS Microbiol Lett. 2008;280(2):135–143. doi: 10.1111/j.1574-6968.2007.01027.x. [DOI] [PubMed] [Google Scholar]
- 36.Margolin B, Freitag M, Selker E. Improved plasmids for gene targeting at the his-3 locus of Neurospora crassa by electroporation. Fungal Genet Newsl. 1997;47:34–36. [Google Scholar]
- 37.Freitag M, Hickey PC, Raju NB, Selker EU, Read ND. GFP as a tool to analyze the organization, dynamics and function of nuclei and microtubules in Neurospora crassa. Fungal Genet Biol. 2004;41(10):897–910. doi: 10.1016/j.fgb.2004.06.008. [DOI] [PubMed] [Google Scholar]
- 38.Lew RR, Nasserifar S. Transient responses during hyperosmotic shock in the filamentous fungus Neurospora crassa. Microbiology. 2009;155(Pt 3):903–911. doi: 10.1099/mic.0.023507-0. [DOI] [PubMed] [Google Scholar]
- 39.Sveen J. 2004. Mechanics and Applied Mathematics (Department of Mathematics, University of Oslo, Oslo), Technical Report Eprint no. 2.
- 40.Crocker JC, Grier DG. Methods of digital video microscopy for colloidal studies. J Coll Int Sci. 1996;179:298–310. [Google Scholar]
Associated Data
This section collects any data citations, data availability statements, or supplementary materials included in this article.