

Abstract
We have identified an alternatively spliced, non-functional aberrant E-cadherin transcript that lacks exon 11 and is over expressed in malignant cells as compared to the normal non-malignant cells. This increase in the aberrant transcript is a mechanism of loss of E-cadherin gene expression as it is rapidly degraded by the nonsense mediated decay pathway. To study the mechanism of this gene missplicing we analyzed the role of histone epigenetic modifications in lung cancer cell lines. The treatment of low E-cadherin lung cancer cell lines with histone deacetylase inhibitor (HDACi, MS-275) resulted in the preferential expression of the correctly spliced transcripts in the low E-cadherin expressing cell lines only. Chromatin immunoprecipitation (ChIP) assays revealed that the histone hypoacetylation levels correlate with aberrant exon 11 splicing as there is more aberrant splicing in cell lines with E-cadherin promoter hypoacetylation. Inactivation of histone deacetylases (HDAC) 1, 2 and 3 resulted in an increase in E-cadherin expression and an increase in the ratio of the correctly spliced E-cadherin transcript. As transcription of the gene is closely linked to splicing, we considered the possibility that change in E-cadherin transcription correlates with splicing. The Zeb1 epithelial-mesenchymal transformation (EMT) inducer silences E-cadherin expression and could also alter the splicing of this exon. Inhibition of the E-cadherin promoter transcription with Zeb1 expression increases aberrant splicing and the reverse is observed when Zeb1 is knocked down. The role of HDAC inhibitors was also studied in vivo in a immunodeficient mouse xenograft model. Exposure of mice to HDACi resulted in growth inhibition, increase in E-cadherin expression, alteration of aberrant splicing and the reversal of EMT in mouse tumors. The findings support the modulation of E-cadherin exon 11 inclusion or exclusion by histone epigenetic modifications as they change the overall chromatin structure. The results provide an interesting link between epigenetic alterations in cancer cells and gene splicing in addition to their effect on gene silencing.
Keywords: E-cadherin, splicing, histone modifications, HDAC, HDAC inhibitor, Zeb1, EMT
Introduction
Alternative gene splicing is known to occur in tumor cells and a number of cancer associated genes are regulated by this mechanism [1-4]. Alternative splicing of the RNA is regulated by a number of mechanisms that include, splicing enhancers, silencers along with SR (serine/arginine-rich RNA binding) proteins, heterogeneous nuclear ribonucleoproteins (hnRNPs) [5,6], recruitment of transcription factors to the promoter [7,8] and the RNA Pol II elongation rate [9]. For a number of tumor suppressor genes, such as BRCA1/2, WT1 and mdm2, [10-12] alternative splicing is a mechanism of gene inactivation that contributes to oncogenesis. Besides mutations at splice sites that result in missplicing of exons, the differential expression of splicing factors in tumor cells also modify the splicing patterns of a number of genes [13]. The identification and study of splice variants of genes in cancer cells is crucial to understand how these variants affect the biology of the disease.
The role of epigenetic histone modifications in gene splicing and selection of alternative exons has been recently described [14,15]. These post-translational modifications of the N-termini of core histones such as acetylation, methylation, and phosphorylation mark the histones in a unique way [16]. Genome wide analysis also reveals that histone marks are non-randomly distributed as some histone modifications are specifically seen on the exons as compared to the introns [17]. This suggests that these post-translational histone modifications have a role in exon definition and the selection of a particular exon could be influenced by the nature of the post-translational modification. These modifications also affect the compactness of the chromatin structure and the transcriptional state of the genes, e.g. hyperacetylation is known to be associated with increased gene transcription and hypoacetylation with a compact chromatin structure and gene silencing [16,18,19]. Similarly, the histones also undergo methylation of their lysine residues and the characteristic methylation pattern is known to correlate with gene silencing and splicing reviewed in [20,21]. Cancer cells are known to exhibit altered histone acetylation and methylation patterns and these epigenetic events are also predictive of clinical outcome as specific modifications are linked to recurrence patterns in a number of malignancies [22]. As a number of genes are epigenetically silenced due to histone modifications in cancer cells, this process can result in differential splicing of genes in tumor cells with expression of novel RNA isoforms and add another layer of complexity in understanding the cancer cell transcriptome.
E-cadherin is a tumor suppressor gene and its loss of expression is associated with tumor invasion, metastasis, and unfavorable prognosis [23,24]. This occurs mainly due to promoter methylation [25] and histone deacetylation [26,27]. E-cadherin downregulation is an important hallmark step in this process and its loss occurs frequently in lung cancer cells [28]. Loss of E-cadherin expression also occurs due to the binding of certain transcription factors (e.g. Zeb, Snail, Slug, and Twist) [29] to its promoter region that inhibit gene transcription and result in silencing. This leads to the process of EMT by which cancer cells acquire enhanced ability to migrate, metastasize, resistance towards chemotherapeutic agents and stem cell phenotype [30]. In a comprehensive RNA sequencing analysis [31] of cells undergoing EMT the splicing patterns of some genes was correlated to the epigenetic modifications in the genes.
We have recently characterized an aberrantly spliced E-cadherin transcript in solid tumors [3] and leukemias [4]. This transcript lacks exon 11 of the E-cadherin gene and is rapidly degraded by the nonsense mediated decay (NMD) [32,33] pathway in cells. The lack of exon 11 in this aberrant transcript results in a frameshift that generates a novel premature termination codon (PTC). Although the transcript has a short half-life due to its ongoing degradation, it can be quantified by transcript specific real time PCR strategy and can also be stabilized with translational inhibitors [3,4,33] that block NMD pathway. In this study, we investigated whether aberrant E-cadherin splicing was related to the epigenetic histone modifications and whether reversal of these epigenetic modifications could affect the splicing pattern. Our analysis indicates that lung cancer cells lines with hypoacetylated histones show more missplicing or skipping of the E-cadherin exon 11. Also treatment of lung cancer cell lines with HDACi or histone hyperacetylation results in an increase in the expression of correctly spliced transcripts. The studies with Zeb1 expression and knockdown in lung cancer cell lines also affected E-cadherin splicing pattern and expression indicating an association between splicing and gene transcription.
Materials and methods
Cell lines and reagents
Non small cell lung cancer cell lines H460 (large cell cancer), H157 (squamous), H358 (bronchoalveolar), H292 (mucoepidermoid) and H441 (adenocarcinoma) were obtained from ATCC, RH2 cells (squamous) were provided by Dubinett’s laboratory, UCLA [34]. Beas cells are immortalized human bronchial epithelium cells [35]. Tert-Kert cells are telomerase reverse transcriptase immortalized human keratinocytes obtained from David Wong’s lab at UCLA [36]. Cells were cultured in RPMI 1640 supplemented with 10% FBS, 2.5% glutamine penicillin and streptomycin in a humidified 5% CO2 atmosphere and analyzed at 60-80% confluence. HDACi MS-275 was obtained from ChemieTek, Indianapolis, IN and dissolved in DMSO. Cells were treated with different concentrations of this drug for 48 hours or diluents control. NMD blockade was achieved by treating cells with emetine, a translational inhibitor at a concentration of 10 μg/ml for 8 hours [33].
Real time PCR analysis
E-cadherin expression in cells was analyzed by real time PCR analysis. The 5’ primer GGATGTGCTGGATGTGAATG localizes to exon 10 of the E-cadherin gene. The 3’ primer CACATCAGACAGGATCAGCAGAA localizes to the exon 12. The taqman probe TAACATATCGGATTTGGAGAGAC for the wild type E-cadherin transcript level, binds to the junction of exon 10-exon 11. The expression level of the skipped or aberrant transcript transcript lacking exon [11] was determined by a 5’ primer that is at the junction of exon 10 and 12 (TATGGAACAGAAAATAACGTTC) and a 3’ primer in the exon 12 (TGTCATTCACATCAGACAGGAT). These primers sets only amplify the exon 11 skipped or the aberrant transcript. The taqman probe (AACAGGGACACTTCTG) binds to the exon 12. Real time PCR for actin expression was used as a control and relative expression was determined by the method of Pfall [37].
Western blot analyses and antibodies
Cells were washed with cold PBS and disrupted in lysis buffer (Cell Signaling, MA) supplemented with protease inhibitor cocktail from Thermo Scientific (Rockford, IL). Lysed cells were then sonicated on ice for 10 seconds, followed by centrifugation (10,000 g, 10 min). Samples were mixed with SDS sample buffer and 20-30 μg aliquots resolved on SDS/PAGE gels. Following transfer to PVDF membranes immunodetection was performed with E-cadherin (BD Biosciences), Ac-H3 (06-599, Millipore), Ac-H4, (sc-34263, Santa Cruz Biotechnology). Zeb1 and vimentin antibody were purchased from Santa Cruz Biotechnology. Detection was performed with horseradish peroxidase-conjugated secondary antibodies and chemiluminescence (ECL plus, GE Healthcare and LAS Mini imager, Fuji and ImageQuant software).
Chromatin immunoprecipitation analyses
ChIP assays were performed according to protocols of the EZ-ChIP™ Chromatin. Immunoprecipitation kit (Millipore, MA). Briefly, 1 × 10⁶ cells were fixed with 1% formaldehyde for 10 min at 37°C. The cells were washed extensively with PBS, and the chromatin was sheared by sonication (Branson sonicator) to 200-400 bp fragments. The cross-linked histone-DNA complex was immunoprecipitated with anti Ac-H4 histone (sc-34263, Santa Cruz Biotechnology), anti Ac-H3 histone antibodies (06-599, Millipore), at 4°C overnight. Normal mouse IgG was used as negative controls. DNA was obtained from the cross-linked complex and was amplified by real-time PCR with specific primer sets (contact author for sequence information). E-cadherin promoter fragment amplified was 295 bp and located at position -158 from the transcription site. The exon 10, 11 and 12 are 245, 146 and 225 bp respectively and a single fragment of about 100-150 bp. A real time PCR based method was used to calculate the % input values for each immunoprecipitating antibody by the following method: % input = 100*2Ctinput-CtIP.
HDAC expression and HDAC siRNA inactivation
HDAC1-6 expression was determined by real time PCR analysis by Taqman probes (Applied Biosystems) in the lung cancer cell lines with actin as control. HDAC 1, 2 and 3 were inactivated in the H358 cell line by a transient transfection. SiRNA mix against specific HDAC were obtained from Santa Cruz Biotechnology (SCBT), Santa Cruz and used at a final concentration of 50 nM with Lipofectamine 2000 (Invitrogen, Carlsbad, as manufacturer’s protocol). A scrambled siRNA was used for a control transfection. Cells were analyzed 48 hours after transfection by western blot and transcript specific real time PCR analyses. HDAC 1, 2 and 3 antibodies were purchased from SCBT, Santa Cruz.
Zeb1 expression and knockdown in lung cancer cell lines
High E-cadherin expressing cell line H441 was transduced with the retroviral supernatant from the Zeb1 expressing vector pQCXIN (kind gift from Dr. H Nakshatri, Indiana University School of Medicine, [38]). Stable pools of cells expressing Zeb1 were obtained after selection with G418 along with cell transduced with a control vector. A low E-cadherin cell line, H460 was transfected with Zeb1 shRNA plasmid vector (mixture of different shRNA constructs) from Santa Cruz Biotechnology (Santa Cruz, CA) to knockdown Zeb1 expression. Zeb1 knockdown and control (scrambled shRNA transfected) cells were selected with G418 and stably transfected pool of cells were analyzed. Zeb1 expression and knockdown was confirmed by western blot analysis.
Mouse xenograft experiments
All animal experiments were approved the Greater Los Angeles VA IACUC committee. 8-week old female CB17SCID/Beige mice (Taconics) were used in this study. H460 (5 x 10⁶) tumor cells were injected subcutaneously into the right supra scapular region of mice in 200 ul of normal saline using a tuberculin syringe. One week following tumor implantation when the tumors were palpable (10 mm x 10 mm), animals were injected with MS-275 (12 mg/kg/day) daily via intraperitoneal injections for five days [39]. Mice were sacrificed one week following MS-275 treatment and tumors weighed and kept frozen for further analysis. For RNA and protein analysis, frozen tumor tissues were ground and lysed in either RLT buffer (Qiagen RNA isolation kit, Valencia, CA) or in lysis buffer with protease inhibitor cocktail. Western blot analysis and transcript specific real time PCR assays were performed as described above.
Results
E-cadherin transcripts in lung cancer cell lines
To determine the relationship between E-cadherin expression and the RNA transcripts we chose the lung cancer model as this gene is frequently epigenetically silenced in lung cancer [26-28]. Prior studies have also shown that inhibition or reversal of epigenetic alteration can result in E-cadherin re-expression [26]. We examined a number of lung cancer lines with transcript specific real time PCR analysis and compared them to the non-tumorigenic immortalized Beas cells and Tert-kert cells. In Figure 1 the real time PCR expression level for different cells is adjusted to the expression in Beas cells. Based on the levels of E-cadherin RNA expression (Figure 1A) the lung cancer cell lines could be grouped into high expressors (H441, H292, H358) and low expressors (H460, RH2, H157). We next analyzed the levels of exon 11 skipped E-cadherin transcripts in these cell lines to determine if there was a correlation between a non-functional transcript and loss of expression. We observed that in low E-cadherin cell lines the difference between the Ct values of the two transcripts was smaller as compared to the high E-cadherin cell lines. This indicated that relative to the wild type transcript there is a higher amount of aberrant transcripts in low E-cadherin expressing cell lines. On the contrary, in high expressors the difference between Ct values was higher implying that the relative to the wild type transcript the ratio of aberrant transcript was lower. In Figure 1B the data is represented as exon 11 skipped transcripts as a percentage of the wild type (correctly spliced) transcript in log scale. Immortalized cells and high E-cadherin expressing cell lines have a smaller percentage of this transcript (0.06 to 0.63%) as compared to the low E-cadherin expressing cell lines (3-12.5%) (T-test, p-value = 0.04). This inverse correlation between E-cadherin expression and percentage exon 11 skipped transcripts suggests a mechanistic role of aberrant or ineffective splicing in modulating the overall E-cadherin expression levels.
Figure 1.
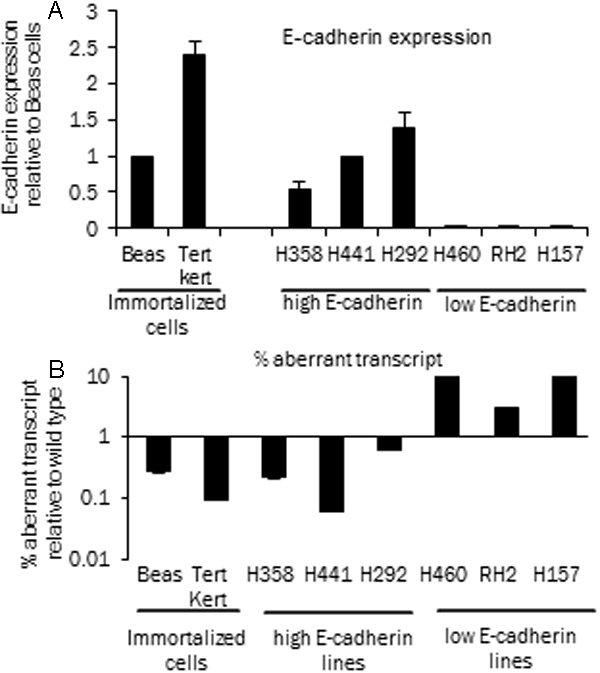
E-cadherin expression and aberrant transcript. A: Relative E-cadherin wild type RNA expression by real time PCR analysis (expression is shown relative to Beas cells, adjusted to actin). Beas and Tert transformed keratinocytes are immortalized lung cell lines, H358, H441 and H292 are High E-cadherin expressing cell lines. H460, RH2 and H157 are low E-cadherin expressing cell lines. B: % aberrant or exon 11 skipped E-cadherin transcripts in cell lines, calculated as a percentage of the wild type E-cadherin transcript (mean of three experiments). Transcript specific real time PCR was performed for the wild type and the exon 11 skipped or aberrant transcripts as described.
Changes in splicing pattern with HDACi treatment
Histone epigenetic modifications play a role both in gene silencing and alternative splicing [15,17] and previous studies have reported E-cadherin re-expression with HDACi exposure of lung cancer lines [23]. We therefore analyzed whether HDACi induced E-cadherin re-expression also alters splicing of this gene in lung cancer cell lines. The lung cancer lines were first examined for endogenous histone acetylation status by western blot analysis. Interestingly, the low E-cadherin expressing cell lines were also noted to have lower levels or complete absence of pan-acetylated histone H3 and H4 as compared to the high E-cadherin expressing cell lines with the exception of H460 that has weak acetylated histone H3 signal. The cell line H358 did not show a acetylated histone H4 signal on the western blot analysis and the signal of this acetylated histone on H292 was weak. Overall low E-cadherin cell lines were found to be histone hypoacetylated (Figure 2A), an evidence for epigenetic silencing as compared to the high E-cadherin expressing cell lines. H460 cell line was next treated with HDAC inhibitor MS-275 (2 μM concentration, 48 hour treatment) and an increase in the acetylated histones (pan-acetylated H3 and H4 antibody) (Figure 2B) was observed by western blot analysis. Similar increase in acetylated histones was observed in RH2 and H157 cell lines upon HDACi treatment (data not shown).
Figure 2.
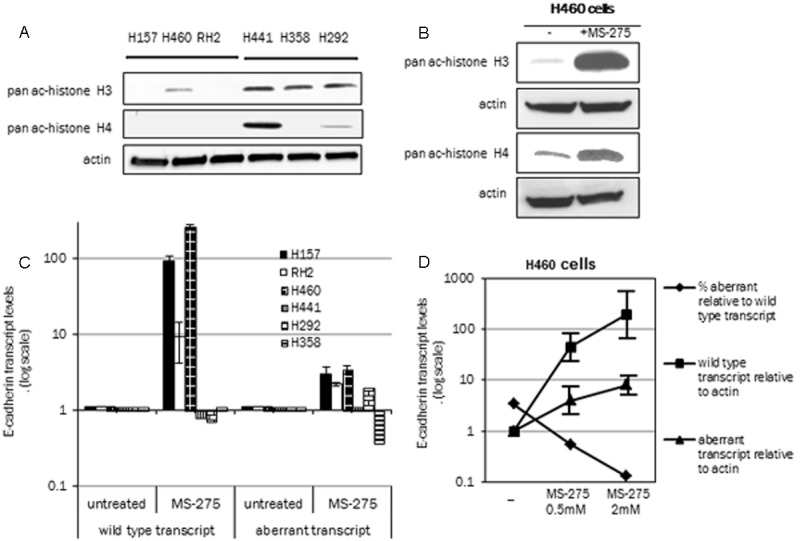
Histone acetylation and E-cadherin exon 11 splicing. A: Upper panels show the expression by western blot analysis expression of pan acetylated histone H3, middle panel, pan acetylated histone H4, lower panel, actin in lung cancer cell lines H157, H460 and RH2 (low E-cadherin cell lines) and H441, H358 and H292 (high E-cadherin cell lines). B: Western blot analysis of pan acetylated histones H3 and H4 in untreated (-) and MS-275 treated H460 cells (2 μM, 48 hours). C: Transcript specific real time PCR analysis of the wild type and aberrant transcripts (total level, adjusted to actin) in low E-cadherin expressing lung cancer cell lines. Cell lines were treated with MS-275 (2 μM, 48 hours). Data is shown relative to the expression in the non-treated cells (arbitrary value of 1). D: H460 cells were treated with two concentrations of MS-275 (0.5 and 2 μM for 48 hours) and analyzed for the two E-cadherin transcripts. The line diagram shows the changes in the two transcripts both as a % aberrant transcript relative to the wild type transcript and the total wild type and aberrant transcript (adjusted to actin). The change in total wild type and aberrant transcript is shown relative to the un-treated cells. % aberrant transcripts relative to the wild type are actual values in the untreated and MS-275 treated cells.
To determine the change in splicing pattern induced by HDACi transcript specific real time PCR analysis for both the correctly spliced wild type transcript and the aberrant transcript lacking exon 11 was performed as described (Material and Methods). In Figure 2C, MS-275 treated lung cancer cell lines (2 μM, 48 hour treatment) showed an increase in total wild type E-cadherin transcript (relative to actin) that ranged from 9-256 fold as compared to the non treated control cells (arbitrarily value of 1). This increase in E-cadherin RNA expression confirms previous reported results that this gene is epigenetically silenced due to histone hypoacetylation in certain lung cancer cell lines [27]. The aberrant transcript also increased with HDACi treatment (range 2.2-3.4 fold, untreated cells with a value of 1). The fold increase of the aberrant transcript was much lower than the fold increase in the wild-type transcript and is due to the overall increase in the E-cadherin promoter activity by the HDACi. Similar analysis of the high E-cadherin expressing cell lines (H441, H358 and H292) did not show an appreciable change in the two E-cadherin transcripts (Figure 2C).
H460 cells were also treated with two different concentrations of HDACi (0.5 μM and 2 μM MS-275) and analyzed by real time PCR. For clarification the change in E-cadherin transcript is shown as either % aberrant relative to wild type, or total transcript levels relative to actin (Figure 2D). There is a dose dependent decrease in % exon 11 skipped (aberrant) transcripts relative to wild type transcript upon HDACi treatment at the two concentrations. Identical data set analyzed relative to actin (total transcripts) shows that the wild type transcript is upregulated 180 fold upon HDACi treatment compared with only 8-fold increase in the aberrant transcript (2 μM MS-275 concentration). The HDACi exposure thus results in a preferential increase in the wild type transcript indicating a change in splicing pattern.
E-cadherin splicing pattern in the presence of NMD blockade
The aberrant transcript lacking exon 11 is a target for NMD mediated degradation [33]. One possible explanation for our results is that there could be a potential activation of the NMD pathway induced by HDACi. This activation could result in degradation of more incorrectly spliced transcripts as compared to the non-HDACi treated cells and thereby decreasing the relative percentage of the aberrant transcript as shown in Figure 2D. To study this, cells were treated with MS-275 for 48 hours at different concentrations and in the last 8 hours of the HDACi treatment, emetine was added [33] to block the NMD and prevent degradation of the aberrant transcripts. The fold induction of the two transcripts relative to the control cells (treated with emetine, no HDACi) was determined. The eight hour treatment with emetine was used as this resulted in the optimal inhibition of the NMD pathway [33]. Figure 3 shows transcript specific real time PCR analysis from lung cancer cell lines H460 and H157, two low E-cadherin expressing cell lines with this combined treatment approach. In H460 cell line (Figure 3A) the expression of wild type transcript increases at lower concentrations of HDACi and a smaller increase is noted at higher concentrations. At different MS-275 concentrations there is a much lower induction of the aberrant transcript of around 6 fold at 0.2 μm and 0.5 μm and 3 fold at 2 μm as compared to the wild type transcript that increases 25-30 fold as compared to baseline. In the H157 cell line (Figure 3B) also there is a difference in the induction pattern of the wild type and aberrant transcripts with a higher induction of the wild type transcript. The results show that even with a complete NMD blockage i.e. no degradation of the aberrant exon 11 lacking E-cadherin transcript there is a differential induction of the two transcripts. This indicates that HDACi treatment besides increasing transcription of the E-cadherin gene also changes the splicing pattern favoring expression of correctly spliced transcript in the two cell lines. The fold induction of the transcripts by MS-275 in the presence of emetine is however lower as compared to the induction with MS-275 alone (Figure 2C) as emetine being a translational inhibitor is toxic to the cells.
Figure 3.
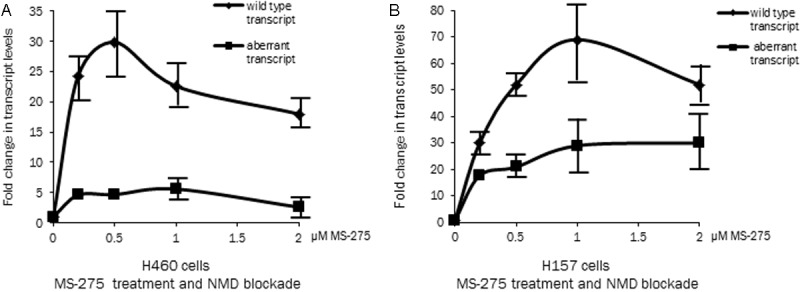
NMD inhibition and effect of HDACi: Transcript specific real time PCR analysis of two low E-cadherin expressing cell lines, H460 (panel A) and H157 (panel B) treated at different concentration of HDACi (0.2, 0.5, 1 and 2 μM MS-275 for 48 hours). To block the NMD pathway emetine was added to the cells in the last 8 hours of the MS-275 treatment. The line diagram shows the total transcript levels (wild type and aberrant, adjusted to actin) relative to cells that were treated with emetine but not with HDACi.
HDAC expression and effect of HDAC inactivation on splicing
In the context of low overall acetylation levels of the histones, aberrant splicing and reversal by HDACi we evaluated the expression of various histone deacetylases (HDACs) in the panel of lung lines. The HDACs are involved in the process of removing the acetylation marks on the histones and also complex with transcriptional corepressors [40]. The relative HDAC expression was analyzed by real time PCR (Figure 4A) for HDAC1-6. There was no clear pattern of HDAC RNA expression in the high and low E-cadherin lines, as the HDACs expression was observed in all the cell lines. There was however a higher HDAC3 and HDAC6 expression in H460 cell line. This expression analysis suggests that the low E-cadherin, hypoacetylated cell lines do not differ significantly in their expression of HDACs as compared to the high E-cadherin expressing cell lines.
Figure 4.
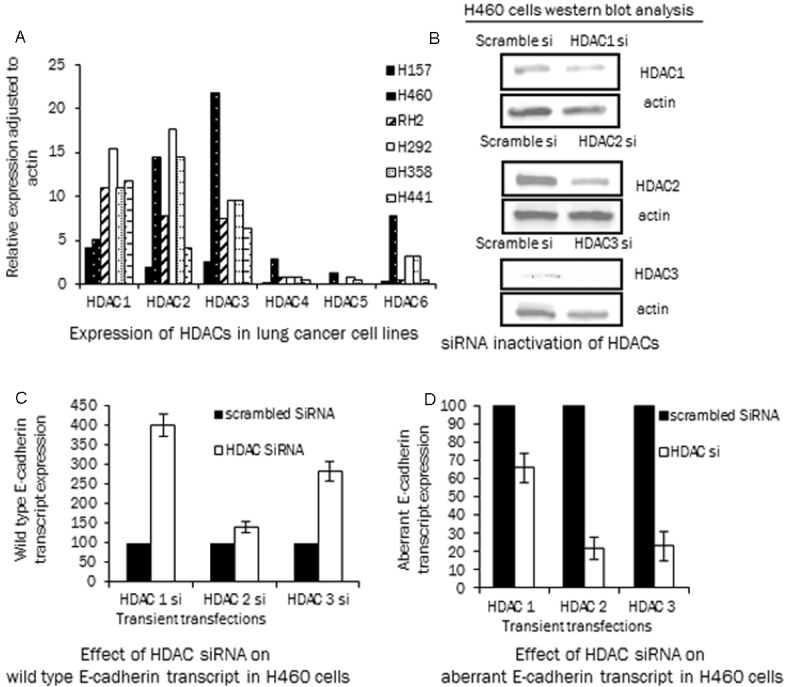
HDAC expression and aberrant splicing: A: Expression of HDAC1-6 in lung cancer cell lines by real time PCR, (adjusted to actin). B: Western blot analysis showing SiRNA mediated inactivation of HDAC 1, 2 and 3 in H460 cell line by transient transfection analyzed by specific HDAC 1, 2 and 3 antibodies. As a control the cell line was transfected with a scramble SiRNA. C: SiRNA mediated HDAC 1, 2 and 3 knockdown cells were analyzed for E-cadherin transcripts by transcript specific real time PCR. In panel C the inactivation of different HDACs results in an increase in wild type E-cadherin transcripts from 1.5 to 4 fold as compared to the scrambled SiRNA control cells (arbitrary value of 100). D: Identical cells as in panel C were analyzed for the exon 11 skipped transcript and with HDAC 1, 2 and 3 inactivation a decrease in the aberrant transcript is observed (control scrambled SiRNA cells have an arbitrary value of 100).
Besides the use of HDACi MS-275, that is known to inhibit HDAC1-3 [18,19], HDAC1, 2 and 3 were also specifically inactivated by siRNA in the H460 cell line to exclude the possibility of any non-specific effects of the HDACi. After a transient transfection of the specific SiRNA a western blot analyses was performed to confirm the downregulation of the corresponding HDAC (Figure 4B). In parallel, the siRNA transfected cells were also analyzed for the E-cadherin wild type and exon 11 skipped transcripts by real time PCR analysis. The HDAC 1, 2, or 3 knock-down resulted in an increase in the total (adjusted to actin) wild type E-cadherin transcript (Figure 4C, 1.4 to 4 fold). The total aberrant transcript (adjusted to actin) in the knock-down cells also showed a 30-80% decrease as compared to the scramble siRNA transfected cells (Figure 4D). Both HDACi and inactivation of HDACs thereby result in an exon 11 splicing pattern that allows preferential expression of correctly spliced transcripts.
ChIP analysis of E-cadherin promoter and exons
Recent reports point to specific histone modifications as a mechanism of alternative exon usage [14,15]. Therefore besides analyzing the global histone acetylation changes (Figure 2), we specifically analyzed the histone alterations at the E-cadherin promoter and exon 11 by chromatin immunoprecipitation analysis. The two neighboring exons, exon 10 and 12 were also analyzed to determine if there are specific exon 11 histone modifications that could result in aberrant splicing of this exon. ChIP was performed by acetylation specific antibodies to identify the acetylated histones. This analysis was extended to the panel of low and high E-cadherin cell lines (Figure 5A and 5B). With both the Ac-H3 and Ac-H4 antibodies the low E-cadherin cell lines were found to have low levels of histone acetylation as compared to the high E-cadherin expressing cell lines in the E-cadherin promoter region. This is also observed with Ac-H4 antibody in the exon 10, 11 and 12 regions as well. With the Ac-H3 antibody the acetylated histones in the high and low E-cadherin cell lines in the exonic regions are not different. The acetylation status of exon 11 that is aberrantly spliced is also not any different as compared to the neighboring exons 10 and 12 in the low and high E-cadherin cell lines. This data indicates that major difference in histone acetylation status between lung cancer cell lines is observed in the promoter region of the E-cadherin gene as compared to the individual exons. Although there are histone acetylation differences at the exonic level they are not as significant as those in the promoter region.
Figure 5.
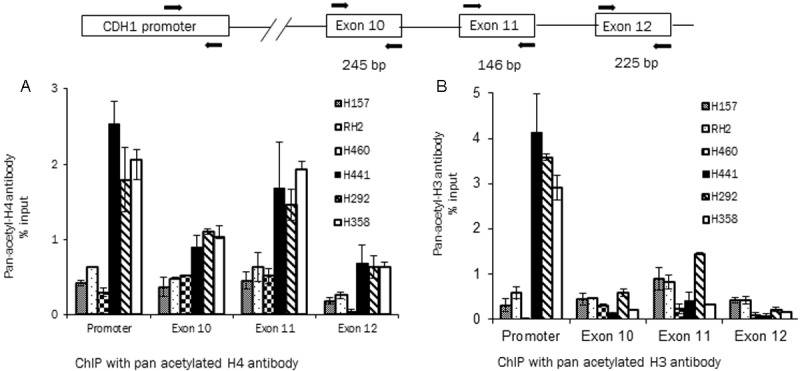
ChIP analysis of E-cadherin promoter and exons with acetylation specific anti histone antibodies. Panel A and B shows data from ChIP assays performed with pan- acetyl histone H4 antibody (panel A) and pan-acetyl histone H3 antibody (panel B) in the E-cadherin low and high cell lines. The E-cadherin promoter, exon 10, 11 and 12 were analyzed by different PCR reactions (upper schematic, contact author for further information). Data shown as percentage input, mean ± standard deviation. Experiments repeated twice with similar results.
E-cadherin splicing pattern and Zeb1 expression
To further study the mechanism of exon 11 aberrant splicing and epigenetic alterations we studied the EMT model to determine if there are splicing alterations of E-cadherin during this process. This is relevant for two reasons, firstly, the EMT process changes transcription of the E-cadherin promot er that affects splicing and secondly there is evidence that certain EMT inducers recruit HDACs to the promoters which results in a change in the acetylation of histones.
E-cadherin transcription is decreased during the EMT process by a number of EMT inducing transcription factors including Zeb1. The mechanism of action of this embryonic transcription factor is well described in lung cancer cell lines [41,42]. Panel of lung cancer cell lines were first analyzed for Zeb1 expression (Figure 6A) by a western blot analysis for Zeb1 and its expression was only observed in low E-cadherin expressing cell lines as reported earlier [43]. To induce EMT and inhibit E-cadherin transcription in a high E-cadherin expressing cell line H441 cells were transduced with Zeb1 retroviral vector [38]. The transduced pools of cells were selected and were analyzed for Zeb1 and E-cadherin expression. Figure 6B shows the loss of E-cadherin expression in the H441 cells ectopically expressing Zeb1. Induction of vimentin expression was also observed in the Zeb1 expressing H441 cells confirming the EMT process (data not shown) [44].
Figure 6.
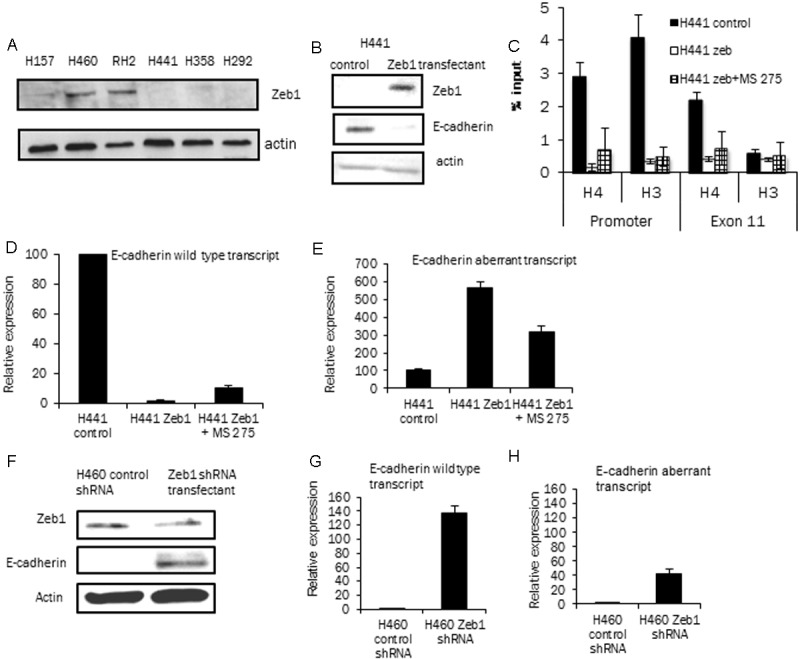
Effect of Zeb1 expression and knockdown on E-cadherin transcripts: A: Zeb1 expression in the lung cancer cell lines by western blot analysis (actin control). The low E-cadherin expressing cell lines (H157, H460 and RH2) show Zeb1 expression with no expression observed in the high E-cadherin expressing cell lines. B: Ectopic expression of Zeb1 in a high E-cadherin expressing cell line, H441. Western blot showing Zeb1 expression and E-cadherin silencing in H441 Zeb1 transfectant (actin control). C: ChIP analysis of H441 control, H441 Zeb1 expressing cells and H441 Zeb1 expressing cells treated with MS-275 (2 μM, 48 hours) with anti-pan acetylated H4 and H3 antibodies. The E-cadherin promoter and exon 11 of the E-cadherin gene were amplified from the immunoprecipitate. % input calculated as described, experiment repeated twice with similar results. D and E: Transcript specific PCR analysis of H441 control, H441 Zeb1, H441 Zeb1 MS-275 treated cells. Panel D is the data of wild type E-cadherin transcript relative to expression in the H441 control cells (arbitrary value of 100, adjusted to actin). Panel E shows data of aberrant transcript in the three cell lines (as in panel D) relative to expression in H441 control cells (arbitrary value of 100, adjusted to actin). Significant silencing of wild type E-cadherin transcript levels and an increase in aberrant transcript levels is observed with Zeb1 expression. F: Low E-cadherin expressing cell line H460 was transfected with Zeb1 shRNA plasmid to knockdown Zeb1 expression and pool of selected cells were analyzed. Western blot analysis shows decrease of Zeb1 expression and an increase in E-cadherin expression in the Zeb1 cshRNA transfectant cells. G and H panels show data from transcript specific real time PCR assay on these cells. In G the wild type E-cadherin expression increases 140 fold when Zeb1 expression is knocked down. In the same cells the aberrant transcript shows an increases but at a lower level (40 fold) as compared to the fold increase in the wild type transcript.
A ChIP analysis was performed to determine whether there are changes in the histone acetylation status with Zeb1 expression. The E-cadherin promoter and the exon 11 region of the gene were analyzed with pan-acetylation specific anti histone-H3 and anti-histone-H4 antibodies. Figure 6C shows that Zeb1 expression in these cells hypoacetylates the histones mainly in the E-cadherin promoter of this gene and to a lesser extent in the exon 11 region. With ectopic Zeb1 expression, hypocaetylation of the histones in the region of exon 11 was observed only with the anti histone pan acetylated H4 antibody. Zeb1 expressing H441 cells were also exposed to HDACi MS-275 (2 μM 48 hours) and this resulted in a small increase in the histone acetylation as expected by the ChIP assay.
H441 cell lines were then analyzed for the two E-cadherin transcripts to determine if Zeb1 expression and changes in E-cadherin transcription could alter splicing patterns. For this experiment the H441 Zeb1 cells were also treated with HDACi to re-express the silenced E-cadherin gene as previously described. Figure 6D and 6E show data from transcript specific real time PCR analysis from H441 control cells, H441 Zeb1 cells and H441 Zeb1 cells HDACi treated. Analysis of the wild type transcript (Figure 6D) shows a significant silencing of the gene with Zeb1 expression (2% of parent H441 cells) and a five-fold increase with HDACi (compared to the untreated H441 Zeb1 cells). The aberrant transcript in the same cell lines (Figure 6E) follows a different pattern as H441 Zeb1 expressing cells increase their total aberrant transcript (5.5 fold) even when the E-cadherin gene is significantly silenced (50 fold inhibition, Figure 6D). When the Zeb1 expressing cells H441 are treated with HDACi, there is an increase in the correctly spliced wild type transcript increasing 5 fold but the aberrant transcript decreases by 50% (compared to the untreated control). Thus Zeb1 expression and HDACi treatment affect the two E-cadherin transcripts in opposite ways. Zeb1 expression increases E-cadherin aberrant splicing in cells while HDACi treatment decreases aberrant splicing.
The role of Zeb1 in altering E-cadherin transcription and splicing was also studied in a low E-cadherin, high Zeb1 expressing cell line H460. In this cell line Zeb1 knockdown was achieved by stable transfection of a Zeb1 shRNA plasmid. This knockdown resulted in an increase in E-cadherin expression as observed by western blot analysis (Figure 6F). Analysis of the E-cadherin transcripts in these cell lines show that the two E-cadherin transcripts are increased with loss of Zeb1 expression but at different levels (Figure 6G and 6H). Wild type or correctly spliced transcript increases by 140 fold while the aberrant transcript also increases due to an increase in overall increase in transcription but to a lesser degree (40 fold versus 140 fold) than the wild type transcript. The data indicates that by altering Zeb1 expression the E-cadherin transcription rates are altered that in turn alter the splicing of this gene indicating a relationship between E-cadherin transcription rates and exon 11 splicing. With increasing E-cadherin transcription more correctly spliced transcripts are expressed and vice versa.
HDAC inhibition in mouse xenograft tumor model
To determine whether HDACi inhibitors also alter E-cadherin splicing in vivo, a xenograft mouse model was developed. The low E-cadherin H460 cell line was injected in the SCID/Beige mouse and subcutaneous tumors were established. The mice with palpable tumors in the treatment group were then injected with MS-275 intraperitoneally while the mice in the control group were injected with the diluent. The tumor sizes were measured a week after the last injection and a significant reduction in the size of tumors was noticed in the treatment group (t-test, p value, p = 0.0003) (Figure 7A). Tumor tissue was then analyzed for E-cadherin, acetylated H4 and vimentin expression by western blot analysis (Figure 7B). Acetylated histone H4 and E-cadherin expression were increased in the tumors of MS-275 treated mice indicating effect of the drug and re-expression of the silenced E-cadherin gene. The tumors also showed a decrease in vimentin, a mesenchymal marker indicating a reversal of the EMT process [44]. To assess the changes in splicing patterns in vivo, tumor RNA was analyzed by transcript specific real time PCR as described earlier. The wild type E-cadherin transcript increased by a mean of 12 fold (n = 4 mice) with in vivo HDACi treatment as compared to the control untreated mice (n = 4 mice) (Figure 7C). The data was also analyzed as percentage aberrant transcript relative to wild type and a decrease in the % aberrant transcript in the HDACi treated tumors was noted (from 6% to 1.5%, n = 4) (Figure 7D). The mouse xenograft data suggests that the MS-275 induced histone acetylation in tumors changes E-cadherin RNA expression and splicing with a preferential increase in correctly spliced transcripts. This increased E-cadherin expression also results in EMT reversal and tumor growth suppression in vivo.
Figure 7.
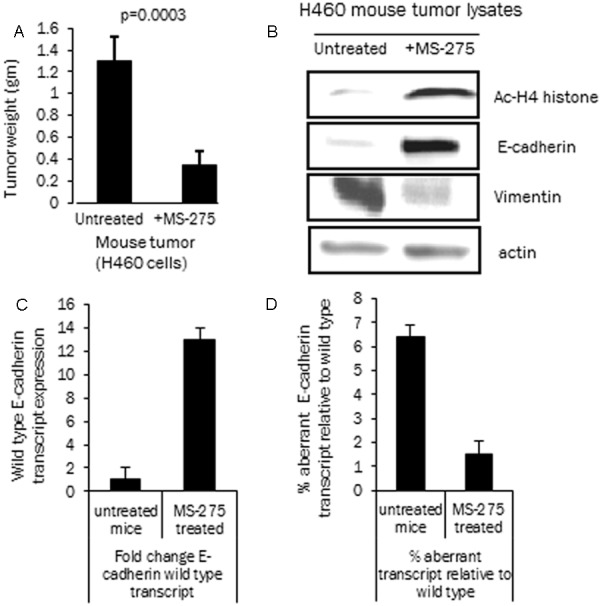
Effect of HDAC inhibition on E-cadherin expression and splicing in the mouse xenograft model. A: Mouse tumor weight from control non-treated mice and mice treated with HDAC inhibitor MS-275 (H460 cell line, n = 4, wt in grams) as described. Bar diagram shows tumor weight (mean and standard deviation, p = 0.0003, t-test) in the two groups. B: Western blot analysis of H460 cell line tumor lysates from control tumors and MS-275 treated mouse tumors. E-cadherin, acetylated histone H4, vimentin and actin expression analyzed with specific antibodies. The tumors show increased acetylation of histone H4 (Ac-H4) in vivo along with E-cadherin re-expression. Vimentin expression is decreased with HDACi treatment due to the reversal of EMT process. C: Fold change in total wild type E-cadherin transcript in tumor tissue with MS-275 treatment (from untreated and MS-275 treated mice tumors, relative to actin). D: Percentage aberrant E-cadherin transcript in tumor tissue relative to wild type E-cadherin transcript in the untreated and MS-275 treated tumors.
Discussion
Our results show that splicing pattern of the E-cadherin exon 11 can be modulated by a number of biological processes that include epigenetic alterations and transcription. With reversal of epigenetic alterations by HDAC inhibitors this study shows that the splicing pattern of E-cadherin exon 11 changes. Experiments with ectopic expression of Zeb1 provide direct evidence that epigenetic modification of the histones and decreasing E-cadherin transcription results in a differential splicing pattern as well. As the E-cadherin transcripts that lack exon 11 are non-functional and are subjected to NMD mediated degradation this change in splicing affects E-cadherin expression that is biologically relevant for a number of malignancies. The modulation of splicing pattern induced by epigenetic modifier is a novel mechanism by which this class of therapeutic agents modulate gene expression as there is a change in the nature of the RNA transcripts.
The HDACi treatment of low E-cadherin expressing lung cancer H460 cell line does result in an overall increase in the aberrant transcript as they increase by 8 fold as compared to the untreated cells and at the same time the correctly spliced transcripts increase by 180 fold. Even though the increase in aberrant transcript levels appears paradoxical it is expected as the overall E-cadherin transcription increases with HDACi exposure. For these reasons the data was also analyzed for percentage aberrant transcript relative to the wild type and this shows a consistent decrease in the aberrant transcript with HDACi exposure. The increase in wild type transcripts is potentially a combination of an increase in transcription as well as an increase in correctly spliced transcripts. This effect is not due to alteration in the NMD degradation pathway as inhibiting the pathway along with HDACi exposure also resulted in a higher fold increase in the wild type transcript. A correction of aberrant splicing by HDACi should reduce the aberrantly spliced transcript with a corresponding increase in the wild type transcript, however, this can only be observed at a constant transcriptional rate and not feasible with epigenetic modifiers that alter gene transcription as well.
The low E-cadherin expressing cell lines found to have hypoacetylated histones in the region of E-cadherin promoter. By the ChIP assay there were more significant epigenetic alterations in the region of the E-cadherin promoter as compared to the individual exons that were tested. The effect of HDACi on splicing has been previously reported, one example being the skipping of exon 18 of the NCAM gene [45]. In this model neuronal cell depolarization altered intragenic histone acetylation that led to exon skipping. Another relevant finding of the study was that the histone modification at the intragenic site was not seen at the promoter arguing for a role of certain exonic histone modifications in splicing. The analysis of histone modifications in the lung cancer cell lines and the change induced by HDACi indicates that the modifications at the gene promoter are more relevant than the modifications in the exonic regions.
Epigenetic modifications play an important role in carcinogenesis and this has led to development of epigenetic modifiers that are able to re-express silenced genes and are active therapeutic agents in the treatment of cancer [18]. Recent reports have described that epigenetic modifiers such as HDACi also alter gene splicing patterns of a number of genes [45,46]. This was recently confirmed on a global scale by an exon array analysis RNA splicing pattern of HDACi treated cells that showed changes in the RNA transcript as chromatin structure was altered by HDACi [47]. In another study alternative gene splicing events were found to cluster with specific epigenetic alterations of histone methylation and acetylation when an in silico correlative analysis was performed [21] implying a role of epigenetic alterations in gene splicing.
Transcription and splicing are intricately linked and splicing often occurs co-transcriptionally [14,48]. Activity of the promoter and the assembled transcriptional machinery can also influence splicing of exons including inclusion and exclusion of alternative exons. This was first shown in the case of a fibronectin exon by analyzing its splicing when the transcription was driven with different promoters [8]. The HDACi increase the transcriptional activity of the promoters by altering the nature of the transcriptional complex assembled at the gene promoter. The C-terminal domain of the RNA polymerase II is known to play a role in the coupling of transcription and splicing as deletions of this domain results in defects in splicing [49]. This RNA polymerase II domain also interacts with serine-arginine rich (SR proteins) proteins that function as splicing factors [50]. Other possible mechanisms by which the HDACi could alter splicing include changing accessibility of the chromatin to the splicing machinery [17], SWI/SNF chromatin remodeling complex [51], and RNA Pol II elongation rate [14].
Experiments with Zeb1 expression and knockdown confirm the role of epigenetic alterations, gene transcription and E-cadherin splicing. Expression of this EMT inducer decreases E-cadherin gene transcription but results in an increase in the levels of the aberrant transcript. This clearly shows that splicing is being altered by Zeb1 expression and furthermore the decrease in wild type E-cadherin transcript is due to a combination of transcriptional inhibition and ineffective splicing. Similar results were obtained with Zeb1 knockdown in a Zeb1 expressing low E-cadherin cell line as it results in an increase in E-cadherin transcription with a higher fold induction of wild type transcript as compared to the aberrant transcript. A number of transcriptional repressors have been identified that inhibit E-cadherin transcription and promote EMT including Snail, Slug, and Zeb1 and 2 [30,44]. Interestingly, a mechanism of their action involves recruitment of HDACs to the E-cadherin promoter [52] that results in deacetylation of H3 and H4 histones. The EMT inducer and transcription factor Snail interacts with the E-cadherin promoter and recruits HDAC activity along with co-repressor SIN3 [52] to form complexes that inhibit E-cadherin promoter activity and also chromatin modifying activity. It is plausible that these transcriptional repressors and the interacting HDACs have a dual effect; to inhibit E-cadherin transcription and induce its aberrant splicing by epigenetic alterations.
The exon 11 skipping in one of the E-cadherin transcripts can also considered as an alternative splicing event as the exon 11 skipped transcript is seen in non-malignant cells as well albeit at very low levels. One of the models for the mechanism of alternative splicing is the kinetic model for regulation of alternative splicing proposed by Kornblihtt [14]. It is proposed that the rate of transcription affects the inclusion of alternative exons with higher rates of transcription resulting in more skipping while slow rates would increase the incorporation of alternative exons. Experiments with a mutant form of Pol II with a slower elongation rate resulted in more RNA with inclusion of alternative exons [48,53]. This is presumably due to a weak 3’ splice site of the alternative exon that is not able to compete with the 3’ splice site of the downstream exon. With low transcription rates the alternative exon is spliced in while it is excluded with faster transcription rate. The increased incorporation of exon 11 in the transcripts after HDACi exposure is not explained by this model. It is possible that removal or reversal of epigenetic modifications alters the chromatin structure results in a way that results in higher transcription rates and reduced alternative splice events.
The mouse tumor experiments provide a proof of principle that splicing of this gene can be altered in vivo by administration of HDAC inhibitors. These inhibitors are seeing increasing clinical use in cancer patients with various leukemias and are being tested in clinical trials in a number of human malignancies [18]. It is imperative that their role in altering splicing in vivo is well understood as these agents will globally impact gene splicing [47]. HDACi treated mice tumors change E-cadherin transcripts similar to the in vitro data with an approximately four fold lower induction in the aberrant transcript than the wild type transcript or a preferential increase in the wild type transcript. The resulting re-expression of E-cadherin is functionally and biologically relevant as the cells undergo a reversal of the EMT process with E-cadherin re-expression and a decrease in vimentin expression. The tumor growth inhibition observed in mice treated with MS-275 is related to cells re-acquiring an epithelial phenotype and a subsequent G1 arrest that has been reported in cells undergoing reversal of EMT [54].
The interplay between epigenetic modifications and gene splicing is very interesting as the epigenetic modifications in tumor cells is widespread and there is potential that a number of genes could be aberrantly spliced. The histone acetylation status clearly is one of the epigenetic factors that affects splicing and further studies are needed to fully characterize the whole spectrum of epigenetic modifications that result in the E-cadherin exon 11 splicing defect. The effect of epigenetic modifiers on splicing raises the possibility that these drugs can be developed to modulate splicing patterns in vivo in addition to re-expressing epigenetically silenced genes. The exon 11 E-cadherin splicing defect can be used as a model to further explore the effect of epigenetic alterations on gene splicing.
Acknowledgements
SS is a recipient of a grant from Flight Attendants Medical Research Institute (FAMRI), ASCO Foundation Young Investigator Award and a VA Merit Research award. Steven Dubinett and Sherven Sharma are supported by NIH Grants (RO1 CA95686, RO1 CA126944 and P50 CA90388), UCLA Lung Cancer Program, VA Medical Research Funds and Tobacco Related Disease Program Award Program of University of California.
Disclosure of conflict of interest
Dr. Dubinett is on the scientific advisory board for Tragara Pharmaceuticals. Other authors have no conflict of interest to disclose.
Abbreviations
- HDAC
histone deacetylase
- HDACi
histone deacetylase inhibitor
References
- 1.Venables JP, Klinck R, Koh C, Gervais-Bird J, Bramard A, Inkel L, Durand M, Couture S, Froehlich U, Lapointe E, Lucier JF, Thibault P, Rancourt C, Tremblay K, Prinos P, Chabot B, Elela SA. Cancer-associated regulation of alternative splicing. Nat Struct Mol Biol. 2009;16:670–6. doi: 10.1038/nsmb.1608. [DOI] [PubMed] [Google Scholar]
- 2.David CJ, Manley JL. Alternative pre-mRNA splicing regulation in cancer: pathways and programs unhinged. Genes Dev. 2010;24:2343–64. doi: 10.1101/gad.1973010. [DOI] [PMC free article] [PubMed] [Google Scholar]
- 3.Sharma S, Liao W, Zhou X, Wong DT, Lichtenstein A. Exon 11 skipping of E-cadherin RNA downregulates its expression in head and neck cancer cells. Mol Cancer Ther. 2011;10:1751–9. doi: 10.1158/1535-7163.MCT-11-0248. [DOI] [PMC free article] [PubMed] [Google Scholar]
- 4.Sharma S, Lichtenstein A. Aberrant splicing of the E-cadherin transcript is a novel mechanism of gene silencing in chronic lymphocytic leukemia cells. Blood. 2009;114:4179–85. doi: 10.1182/blood-2009-03-206482. [DOI] [PMC free article] [PubMed] [Google Scholar]
- 5.Black DL. Mechanisms of alternative pre-messenger RNA splicing. Annu Rev Biochem. 2003;72:291–336. doi: 10.1146/annurev.biochem.72.121801.161720. [DOI] [PubMed] [Google Scholar]
- 6.Chasin LA. Searching for splicing motifs. Adv Exp Med Biol. 2007;623:85–106. doi: 10.1007/978-0-387-77374-2_6. [DOI] [PubMed] [Google Scholar]
- 7.Kornblihtt AR. Promoter usage and alternative splicing. Curr Opin Cell Biol. 2005;17:262–8. doi: 10.1016/j.ceb.2005.04.014. [DOI] [PubMed] [Google Scholar]
- 8.Cramer P, Pesce CG, Baralle FE, Kornblihtt AR. Functional association between promoter structure and transcript alternative splicing. Proc Natl Acad Sci U S A. 1997;94:11456–60. doi: 10.1073/pnas.94.21.11456. [DOI] [PMC free article] [PubMed] [Google Scholar]
- 9.Munoz MJ, de la Mata M, Kornblihtt AR. The carboxy terminal domain of RNA polymerase II and alternative splicing. Trends Biochem Sci. 2010;35:497–504. doi: 10.1016/j.tibs.2010.03.010. [DOI] [PubMed] [Google Scholar]
- 10.Couch FJ, Weber BL. Mutations and polymorphisms in the familial early-onset breast cancer (BRCA1) gene. Breast Cancer Information Core. Hum Mutat. 1996;8:8–18. doi: 10.1002/humu.1380080102. [DOI] [PubMed] [Google Scholar]
- 11.Abbas S, Erpelinck-Verschueren CA, Goudswaard CS, Lowenberg B, Valk PJ. Mutant Wilms' tumor 1 (WT1) mRNA with premature termination codons in acute myeloid leukemia (AML) is sensitive to nonsense-mediated RNA decay (NMD) Leukemia. 2010;24:660–663. doi: 10.1038/leu.2009.265. [DOI] [PubMed] [Google Scholar]
- 12.Bartel F, Taubert H, Harris LC. Alternative and aberrant splicing of MDM2 mRNA in human cancer. Cancer Cell. 2002;2:9–15. doi: 10.1016/s1535-6108(02)00091-0. [DOI] [PubMed] [Google Scholar]
- 13.Karni R, de Stanchina E, Lowe SW, Sinha R, Mu D, Krainer AR. The gene encoding the splicing factor SF2/ASF is a proto-oncogene. Nat Struct Mol Biol. 2007;14:185–93. doi: 10.1038/nsmb1209. [DOI] [PMC free article] [PubMed] [Google Scholar]
- 14.Kornblihtt AR. Chromatin, transcript elongation and alternative splicing. Nat Struct Mol Biol. 2006;13:5–7. doi: 10.1038/nsmb0106-5. [DOI] [PubMed] [Google Scholar]
- 15.Luco RF, Pan Q, Tominaga K, Blencowe BJ, Pereira-Smith OM, Misteli T. Regulation of alternative splicing by histone modifications. Science. 2010;327:996–1000. doi: 10.1126/science.1184208. [DOI] [PMC free article] [PubMed] [Google Scholar]
- 16.Fullgrabe J, Kavanagh E, Joseph B. Histone onco-modifications. Oncogene. 2011;30:3391–403. doi: 10.1038/onc.2011.121. [DOI] [PubMed] [Google Scholar]
- 17.Schwartz S, Meshorer E, Ast G. Chromatin organization marks exon-intron structure. Nat Struct Mol Biol. 2009;16:990–5. doi: 10.1038/nsmb.1659. [DOI] [PubMed] [Google Scholar]
- 18.Lane AA, Chabner BA. Histone deacetylase inhibitors in cancer therapy. J. Clin. Oncol. 2009;27:5459–68. doi: 10.1200/JCO.2009.22.1291. [DOI] [PubMed] [Google Scholar]
- 19.Ellis L, Atadja PW, Johnstone RW. Epigenetics in cancer: targeting chromatin modifications. Mol Cancer Ther. 2009;8:1409–20. doi: 10.1158/1535-7163.MCT-08-0860. [DOI] [PubMed] [Google Scholar]
- 20.Khan DH, Jahan S, Davie JR. Pre-mRNA splicing: role of epigenetics and implications in disease. Adv Biol Regul. 2012;52:377–88. doi: 10.1016/j.jbior.2012.04.003. [DOI] [PubMed] [Google Scholar]
- 21.Zhou Y, Lu Y, Tian W. Epigenetic features are significantly associated with alternative splicing. BMC Genomics. 2012;13:123. doi: 10.1186/1471-2164-13-123. [DOI] [PMC free article] [PubMed] [Google Scholar]
- 22.Seligson DB, Horvath S, McBrian MA, Mah V, Yu H, Tze S, Wang Q, Chia D, Goodglick L, Kurdistani SK. Global levels of histone modifications predict prognosis in different cancers. Am J Pathol. 2009;174:1619–28. doi: 10.2353/ajpath.2009.080874. [DOI] [PMC free article] [PubMed] [Google Scholar]
- 23.Pecina-Slaus N. Tumor suppressor gene E-cadherin and its role in normal and malignant cells. Cancer Cell Int. 2003;3:17. doi: 10.1186/1475-2867-3-17. [DOI] [PMC free article] [PubMed] [Google Scholar]
- 24.Jeanes A, Gottardi CJ, Yap AS. Cadherins and cancer: how does cadherin dysfunction promote tumor progression? Oncogene. 2008;27:6920–9. doi: 10.1038/onc.2008.343. [DOI] [PMC free article] [PubMed] [Google Scholar]
- 25.Kim DS, Kim MJ, Lee JY, Kim YZ, Kim EJ, Park JY. Aberrant methylation of E-cadherin and H-cadherin genes in nonsmall cell lung cancer and its relation to clinicopathologic features. Cancer. 2007;110:2785–92. doi: 10.1002/cncr.23113. [DOI] [PubMed] [Google Scholar]
- 26.Witta SE, Gemmill RM, Hirsch FR, Coldren CD, Hedman K, Ravdel L, Helfrich B, Dziadziuszko R, Chan DC, Sugita M, Chan Z, Baron A, Franklin W, Drabkin HA, Girard L, Gazdar AF, Minna JD, Bunn PA Jr. Restoring E-cadherin expression increases sensitivity to epidermal growth factor receptor inhibitors in lung cancer cell lines. Cancer Res. 2006;66:944–50. doi: 10.1158/0008-5472.CAN-05-1988. [DOI] [PubMed] [Google Scholar]
- 27.Frederick BA, Helfrich BA, Coldren CD, Zheng D, Chan D, Bunn PA Jr, Raben D. Epithelial to mesenchymal transition predicts gefitinib resistance in cell lines of head and neck squamous cell carcinoma and non-small cell lung carcinoma. Mol Cancer Ther. 2007;6:1683–91. doi: 10.1158/1535-7163.MCT-07-0138. [DOI] [PubMed] [Google Scholar]
- 28.Shibanuma H, Hirano T, Tsuji K, Wu Q, Shrestha B, Konaka C, Ebihara Y, Kato H. Influence of E-cadherin dysfunction upon local invasion and metastasis in non-small cell lung cancer. Lung Cancer. 1998;22:85–95. doi: 10.1016/s0169-5002(98)00053-1. [DOI] [PubMed] [Google Scholar]
- 29.Peinado H, Olmeda D, Cano A. Snail, Zeb and bHLH factors in tumour progression: an alliance against the epithelial phenotype? Nat Rev Cancer. 2007;7:415–28. doi: 10.1038/nrc2131. [DOI] [PubMed] [Google Scholar]
- 30.Mani SA, Guo W, Liao MJ, Eaton EN, Ayyanan A, Zhou AY, Brooks M, Reinhard F, Zhang CC, Shipitsin M, Campbell LL, Polyak K, Brisken C, Yang J, Weinberg RA. The epithelial-mesenchymal transition generates cells with properties of stem cells. Cell. 2008;133:704–15. doi: 10.1016/j.cell.2008.03.027. [DOI] [PMC free article] [PubMed] [Google Scholar]
- 31.Ke XS, Qu Y, Cheng Y, Li WC, Rotter V, Oyan AM, Kalland KH. Global profiling of histone and DNA methylation reveals epigenetic-based regulation of gene expression during epithelial to mesenchymal transition in prostate cells. BMC Genomics. 2010;11:669. doi: 10.1186/1471-2164-11-669. [DOI] [PMC free article] [PubMed] [Google Scholar]
- 32.Frischmeyer PA, Dietz HC. Nonsense-mediated mRNA decay in health and disease. Hum Mol Genet. 1999;8:1893–900. doi: 10.1093/hmg/8.10.1893. [DOI] [PubMed] [Google Scholar]
- 33.Noensie EN, Dietz HC. A strategy for disease gene identification through nonsense-mediated mRNA decay inhibition. Nat Biotechnol. 2001;19:434–9. doi: 10.1038/88099. [DOI] [PubMed] [Google Scholar]
- 34.Ke Y, Reddel RR, Gerwin BI, Miyashita M, McMenamin M, Lechner JF, Harris CC. Human bronchial epithelial cells with integrated SV40 virus T antigen genes retain the ability to undergo squamous differentiation. Differentiation. 1988;38:60–6. doi: 10.1111/j.1432-0436.1988.tb00592.x. [DOI] [PubMed] [Google Scholar]
- 35.Park NH, Min BM, Li SL, Huang MZ, Cherick HM, Doniger J. Immortalization of normal human oral keratinocytes with type 16 human papillomavirus. Carcinogenesis. 1991;12:1627–31. doi: 10.1093/carcin/12.9.1627. [DOI] [PubMed] [Google Scholar]
- 36.Cui X, Yang SC, Sharma S, Heuze-Vourc'h N, Dubinett SM. IL-4 regulates COX-2 and PGE2 production in human non-small cell lung cancer. Biochem Biophys Res Commun. 2006;343:995–1001. doi: 10.1016/j.bbrc.2006.03.073. [DOI] [PubMed] [Google Scholar]
- 37.Pfaffl MW. A new mathematical model for relative quantification in real-time RT-PCR. Nucleic Acids Res. 2001;29:e45. doi: 10.1093/nar/29.9.e45. [DOI] [PMC free article] [PubMed] [Google Scholar]
- 38.Chua HL, Bhat-Nakshatri P, Clare SE, Morimiya A, Badve S, Nakshatri H. NF-kappaB represses E-cadherin expression and enhances epithelial to mesenchymal transition of mammary epithelial cells: potential involvement of ZEB-1 and ZEB-2. Oncogene. 2007;26:711–24. doi: 10.1038/sj.onc.1209808. [DOI] [PubMed] [Google Scholar]
- 39.Camphausen K, Scott T, Sproull M, Tofilon PJ. Enhancement of xenograft tumor radiosensitivity by the histone deacetylase inhibitor MS-275 and correlation with histone hyperacetylation. Clin Cancer Res. 2004;10:6066–71. doi: 10.1158/1078-0432.CCR-04-0537. [DOI] [PubMed] [Google Scholar]
- 40.Glass CK, Rosenfeld MG. The coregulator exchange in transcriptional functions of nuclear receptors. Genes Dev. 2000;14:121–41. [PubMed] [Google Scholar]
- 41.Dohadwala M, Yang SC, Luo J, Sharma S, Batra RK, Huang M, Lin Y, Goodglick L, Krysan K, Fishbein MC, Hong L, Lai C, Cameron RB, Gemmill RM, Drabkin HA, Dubinett SM. Cyclooxygenase-2-dependent regulation of E-cadherin: prostaglandin E (2) induces transcriptional repressors ZEB1 and snail in non-small cell lung cancer. Cancer Res. 2006;66:5338–45. doi: 10.1158/0008-5472.CAN-05-3635. [DOI] [PubMed] [Google Scholar]
- 42.Takeyama Y, Sato M, Horio M, Hase T, Yoshida K, Yokoyama T, Nakashima H, Hashimoto N, Sekido Y, Gazdar AF, Minna JD, Kondo M, Hasegawa Y. Knockdown of ZEB1, a master epithelial-to-mesenchymal transition (EMT) gene, suppresses anchorage-independent cell growth of lung cancer cells. Cancer Lett. 2010;296:216–24. doi: 10.1016/j.canlet.2010.04.008. [DOI] [PMC free article] [PubMed] [Google Scholar]
- 43.Kakihana M, Ohira T, Chan D, Webster RB, Kato H, Drabkin HA, Gemmill RM. Induction of E-cadherin in lung cancer and interaction with growth suppression by histone deacetylase inhibition. J Thorac Oncol. 2009;4:1455–65. doi: 10.1097/JTO.0b013e3181bc9419. [DOI] [PMC free article] [PubMed] [Google Scholar]
- 44.Thiery JP. Epithelial-mesenchymal transitions in tumour progression. Nat Rev Cancer. 2002;2:442–54. doi: 10.1038/nrc822. [DOI] [PubMed] [Google Scholar]
- 45.Schor IE, Rascovan N, Pelisch F, Allo M, Kornblihtt AR. Neuronal cell depolarization induces intragenic chromatin modifications affecting NCAM alternative splicing. Proc Natl Acad Sci U S A. 2009;106:4325–30. doi: 10.1073/pnas.0810666106. [DOI] [PMC free article] [PubMed] [Google Scholar]
- 46.Fujii S, Ochiai A. Enhancer of zeste homolog 2 downregulates E-cadherin by mediating histone H3 methylation in gastric cancer cells. Cancer Sci. 2008;99:738–46. doi: 10.1111/j.1349-7006.2008.00743.x. [DOI] [PMC free article] [PubMed] [Google Scholar]
- 47.Hnilicova J, Hozeifi S, Duskova E, Icha J, Tomankova T, Stanek D. Histone deacetylase activity modulates alternative splicing. PLoS One. 2011;6:e16727. doi: 10.1371/journal.pone.0016727. [DOI] [PMC free article] [PubMed] [Google Scholar]
- 48.de la Mata M, Alonso CR, Kadener S, Fededa JP, Blaustein M, Pelisch F, Cramer P, Bentley D, Kornblihtt AR. A slow RNA polymerase II affects alternative splicing in vivo. Mol Cell. 2003;12:525–32. doi: 10.1016/j.molcel.2003.08.001. [DOI] [PubMed] [Google Scholar]
- 49.McCracken S, Fong N, Yankulov K, Ballantyne S, Pan G, Greenblatt J, Patterson SD, Wickens M, Bentley DL. The C-terminal domain of RNA polymerase II couples mRNA processing to transcription. Nature. 1997;385:357–61. doi: 10.1038/385357a0. [DOI] [PubMed] [Google Scholar]
- 50.Yuryev A, Patturajan M, Litingtung Y, Joshi RV, Gentile C, Gebara M, Corden JL. The C-terminal domain of the largest subunit of RNA polymerase II interacts with a novel set of serine/arginine-rich proteins. Proc Natl Acad Sci U S A. 1996;93:6975–80. doi: 10.1073/pnas.93.14.6975. [DOI] [PMC free article] [PubMed] [Google Scholar]
- 51.Batsche E, Yaniv M, Muchardt C. The human SWI/SNF subunit Brm is a regulator of alternative splicing. Nat Struct Mol Biol. 2006;13:22–9. doi: 10.1038/nsmb1030. [DOI] [PubMed] [Google Scholar]
- 52.Peinado H, Ballestar E, Esteller M, Cano A. Snail mediates E-cadherin repression by the recruitment of the Sin3A/histone deacetylase 1 (HDAC1)/HDAC2 complex. Mol Cell Biol. 2004;24:306–19. doi: 10.1128/MCB.24.1.306-319.2004. [DOI] [PMC free article] [PubMed] [Google Scholar]
- 53.Howe KJ, Kane CM, Ares M Jr. Perturbation of transcription elongation influences the fidelity of internal exon inclusion in Saccharomyces cerevisiae. RNA. 2003;9:993–1006. doi: 10.1261/rna.5390803. [DOI] [PMC free article] [PubMed] [Google Scholar]
- 54.Mejlvang J, Kriajevska M, Vandewalle C, Chernova T, Sayan AE, Berx G, Mellon JK, Tulchinsky E. Direct repression of cyclin D1 by SIP1 attenuates cell cycle progression in cells undergoing an epithelial mesenchymal transition. Mol Biol Cell. 2007;18:4615–24. doi: 10.1091/mbc.E07-05-0406. [DOI] [PMC free article] [PubMed] [Google Scholar]