

Abstract
We present a statistical method SAINT-MS1 for scoring protein-protein interactions based on the label-free MS1 intensity data from affinity purification - mass spectrometry (AP-MS) experiments. The method is an extension of Significance Analysis of INTeractome (SAINT), a model-based method previously developed for spectral count data. We reformulated the statistical model for the log-transformed intensity data, including adequate treatment of missing observations, i.e. interactions whose quantitative data are inconsistent over replicate purifications. We demonstrate the performance of SAINT-MS1 using two recently published datasets: a small LTQ-Orbitrap dataset with three replicate purifications of single human bait protein and control purifications, and a larger drosophila dataset targeting insulin receptor/target of rapamycin signaling pathway generated using an LTQ-FT instrument. Using the drosophila dataset, we also compare and discuss the performance of SAINT analysis based on spectral count and MS1 intensity data in terms of the recovery of orthologous and literature-curated interactions. Given rapid advances in high mass accuracy instrumentation and intensity-based label-free quantification software, we expect that SAINT-MS1 will become a useful tool allowing improved detection of protein interactions in label-free AP-MS data, especially in the low abundance range.
Keywords: protein-protein interaction, interaction scoring, affinity purification, mass spectrometry, spectral counts, intensity
INTRODUCTION
Affinity purification coupled with mass spectrometry (AP-MS) is a popular method for mapping protein-protein interaction (PPI) networks [1]. While there are alternative approaches for identifying physical interactions between proteins, e.g. yeast two-hybrid screening [2], AP-MS offers a complementary perspective and has several advantages [3, 4]. In AP-MS, target proteins (baits) are co-purified with their interaction partners (preys) through affinity purification such as epitope tag-based immunoprecipitation. The protein mixture resulting from the purification is digested into peptides, which are identified using tandem mass spectrometry (MS/MS, or MS2). Purification of multiple baits reveals protein complexes in the target interaction network [5–8]. This method has proved to be powerful for mapping both local networks [8–13] as well as global PPI networks [14, 15]. The utility of quantitative information for detection of true protein interactions in the context of labeling-based experiments has been long established [16–18]. However, quantitative data such as spectral counts or integrated peptide ion intensities associated with each interaction can be extracted and used even in label-free AP-MS experiments. This label-free quantitative data can improve interaction scoring because bona fide interactions can be distinguished from nonspecifically binding proteins via the analysis of quantitative protein profiles across multiple purifications with different bait proteins and in the negative controls (if available).
As label-free quantitative information is increasingly utilized for the analysis of AP-MS data, it is crucial to develop statistically sound methods for scoring interactions. Several approaches for this type of datasets have been recently reported. Sardiu et al utilized the normalized spectral abundance factors for improved elimination of proteins observed in the negative control runs [8]. CompPASS rescales observed spectral counts reflecting the reproducibility of detection across biological replicates and the frequency of observing prey proteins in purifications with different baits [12]. Spectral counts were also utilized in an advanced empirical filtering scheme by Malovannaya et al. [19], and Mascot ion scores as proxy for protein abundance were used in [20]. In a recent work, our group developed an advanced statistical method termed Significance Analysis of INTeractome (SAINT) for spectral count data [9, 21]. The method estimates the data generating distribution of spectral counts under true and false interaction hypotheses, and computes the probability of true interaction. SAINT incorporates the information from negative control purifications in scoring, but in certain cases (multiple baits, low degree of network interconnectivity) can be applied to datasets without controls.
While spectral counting is an efficient mode of quantification, MS1 intensity is a potentially more accurate alternative for label-free quantification. Specifically, intensity data extracted using software tools such as SuperHirn [22], MaxQuant [23], or IDEAL-Q [24] can provide accurate measurements in the low abundance range since every sequenced peptide is observed with intensity. This information is lost in spectral counting, which limits quantification of the low abundance proteins identified by one or several MS/MS spectra only. On the other hand, extraction of reliable MS1 information generally requires high mass accuracy instrumentation and more advanced computational infrastructure. Nevertheless, the availability of high mass accuracy AP-MS datasets is increasing, which necessitates development of advanced scoring methods for continuous data such as intensity-based data. To this end, we present an extension of the computational modeling framework of SAINT to such data, termed SAINT-MS1. The model assumptions were modified to account for continuous data, including appropriate treatment of missing observations. We applied the method to two recently published dataset and evaluated the performance of our interaction scoring method. We also discuss the comparison between the results obtained for the same dataset using spectral count and intensity based data.
MATERIALS AND METHODS
QUBIC dataset
We first considered a small published dataset containing several human bait proteins, termed QUBIC dataset [25]. QUBIC is a protocol for MS-based analysis of protein interactions based on creating bait proteins using bacterial artificial chromosome recombineering technology, which has an advantage of avoiding over-expression of bait protein to preserve native conditions. In this work we took the data for bait protein CDC23, a member of anaphase-promoting complex (APC). The dataset contains 3 purifications of the bait and additional 3 negative control purifications, analyzed using an LTQ-Orbitrap mass spectrometer (Thermo Electron). Raw MS data were downloaded from Tranche data repository and converted to mzXML format. Acquired MS/MS spectra were searched using X! Tandem/k-score database search tool [26] against RefSeq v. 40 human protein sequence database appended with an equal number of decoy sequences. The search was done allowing tryptic peptides only and maximum 2 missed cleavage sites, and with cysteine carbamylation specified as fixed modification. Monoisotopic fragment ion mass tolerance was set to 0.5 Da, and precursor ion mass tolerance to 50 ppm. The search results were further processed using PeptideProphet [27] and ProteinProphet [28], with the final protein lists filtered using protein probability of 0.9 (decoy-based estimated false discovery rate of less than 1%). Label-free protein quantification software IDEAL-Q was applied for peak detection, deisotoping, peak integration and multiple LC-MS alignment [24]. Peak areas were calculated based on the signal intensity of each peak derived from extracted ion chromatograms. LC-MS data corresponding to the 3 biological replicates of the same condition, i.e. CDC23 bait purification or control HeLa cell line purifications, were processed separately. The average intensity of three most intense peptide ions per protein [29] in each biological replicate was calculated as a measure of protein abundance. Only peptides identified with PeptideProphet probability of 0.95 or higher in at least one of the biological replicates were used for protein quantification. Note that the spectral count-based quantitative protein abundance measures for this dataset were already used in our previous analysis [21].
Drosophila dataset
We next considered a dataset from Drosophila Kc167 cells inducibly expressing 16 hemaglutinin (HA)-tagged core components of the Insulin receptor/Target of rapamycin (InR/TOR) signaling pathway [30]. Kc167 cells were serum starved in 2% FBS overnight and bait expression was induced using 600 μM CuSO4 for at least 16h. Cells were either treated with 100 nM insulin for 20 min or left untreated. Affinity purifications of treated and untreated cells were performed in two independent biological purification experiments. In parallel with the test purifications, 24 control purifications (GFP expressing Kc167 cell line) were used to generate a pattern of common contaminant proteins. Proteins were identified using a LTQ-FT-ICR mass spectrometer (Thermo Electron). Acquired MS/MS spectra were searched against the Drosophila Flybase database version 5.7 using the SORCERER-SEQUEST (TM) search algorithm, allowing tryptic peptides only and up to two missed cleavages. For additional details, including peptide and protein identification filtering and spectral count matrix generation, see [30]. For label-free quantification the raw data was converted to profile mzXML format. The software SuperHirn [22] was applied for peak detection, deisotoping, peak integration and multiple LC-MS alignment. In order to consider high quality MS1 information, SuperHirn requires a minimum of three isotopic peaks for data extraction. Singly charged ions were discarded from the analysis. Peak areas were calculated based on the signal intensity of each peak derived from extracted ion chromatograms. LC-MS data derived from individual bait was used for multiple LC-MS alignment, resulting in 16 LC-MS maps that were used to compare the data. Batches of four control runs were generated to provide background LC-MS maps. In order to compare signal intensities the average intensity of the three most intense peptide ions was calculated.
SAINT for MS/MS spectral count data
SAINT was originally developed for scoring interactions based on the spectral count data. It is briefly summarized here to set the stage for subsequent analysis and discussion. Suppose that control purifications are available and they capture most non-specifically binding proteins. The statistical model of SAINT is a mixture model
| (1) |
Here i and j index preys and baits respectively, and Xij corresponds to the spectral count of the interaction between i and j. P(x|λ) denotes Poisson distribution for a count x with mean λ. Specifically, λtrue and λfalse are the mean parameters of Poisson distribution under the true and false interaction hypotheses. πs denotes the proportion of true interactions in the data. The mean parameter λfalse is expressed as
| (2) |
where li is the sequence length of prey i, γ0 is the mean spectral count of all false interactions (in log scale), and μi is the deviation from γ0 for prey protein i. Likewise, the mean parameter λtrue is expressed as
| (3) |
where β0 is the mean (log) spectral count of true interactions in the entire data, (αj, αi) are the mean spectral counts of true interactions in bait j and prey i respectively. Here the model has the assumption that, if two proteins are true interactors, then the mean spectral count for their interaction has a multiplicative effect combining bait and prey-specific abundance levels.
For each interaction pair (i, j), the mixture model in Equation 1 can be used to calculate the probability of true interaction (by Bayes rule), i.e.
| (4) |
When there are replicate purifications, we take the average of probabilities from replicates as the final score for a given protein pair. Once probabilities are computed for all interaction pairs, interactions can be sorted in a decreasing order of probabilities and the associated false discovery rate can be approximated at a threshold probability by averaging the complement probability (1−P) for the selected interactions.
For the estimation of model parameters, we estimate λfalse solely from the control purification data, similar to the practice of using decoy peptides for estimating the negative distribution in database search score distributions [31]. This leads to a semi-supervised mixture model. Specifically, the model parameters (β0,αj,αi) and (γ0,μi) were estimated from the samples generated from appropriate posterior distributions by Gibbs sampling for Dirichlet process mixture model[32]. As a result, these parameters follow nonparametric posterior distributions, allowing flexible modeling at the whole proteome level.
SAINT for intensity data
For modeling intensity data, we replaced Poisson distribution with a continuous distribution for intensity values. After log-transforming the data, we use Gaussian distribution for the observed intensities and truncated Gaussian distribution for the missing data, which can be written as
| (5) |
Here we set the truncation point t as half the lowest intensity in the corresponding purification, taken in natural log scale. The mean parameter λ again has a linear additive expression as in Equations 2 and 3, and λ and σ2 are assumed to follow nonparametric Dirichlet process mixture prior distributions with Gaussian and inverse Gamma bases respectively. One common approach for computing protein-level quantification (also used in this work, see above) is taking the average of the intensities of the three most intense peptide ions per protein [29]. In this case it is not necessary to normalize protein quantification by protein length. The average peptide intensity is not expected to increase proportionally to the length, hence the normalization factor li can be removed from the linear expression. Length normalization is desirable when protein quantification is computed as the sum of all peptide intensities [33].
Receiver-operating characteristic analysis
To evaluate the performance of the method on the Drosophila dataset, we took orthologous interactions and literature curated interactions as positive sets. We also constructed multiple sets of negative interactions to represent non-specific bindings as follows. We randomly sampled 500 protein pairs from the list of all proteins in the data and considered each as a negative set. To remove the variability due to poor representation of non-specific bindings by a single set, we repeatedly drew negative sets 1,000 times and averaged the results over them. We varied K from 100 to 1000 to ensure that the curve does not depend on the choice of K. At each threshold, the sensitivity was calculated as the proportion of benchmark interactions recovered, and the specificity as the proportion of negative interactions not selected.
Implementation
The source C code for SAINT-MS1 is distributed as a part of SAINT-APMS project at the Sourceforge repository at http://saint-apms.sourceforge.net.
RESULTS
QUBIC dataset
We applied SAINT-MS1 to the QUBIC dataset first. This dataset consists of triplicate purifications for bait protein CDC23 and triplicate control purifications (See Methods). Thus it serves as a good test dataset with high-quality quantification, which is helpful not only for validating SAINT-MS1 scores, but also for comparing the filtering with intensity and spectral count data. Hubner et al [25] performed one-sided t-tests between control and test purifications (using intensities extracted by MaxQuant) and they recovered known components of the anaphase-promoting complex using p-values and fold changes.
We first examined the correlation between intensity and spectral count data. Intensity values with no MS/MS identification were removed from the data for the consistency of comparison (See Methods). Figure 1a clearly shows that the two data are linearly correlated in the natural log scale, indicating a high correlation (Figure 1a; Pearson correlation 0.79). The blue dots in the bottom of the plot correspond to the interactions for which spectral count was present but intensity was absent. It is worth noting that the variability of intensity values is greater for the proteins with fewer MS/MS identifications (smaller spectral counts), although the trend is mild. However, we remark that there are insufficient data to generalize this trend because these data come from replicate purifications of single bait only.
Figure 1.
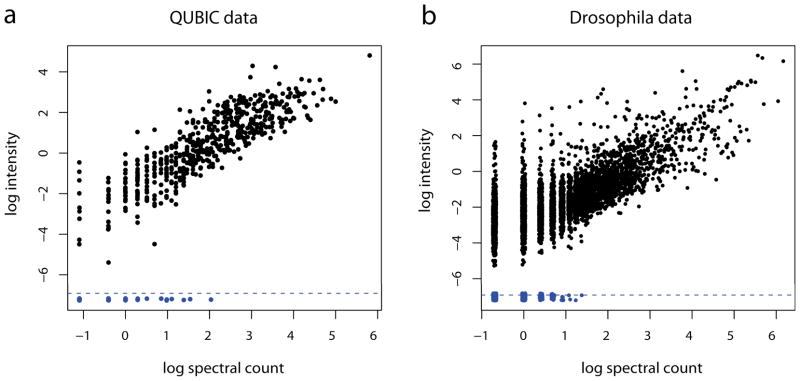
Intensity plotted against spectral count in the QUBIC and Drosophila-Insulin datasets. Peptides with intensity but missing MS/MS identification were removed. Dots under the dashed lines indicate observations with spectral counts but missing intensity values. All axes were drawn in the natural log scale.
We filtered the data at the SAINT probability threshold 0.9 in the intensity and spectral count data. Not surprisingly, results were nearly identical between the two quantification modes and also concordant with the results reported in Hubner et al (Supplementary Tables 1 and 2), with the sole exception of single peptide hit C11orf51 which was not considered for quantification in the SAINT analysis. All members of APC and its adaptors, as well as previously uncharacterized interactors including NEK2 and ANAPC16, were identified with high probability scores as was reported in the original report. This analysis confirms that the high correlation in intensities and spectral counts directly results in similar probability scoring by SAINT-MS1 and SAINT.
Drosophila dataset
Next we applied the method to the Drosophila dataset, which is larger in size and also has both intensity and spectral count data. The missing data distribution was specified using the same parameter values from QUBIC dataset after confirming that a few alternative specifications led to almost identical results (data not shown).
While the intensity and spectral count data were highly correlated (Figure 1b; Pearson correlation 0.75) as in the QUBIC dataset, there is difference between the two modes of quantification. The intensity values for the proteins identified by few spectra varied more widely than those for the proteins identified by a good number of spectra. This phenomenon probably has to do with the fact that this dataset was generated from an LTQ-FT-ICR instrument, which offers a relatively lower data quality for extracting peak intensities than the latest instruments such as LTQ-Orbitrap.
Next, we selected interactions by controlling the false discovery rate below 1%, where SAINT-MS1 reported 307 interactions. The SAINT based on the spectral count data reported 208 interactions at the same FDR threshold, among which 150 overlapped. In the interactions unique to the intensity data, some interactions were between the sixteen bait proteins with a high rate of replicated evidence, indicating that not all additional interactions are likely random hits. However, many additional interactions were detected from the preys found in single bait only, which potentially indicates reduced specificity, a cost for detecting more interactions than the spectral count data.
To formally test this, we performed a receiver-operating characteristic (ROC) analysis (see Methods) using two benchmark sets, which contain the interactions between orthologous proteins and the interactions reported in BioGRID database [34], see Figure 2. When benchmarked against the orthology and literature-based interactions, the scoring result based on the intensity improves the sensitivity compared to the result based on the spectral count data, but the improvement comes at the price of a reduced specificity in the low error regions.
Figure 2.

The ROC curves for Drosophila-Insulin dataset comparing SAINT-MS1 (intensity) and SAINT (spectral count). The selected interactions were benchmarked against (a) orthologous interaction partners and (b) interactions previously catalogued in the literature (BioGRID database).
The distinct ROC curves in the two quantification modes bear an important implication for reconstructing the target network. If false positives admitted by the intensity data are enriched in the interactions with the core members of a protein complex, then the resulting network shall be topologically different between the two quantification modes. On the other hand, one may be concerned about the possibility of not capturing important network components due to the lagging sensitivity of spectral count data. When we examined the networks in this dataset, we found that the structure of interconnected baits remained relatively unchanged between the intensity and spectral count data, but the interactions of prey proteins uniquely present in insulin treated and untreated samples showed significant differences (data not shown). However, this is expected because the interactions between baits are normally observed in sufficiently high abundance levels.
DISCUSSION
While this work was mainly intended to introduce the extended scoring method for SAINT, it encourages the discussion of MS intensity data regarding protein-level rollup of intensity data and handling of missing data, especially when the sample size per model parameter is extremely limited, a typical situation for AP-MS data analysis. As it was shown implicitly in the intensity data analysis, modeling intensity data is statistically more challenging than spectral count data because the variance parameter is critical in the former. This is mainly because estimating the variance parameter for continuous distributions requires more data than are available in typical datasets. Note that Poisson or other discrete distributions approximately learn the variance parameter from the mean parameter because the stochastic variability in counting process, particularly the mean-variance relationship, is often stable and holds well in real datasets. For continuous data, summarizing repeated measurements into a single representative value results in the loss of information for the variability of measurement error. Nonetheless, protein-level MS intensity values are rolled up to either the sum of intensities from all peptides or the average of top three intensities in most published studies.
One can improve this situation by modeling the intensities from all available peptides in the statistical model, instead of rolling them up to a single value for each protein. This has the advantage that peptide intensities can be hierarchically modeled with a protein-level parameter, treating peptide intensities as repeated measurements for the given protein. It is straightforward to see that this approach yields better estimation of the measurement error distribution. Suppose that the measurement variability is σ2 for each peptide in a single LC-MS experiment. Then for a protein with k identified peptides, the average intensity from all k peaks has the variance σ2/k, and the top three peptide summary approach has the variance σ2/3, even after we ignore the bias toward higher peptide intensity. If a protein is identified with a single peptide, however, the protein level intensity has the variance of σ2, which is greater than the other proteins identified by more peptides. Hence peptide level intensity data distinguish proteins with a varying number of peptides, indirectly incorporating MS/MS information. Thus, advanced models that explicitly incorporate peptide-level abundance and variability information (or even intensities of selected peptide fragment ions in targeted proteomics strategies [35]) should be considered for future work. This, however, will require not only development of a new statistical model, but also substantial modifications to common informatics platforms for processing AP-MS data – a drawback compared to the relative simplicity of working with spectral count data. Finally, while SAINT was developed for the analysis of label-free AP-MS data, in the future it could be extended to AP-MS experiments coupled with stable isotope labeling [16–18] to improve upon simpler statistical modeling approaches described for these data [36].
CONCLUSIONS
In this work, we presented SAINT-MS1, a statistical method with software for filtering AP-MS datasets based on intensity-based label-free protein quantification data. Using two recently published datasets generated on LTQ-Orbitrap and LTQ-FT instruments, we demonstrated that the new scoring method based on intensity data is capable of capturing more bona fide interactions in the low abundance range than the scoring based on spectral count data. At the same time, the gain in sensitivity when using the intensity-based data may come at a loss of specificity when the quantification method for extracting intensity data may not perform the best. Still, given rapid advances in MS instrumentation and continuing development of bioinformatics tools for extracting intensity-based information from MS data, we expect that SAINT-MS1 will become a useful addition to AP-MS data analysis pipelines.
Supplementary Material
Acknowledgments
This research was supported in part by NUS YLLSOM grant (to HC) and NIH grant R01-GM-094231 (to AIN). We would like to thank Anne-Claude Gingras for many helpful discussions, and Damian Fermin and Chih-Chiang Tsou for technical assistance with data analysis.
Footnotes
Supporting Information Available: This material is available free of charge via the Internet at http://pubs.acs.org
References
- 1.Chen GI, Gingras AC. Affinity-purification mass spectrometry (AP-MS) of serine/threonine phosphatases. Methods. 2007;42:298–305. doi: 10.1016/j.ymeth.2007.02.018. [DOI] [PubMed] [Google Scholar]
- 2.Yu H, Braun P, Yildirim MA, Lemmens I, et al. High-quality binary protein interaction map of the yeast interactome network. Science. 2008;322:104–110. doi: 10.1126/science.1158684. [DOI] [PMC free article] [PubMed] [Google Scholar]
- 3.Collins MO, Choudhary JS. Mapping multiprotein complexes by affinity purification and mass spectrometry. Current Opinion in Biotechnology. 2008;19:324–330. doi: 10.1016/j.copbio.2008.06.002. [DOI] [PubMed] [Google Scholar]
- 4.Gingras AC, Gstaiger M, Raught B, Aebersold R. Analysis of protein complexes using mass spectrometry. Nat Rev Mol Cell Biol. 2007;8:645–654. doi: 10.1038/nrm2208. [DOI] [PubMed] [Google Scholar]
- 5.Choi H, Kim S, Gingras AC, Nesvizhskii AI. Analysis of protein complexes through model-based biclustering of label-free quantitative AP-MS data. Mol Syst Biol. 2010;6:11. doi: 10.1038/msb.2010.41. [DOI] [PMC free article] [PubMed] [Google Scholar]
- 6.Aebersold R, Mann M. Mass spectrometry-based proteomics. Nature. 2003;422:198–207. doi: 10.1038/nature01511. [DOI] [PubMed] [Google Scholar]
- 7.Ewing RM, Chu P, Elisma F, Li H, et al. Large-scale mapping of human protein-protein interactions by mass spectrometry. Molecular Systems Biology. 2007:3. doi: 10.1038/msb4100134. [DOI] [PMC free article] [PubMed] [Google Scholar]
- 8.Sardiu ME, Cai Y, Jin J, Swanson SK, et al. Probabilistic assembly of human protein interaction networks from label-free quantitative proteomics. Proc Natl Acad Sci U S A. 2008;105:1454–1459. doi: 10.1073/pnas.0706983105. [DOI] [PMC free article] [PubMed] [Google Scholar]
- 9.Breitkreutz A, Choi H, Sharom JR, Boucher L, et al. A global protein kinase and phosphatase interaction network in yeast. Science. 2010;328:1043–1046. doi: 10.1126/science.1176495. [DOI] [PMC free article] [PubMed] [Google Scholar]
- 10.Glatter T, Wepf A, Aebersold R, Gstaiger M. An integrated workflow for charting the human interaction proteome: insights into the PP2A system. Mol Syst Biol. 2009;5:237. doi: 10.1038/msb.2008.75. [DOI] [PMC free article] [PubMed] [Google Scholar]
- 11.Goudreault M, D’Ambrosio LM, Kean MJ, Mullin MJ, et al. A PP2A phosphatase high density interaction network identifies a novel striatin-interacting phosphatase and kinase complex linked to the cerebral cavernous malformation 3 (CCM3) protein. Mol Cell Proteomics. 2009;8:157–171. doi: 10.1074/mcp.M800266-MCP200. [DOI] [PMC free article] [PubMed] [Google Scholar]
- 12.Sowa ME, Bennett EJ, Gygi SP, Harper JW. Defining the human deubiquitinating enzyme interaction landscape. Cell. 2009;138:389–403. doi: 10.1016/j.cell.2009.04.042. [DOI] [PMC free article] [PubMed] [Google Scholar]
- 13.Jeronimo C, Forget D, Bouchard A, Li Q, et al. Systematic analysis of the protein interaction network for the human transcription machinery reveals the identity of the 7SK capping enzyme. Mol Cell. 2007;27:262–274. doi: 10.1016/j.molcel.2007.06.027. [DOI] [PMC free article] [PubMed] [Google Scholar]
- 14.Gavin AC, Bosche M, Krause R, Grandi P, et al. Functional organization of the yeast proteome by systematic analysis of protein complexes. Nature. 2002;415:141–147. doi: 10.1038/415141a. [DOI] [PubMed] [Google Scholar]
- 15.Krogan NJ, Cagney G, Yu H, Zhong G, et al. Global landscape of protein complexes in the yeast Saccharomyces cerevisiae. Nature. 2006;440:637–643. doi: 10.1038/nature04670. [DOI] [PubMed] [Google Scholar]
- 16.Blagoev B, Kratchmarova I, Ong SE, Nielsen M, et al. A proteomics strategy to elucidate functional protein-protein interactions applied to EGF signaling. Nat Biotechnol. 2003;21:315–318. doi: 10.1038/nbt790. [DOI] [PubMed] [Google Scholar]
- 17.Ranish JA, Yi EC, Leslie DM, Purvine SO, et al. The study of macromolecular complexes by quantitative proteomics. Nat Genet. 2003;33:349–355. doi: 10.1038/ng1101. [DOI] [PubMed] [Google Scholar]
- 18.Trinkle-Mulcahy L, Boulon S, Lam YW, Urcia R, et al. Identifying specific protein interaction partners using quantitative mass spectrometry and bead proteomes. J Biol Chem. 2008;183:223–239. doi: 10.1083/jcb.200805092. [DOI] [PMC free article] [PubMed] [Google Scholar]
- 19.Malovannaya A, Lanz RB, Jung SY, Bulynko Y, et al. Analysis of the Human Endogenous Coregulator Complexome. Cell. 2011;145:787–799. doi: 10.1016/j.cell.2011.05.006. [DOI] [PMC free article] [PubMed] [Google Scholar]
- 20.Lavallee-Adam M, Cloutier P, Coulombe B, Blanchette M. Modeling Contaminants in AP-MS/MS Experiments. Journal of Proteome Research. 2011;10:886–895. doi: 10.1021/pr100795z. [DOI] [PMC free article] [PubMed] [Google Scholar]
- 21.Choi H, Larsen B, Lin ZY, Breitkreutz A, et al. SAINT: probabilistic scoring of affinity purification-mass spectrometry data. Nature Methods. 2011;8:70–U100. doi: 10.1038/nmeth.1541. [DOI] [PMC free article] [PubMed] [Google Scholar]
- 22.Mueller LN, Rinner O, Schmidt A, Letarte S, et al. SuperHirn - a novel tool for high resolution LC-MS-based peptide/protein profiling. Proteomics. 2007;7:3470–3480. doi: 10.1002/pmic.200700057. [DOI] [PubMed] [Google Scholar]
- 23.Cox J, Mann M. MaxQuant enables high peptide identification rates, individualized p.p.b.-range mass accuracies and proteome-wide protein quantification. Nature Biotechnology. 2008;26:1367–1372. doi: 10.1038/nbt.1511. [DOI] [PubMed] [Google Scholar]
- 24.Tsou CC, Tsai CF, Tsui YH, Sudhir PR, et al. IDEAL-Q, an Automated Tool for Label-free Quantitation Analysis Using an Efficient Peptide Alignment Approach and Spectral Data Validation. Molecular & Cellular Proteomics. 2010;9:131–144. doi: 10.1074/mcp.M900177-MCP200. [DOI] [PMC free article] [PubMed] [Google Scholar]
- 25.Hubner NC, Bird AW, Cox J, Splettstoesser B, et al. Quantitative proteomics combined with BAC TransgeneOmics reveals in vivo protein interactions. J Cell Biol. 2010;189:739–754. doi: 10.1083/jcb.200911091. [DOI] [PMC free article] [PubMed] [Google Scholar]
- 26.MacLean B, Eng JK, Beavis RC, McIntosh M. General framework for developing and evaluating database scoring algorithms using the TANDEM search engine. Bioinformatics. 2006;22:2830–2832. doi: 10.1093/bioinformatics/btl379. [DOI] [PubMed] [Google Scholar]
- 27.Keller A, Nesvizhskii AI, Kolker E, Aebersold R. Empirical statistical model to estimate the accuracy of peptide identifications made by MS/MS and database search. Anal Chem. 2002;74:5383–5392. doi: 10.1021/ac025747h. [DOI] [PubMed] [Google Scholar]
- 28.Nesvizhskii AI, Keller A, Kolker E, Aebersold R. A statistical model for identifying proteins by tandem mass spectrometry. Analytical Chemistry. 2003;75:4646–4658. doi: 10.1021/ac0341261. [DOI] [PubMed] [Google Scholar]
- 29.Silva JC, Gorenstein MV, Li GZ, Vissers JPC, Geromanos SJ. Absolute Quantification of Proteins by LCMSE: A Virtue of Parallel ms Acquisition. Mol Cell Proteomics. 2006;5:144–156. doi: 10.1074/mcp.M500230-MCP200. [DOI] [PubMed] [Google Scholar]
- 30.Glatter T, Rinner O, Schittenhelm R, Wepf A, et al. Modularity and hormone sensitivity of the Drosophila melanogaster insulin receptor/target of rapamycin (InR/TOR) interaction proteome. Molecular Systems Biology. 2012 doi: 10.1038/msb.2011.79. [DOI] [PMC free article] [PubMed] [Google Scholar]
- 31.Choi H, Ghosh D, Nesvizhskii AI. Statistical validation of peptide identifications in large-scale proteomics using the target-decoy database search strategy and flexible mixture modeling. Journal of Proteome Research. 2008;7:286–292. doi: 10.1021/pr7006818. [DOI] [PubMed] [Google Scholar]
- 32.Ishwaran H, James LF. Gibbs sampling methods for stick-breaking priors. J Am Statist Assoc. 2001;96:161–173. [Google Scholar]
- 33.Schwanhausser B, Busse D, Li N, Dittmar G, et al. Global quantification of mammalian gene expression control. Nature. 2011;473:337–342. doi: 10.1038/nature10098. [DOI] [PubMed] [Google Scholar]
- 34.Stark C, Breitkreutz BJ, Reguly T, Boucher L, et al. BioGRID: a general repository for interaction datasets. Nucleic Acids Res. 2006;34:D535–539. doi: 10.1093/nar/gkj109. [DOI] [PMC free article] [PubMed] [Google Scholar]
- 35.Bisson N, James DA, Ivosev G, Tate SA, et al. Selected reaction monitoring mass spectrometry reveals the dynamics of signaling through the GRB2 adaptor. Nat Biotechnol. 2011;29:653–U138. doi: 10.1038/nbt.1905. [DOI] [PubMed] [Google Scholar]
- 36.Kim B, Nesvizhskii AI, Rani PG, Hahn S, et al. The transcription elongation factor TFIIS is a component of RNA polymerase II preinitiation complexes. Proceedings of the National Academy of Sciences of the United States of America. 2007;104:16068–16073. doi: 10.1073/pnas.0704573104. [DOI] [PMC free article] [PubMed] [Google Scholar]
Associated Data
This section collects any data citations, data availability statements, or supplementary materials included in this article.