Abstract
A passive, planar micromixer design based on logarithmic spirals is presented. The device was fabricated using polydimethylsiloxane soft photolithography techniques, and mixing performance was characterized via numerical simulation and fluorescent microscopy. Mixing efficiency initially declined as Reynolds number increased, and this trend continued until a Reynolds number of 15 where a minimum was reached at 53%. Mixing efficiency then began to increase reaching a maximum mixing efficiency of 86% at Re = 67. Three-dimensional simulations of fluid mixing in this design were compared to other planar geometries such as the Archimedes spiral and Meandering-S mixers. The implementation of logarithmic curvature offers several unique advantages that enhance mixing, namely a variable cross-sectional area and a logarithmically varying radius of curvature that creates 3-D Dean vortices. These flow phenomena were observed in simulations with multilayered fluid folding and validated with confocal microscopy. This design provides improved mixing performance over a broader range of Reynolds numbers than other reported planar mixers, all while avoiding external force fields, more complicated fabrication processes, and the introduction of flow obstructions or cavities that may unintentionally affect sensitive or particulate-containing samples. Due to the planar design requiring only single-step lithographic features, this compact geometry could be easily implemented into existing micro-total analysis systems requiring effective rapid mixing.
1. Introduction
The microfluidic based manipulation of fluids and particles on a sub-millimeter scale continues to emerge as a unique yet interdisciplinary field. Scientists from a variety of disciplines find microfluidics attractive for a wide range of benefits, including small requisite sample volumes and fast analysis times. At their inception, it was thought that microdevices would serve to miniaturize their macro-scale counterparts and scaled-down micropumps, microvalves, and micromixers have been demonstrated [1]. Microfluidics researchers envisioned that these devices could be linked together to miniaturize and automate macroscale assays on a chip scale, inspiring names such as Lab-on-a-Chip (LoC) and micro-total-analysis-system (μTAS) [1, 2]. Broadly these types of devices are often referred to as Bio-MEMS (biological micro-electro-mechanical systems).
Despite the advances made in recent years, mixing on the micro-scale remains a challenge. In typical microchannel flows, the lack of turbulence, evidenced by very low Reynolds numbers (1), constrains mixing to the natural time scale of diffusion. Peclet numbers, defined as the ratio of convective to diffusive transport, are typically very large in microfluidic applications, where transport is dominated by convection. Consequently, mixing does not readily occur in micro-scale flows. As a result, a dedicated active or passive micromixing element is an integral part of most μTAS and Bio-MEMS devices [3, 4].
| (1) |
In (1), ρ is the fluid density, U is the fluid velocity, a is the characteristic channel dimension, and μ is the fluid viscosity.
Several active micromixers, which involve the use of an external field or force to increase convective motion in fluids [5], have been reported and can be highly effective over short times scales using techniques such as: electrokinetic flow, electromagnetic disruption, a thermal bubble micropump, and ultrasonic disruption [6, 7, 8, 9, 10]. However, these mixers are typically more difficult to fabricate and operate due to costly fabrication techniques and supporting external equipment. As a result, these mixers are typically limited to laboratory implementation and rarely extend to wide spread application in μTAS devices.
Passive micromixers do not require external inputs and instead utilize various geometrical features to achieve mixing. In lamination mixers, the channel splits and later recombines the flow [4, 11, 12]; other passive micromixing studies have addressed how fluid folding in diverging channels impacts mixing [3]; some mixers introduce obstacles or cavities in the channel which discretely change the cross-sectional area and create recirculations at higher Re that drive mixing [13, 4, 14, 15]. Similar to lamination, hydrodynamic focusing designs utilize sheath streams to confine a concentrated sample stream to a smaller width whereby mixing can occur more rapidly over smaller diffusion distances [16, 17]. Curved microchannels can induce mixing by the generation of secondary flows and interfacial stretching [18, 11, 19, 14] that can be quantified by the Dean number
| (2) |
In (2), Re is the Reynolds number, a is the characteristic channel length, and Rc is the radius of curvature.
Recent reviews highlight the need for accurate quantification of micromixer performance and describe several appropriate experimental techniques [20, 21]. Options for reporting mixing performance are more plentiful for computational work, where velocity and species concentration data are available throughout an entire computational domain. More recent computational works have invoked tracer particle tracking with entropic characterization[22, 23]. This method is particularly suited to higher Peclet number flows, as tracer particles follow fluid streamlines and are devoid of any species diffusion. Experimentally, microscopy is the most common technique to analyze mixing. Methods utilizing standard fluorescent microscopy and dyes measure the summed fluorescent intensity in a vertical column at each pixel in the image, rendering the three-dimensional data space to a two-dimensional image. Typically, a transverse linescan is used to generate a plot along a line orthogonal to the flow at the mixer inlets and outlets. This method potentially overestimates mixing performance when the flow profile is distorted in such a way that horizontal striations of non-mixed solute layer on top of one another and appear mixed. To quantitatively evaluate the performance of micromixers, we will use the mixing performance expression given by [24] due to its ease of applicability to both numerical and experimental data:
| (3) |
In (3), Cmix is the concentration of a perfectly mixed solution, and are the depth-averaged concentrations along the inlet and outlet in the transverse (y) direction. This expression is appropriate for experimental images where pixel spacing is uniform, or numerical studies where grid spacing may be non-uniform.
In this study, we present and characterize a passive micromixer named Sequential Logarithmic Mixing Apparatus (SeLMA). A prominent element of the mixer design is the use of logarithmic curvature throughout the channel length (figure 1). The utilization of logarithmic curvature has several key advantages: the variable cross-sectional area increases the interfacial stretching and fluid folding, the curvature creates secondary Dean flows, and the reversal of the curvature reverses the direction of the secondary flow, thus increasing the convective mixing. We found that logarithmic curvature offers high mixing performance while avoiding external force fields or channel obstructions that could potentially disrupt biological macro-molecules or live cells used in Bio-MEMS applications. Finally, the planar design can be produced by facile single layer lithography fabrication methods.
Figure 1.
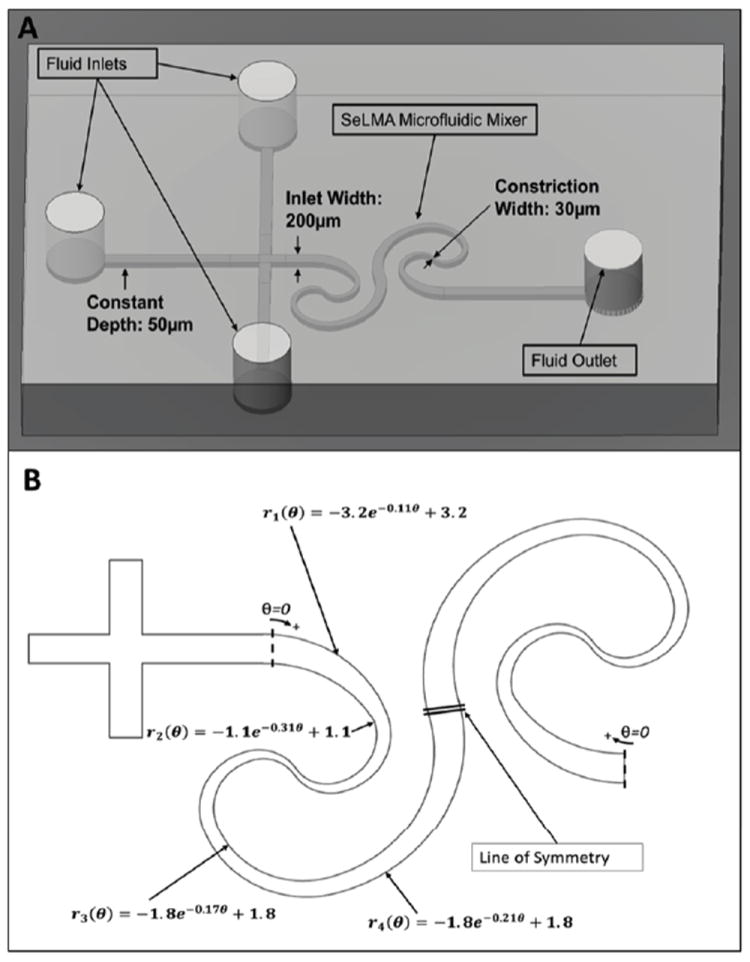
(A) Diagram of the SeLMA device schematic showing planar geometry with logarithmic curves to increase mixing by inducing Dean secondary flow vortices. (B) 2-D schematic of SeLMA showing curve geometry. Fitted polar formulas, such as (4), are given in the units of mm.
2. Design
2.1. Device Parameters
The SeLMA micromixer has three 200 μm wide inlets with two sheath streams that are perpendicular to a central sample stream and a constant channel depth of 50 μm throughout. The spiral curves of the channel walls (beginning 800 μm after the junction of the inlets) were inspired from the characteristic polar formula of a logarithmic spiral:
| (4) |
There are a variety of curve shapes that can be derived from (4). For instance, setting a = 0 will provide a constant radius of curvature at a fixed C. Setting a = θ, b = 0, and C equal to a constant will provide a linearly changing radius of curvature. For non-zero a, b, and C, the curve takes the shape of a logarithmic spiral. Since the mixer contains spirals in series, the coefficients used were modified as necessary to ensure continuity of channel width at the junctions of the curves.
Two pairs of curves, as seen in figure 1b, are joined at the constriction point. The first pair of curves are developed from π/2 < θ < 3π/2, and then rotated 180° counterclockwise where the terminal end of the spirals interface with the straight channel (800 μm after the junction of the inlets). At the origin of these two curves, another pair of spirals are built from π/2 < θ < 2π. The curves are copied, mirrored, and joined by splines at the point of matching cross-sectional area to create the second half of the SeLMA system. This creates a continuously curved channel, with a dynamic radius of curvature as well as a dynamic cross-sectional area. The projected horizontal area on which the mixing channel is developed is approximately 3 mm by 5 mm with a center channel streamline length of 12 mm.
2.2. Mixing Mechanisms
SeLMA incorporates three specific mechanisms to augment mixing performance. While the logarithmic change in the radius of curvature provides a continuously changing crosssectional area to the mixer, it is also responsible for the formation of Dean vortices (present in all curved channels). Additionally, the three perpendicular inlets provide hydrodynamic focusing. It is hypothesized that: (1) the variable channel width will create fluid stretching; (2) as dean number increases, counter-rotating vortices are expected to increase the mixing performance; (3) the hydrodynamic focusing coupled with the Dean vortices will allow this convective transport to occur in two opposite directions.
A model of the Dean number as a function of position throughout a quarter of SeLMA (after the first constriction point), as well as through a control channel of equivalent maximum radius of curvature and cross-sectional area, illustrates the exploitation of logarithmic curvature (figure 2). After converting polar equations (4) to parametric equations x(t) and y(t), the radius of curvature can be calculated by,
| (5) |
where all derivatives are calculated with respect to the parameter t. Using this as well as the calculated channel width as a function of position, the two examples were modeled at Reynolds numbers of 5 and 10.
Figure 2.
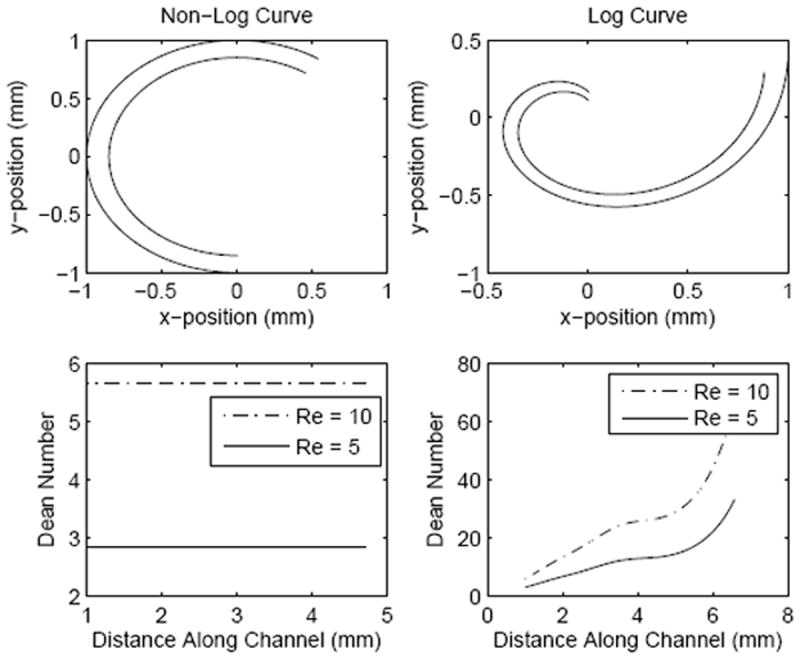
Comparison of Dean numbers within microchannels that are logarithmically curved or of constant curvature, shown as a function of position along the channel.
In the control channel of constant radius and constant cross-sectional area, the Dean number remained constant along the length of the channel at a given Reynolds number. Comparatively, the Dean number increased in SeLMA (bottom right in figure 2) reaching its maximum at the constriction point. The log-curved channel did not have a constant cross-sectional area or a constant radius of curvature; both must be evaluated locally using the distance formula and (5). As expected, where the local width decreased, the Reynolds number increased, as well as the Dean number. Furthermore, increasing the Reynolds number in the channel increased the Dean number proportionally. This comparison illustrates the impact of curved geometries and decreasing cross-section on Dean number which is ten-fold greater than the most similar control geometry.
3. Methods
3.1. Numerical Simulations
The computational fluid dynamics package, Ansys FLUENT, was used to solve for the flow field in SeLMA and other micromixers. The structures were drawn in AutoCAD 2010 (Autodesk, Inc., San Rafael, CA), meshed in ICEM v12.1 (Ansys, Inc., Canonsburg, PA), and solved in FLUENT v12.1 (Ansys, Inc., Canonsburg, PA). Using the finite volume method, the steady state continuity equation, momentum balance, and species continuity equation (6-8) were solved numerically.
| (6) |
| (7) |
| (8) |
Due to the often negligible effects of inertia in microdevices, the left-hand side of (7) is occasionally neglected, resulting in the Stokes equation [25]. In addition, many microdevices are modeled in two-dimensions with acceptable accuracy. However, given that the expected Dean flow is an inherently three-dimensional inertial phenomenon, the full three-dimensional equations were solved. The entire mixer was simulated, with the inlets truncated after 400 μm - this is beyond sufficient to allow for the flow to become fully-developed, while not adding unnecessary computational requirements.
The properties of water at room temperature were used for density and viscosity (ρ = 103 kg/m3, μ = 10−3 Pa·s), while the diffusion coefficient was set to DAB = 0.64 ×10⁻⁹ m2/s corresponding to the diffusivity of fluorescein in water [26]. The normal inlet velocity was varied to evaluate the mixer performance over a range of Reynolds numbers from 1 to 70. The species continuity inlet boundary conditions consisted of a sample stream concentration of 1 mol/m3 and sheath concentrations of 0 mol/m3. The specified outlet boundary conditions were a pressure of 0 Pa with no viscous stress and convective flux for the species transport equation. Since the flow was driven by syringe pumps in all the experiments, constant inlet velocity and no-slip boundary conditions at the walls were used. The resulting velocity, pressure, and concentration profiles were analyzed using post-processing facilities (FLUENT) and MATLAB. The mesh of each geometry was further refined until they were found to be grid independent; for these 3-D simulations, this was achieved with between 1-3 million nodes depending on the geometry.
3.2. Depth-Averaging
To make a meaningful comparison of the mixing performance from both simulation data with the experimental data, depth averaging of the simulated concentration field was performed. In experiments, the measured light intensity is proportional to the average concentration in the line of sight of the probe. The depth of focus of a laboratory microscope depends on the magnification and numerical aperture of the objective lens. For a 10-x objective lens with a numerical aperture of 0.20, the depth of focus is approximately 35 μm; this is on the order of the depth of a typical microchannel. As previously discussed, pixel intensities are additive over the depth of focus of an imaged area. To mimic this in simulation, the concept of depth-averaging was applied, where in a channel of constant depth throughout the mixer, depth-averaged concentrations were computed for comparison with experimental profiles of concentrations in lateral directions.
For three-dimensional simulations, inlets and outlets are represented as two-dimensional planes. The simulations provided discrete data points at computational nodes on these input/output planes. For each position across the width of the outlet, the concentrations are averaged over the depth of the outlet using:
| (9) |
where z represents the direction of the depth. To span the entire height of the microchannels in SeLMA, z1 and z2 were set to 0 μm and 50 μm, respectively. These depth-averaged concentrations were then used in (3) to calculate the depth-averaged mixing efficiency of the mixer at the outlet.
3.3. Device Fabrication
The soft lithography fabrication methods used in the present study have been described elsewhere [27]. Briefly: AutoCAD was used to design chip geometries, and using a MANN 3600 pattern generator (GSA Corp., Marietta, GA) a glass-chromium photomask was generated from the imported CAD file. SU-8 master molds were fabricated using a single step photolithography process. SU-8 2025 (MicroChem Corp., Newton, MA) was utilized to create a mold with positive relief structures on a 4 inch silicon wafer (Universitywafer.com, South Boston, MA). Protocols from MicroChem were adapted for the photolithography process [23]. The SU-8 was spin coated on the Si wafer to achieve a thickness of 50 μm. The wafers were then pre-baked and exposed via a Quintel UL7000- OBS system to 365 nm UV light with an intensity of 8.57 mW/cm2, an effective dose of 500 mJ/cm2. Following exposure and post-exposure baking, the wafers were developed with SU-8 developer (MicroChem Corp., Newton, MA), rinsed with isopropyl alcohol (IPA), and dried in air. This entire process was completed within a class 100 clean room at the Center for Advanced Microstructures and Devices, Louisiana State University.
Final devices were then fabricated from polydimethylsiloxane (PDMS), Sylgard 184 (Dow Corning, Midland, MI), at a ratio of 10:1 polymer to curing agent by weight on the previously fabricated SU-8 master. This was allowed to cure for 8 hr at 33 °C before coring fluidic access ports using a Harris UniCore™, tip diameter of 1.0 mm (Harris, Redding, CA). The devices and plain 1 in. × 3 in., 1 mm thick glass slides (VWR, Radnor, PA) were then plasma oxidized with a Harrick Plasma Cleaner on the high setting, (PDC-32G Harrick Plasma, Ithaca, NY) and bonded by applying pressure and baking again at 60 °C for 30 min. Tygon tubing (0.03” ID) (Cole-Parmer, Vernon Hills, IL) was used to connect the three inlets of the device to a syringe pump (KD Scientific, Holliston, MA) and 5 mL syringes. The outlet emptied into a waste dish.
3.4. Device Validation
Fluorescent microscopy using 46 μM fluorescein sodium salt pumped through the center inlet channel and DI water in the outer channel inlets was used to evaluate mixing. Images were collected using 10-x magnification (Nikon Eclipse TS100 Microscope), with a fluorescent lamp excitation of 492 nm and 520 nm emission, and an exposure time of 500 ms (Lambda BG-4). Image processing and analysis was conducted using Metamorph Imaging software v7.5.6 (Molecular Devices, Inc., Sunnyvale, CA) and 16-bit resolution. A cross-sectional pixel intensity plot was created for the outlet and all three inlets; the data for the inlets was combined into one inlet vector, and mixing efficiencies were calculated using (3). Mixing performance was evaluated at the outlet in increments of Re = 1. A maximum Reynolds number of 70 was selected based on the potential applications of SeLMA in microdevices, and previously used Re values from similar mixers [28].
3.5. Confocal Imaging
Confocal imaging was used to create a 3-D image volume of the cross-sectional area of the channel and secondary flow effects throughout the micromixer. A scanning laser confocal microscope (Leica TCS SP2) with a 10-x objective was used to capture Zstacks at various points along the mixer channel (inlet, curve leading to constriction, constriction, and outlet of the mixer,) at select Reynolds numbers. A total stack height of 30 μm was imaged with 0.5 μm slice thickness. Image J (NIH, Bethesda, MD) software was used to combine the stacks and transect at the desired cross-sectional area of the micromixer, orthogonal to the direction of flow.
4. Results and Discussion
4.1. Simulation
From inspection of (2), it is clear that the Dean number increases as the Reynolds number increases or as the radius of curvature decreases. The logarithmic curvature in SeLMA also provided the mixer with a continuously changing radius of curvature, as well as continuously variable cross-sectional area. As the fluid approached the first constriction point of the mixer, the cross-sectional area and the radius of curvature decreased. As the cross-section decreased, the Reynolds number increased, which proportionally increased the Dean number. The radius of decreasing curvature increased the Dean number proportional to the 1/2 power of the radius of curvature. It was thus expected that the magnitude of Dean vortices would be greatest near the constriction points.
To investigate the presence of Dean flows in SeLMA, plots of the z-velocity were analyzed (figure 3), where positive z is towards the top of the microchannel. On the top (figure 3a), the classic Dean vortices are visible in the x-z plane: following the direction of the flow, there is positive z-velocity in the top right and bottom left of the plane and negative z-velocity in the top left and bottom right of the plane. This illustrates two vortices separated by a plane of symmetry at the vertical mid-plane of the mixer (figure 3a inset). On the bottom (figure 3b) is a plot of z-velocity at a constant height of 40 μm from the bottom of the mixer on a constant z-plane (chosen to avoid the plane of symmetry near the mid-plane). Following the fluid flow in this plane, prior to the constriction point the fluid on the right half of the channel had a negative z-velocity while the fluid on the left half of the channel had a positive z-velocity. At the constriction point, the radius of curvature of the mixer changes directions. After the constriction point, these z-velocities were reversed in direction.
Figure 3.
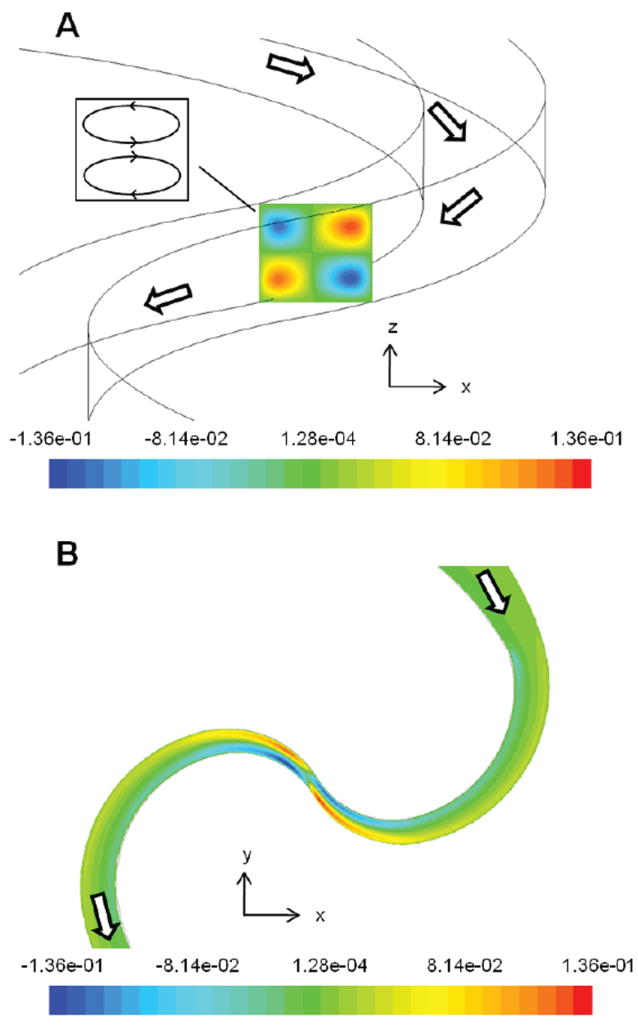
Simulation images of z-velocity at the first constriction of the mixer. A. The direction of flow is from top to bottom. Inset shows that this z-velocity profile is consistent with typical Dean vortices. B. The plane is taken at a constant height of 40 μm from the bottom of the channel.
Other curved channel mixers have been reported that take advantage of the flow phenomena predicted in SeLMA, such as the Archimedes spiral [19] and the Meandering-S mixer [18]. Difficulty arises in comparing micromixer designs due to differences in channel dimensions, Reynolds numbers, and the expressions used to evaluate mixing performance. To make the closest comparisons, these mixers were adapted from the literature and scaled for appropriate comparison to SeLMA. All designs were evaluted with three inlets, 200 μm wide channels, and a pathlength of approximately 12 mm and a channel depth of 50 μm (simulation geometries shown in supplemental material).
The secondary flows present in all curved mixers improved mixing performance after a certain Re threshold (figure 4a). At this transition point, the mixing could be attributed to convection rather than diffusion-based mass transport. A straight t-channel is shown for comparison; without any mechanism to enhance mixing, the mixing performance monotonically decreases as Re increases. The logarithmic curvature in SeLMA outperformed the other mixers over the entire range of Re tested.
Figure 4.
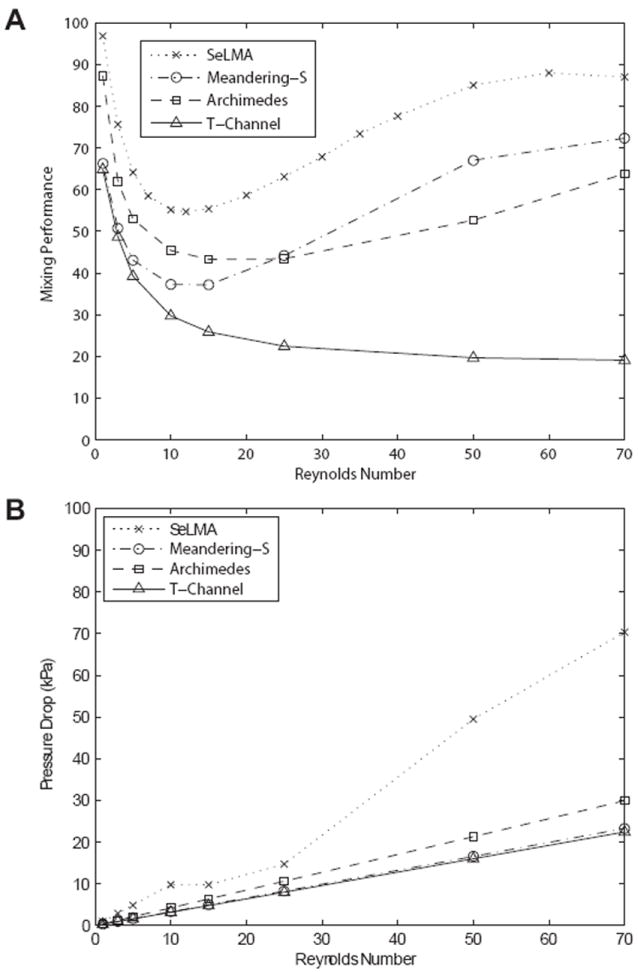
A. Simulation results of mixing performance in SeLMA and other curved-channel micromixers. Mixer designs from previous reports were adapted to have the same number of inlets, similar dimensions, and path lengths as SeLMA. B. Simulated pressure drops for the same mixers.
Pressure drops of the simulated mixers are calculated by integrating the pressure in nodes at the inlets, summing the three inlets to find a total inlet pressure, and subtracting the integrated pressure of nodes at the outlet. These are shown for the tested range of Reynolds numbers in figure 4b. As expected, the pressure drop across SeLMA is consistently higher than that of the other mixers used for comparison. This is a direct result of the constrictions in SeLMA. However, figure 4b shows that SeLMA’s pressure drop is only slightly higher in magnitude than that of the other curved mixers at lower Reynolds numbers. The disparity between pressure drops across SeLMA, the Meandering-S and Archimedes Spiral increases sharply after a Reynolds number of 25. While the higher pressure drop required is a drawback, we were able to operate our device up to Reynolds numbers of 70 with no observed leakage at the fluid inlet and outlet connections. These connections were not sealed in any way beyond tight fitting Tygon into PDMS. For the benchscale applications envisioned for this micromixer, the pressure drop seems manageable given the increase in mixing performance it provides.
The comparison of SeLMA versus mixers adapted from literature was also made on a per unit length basis, shown in table 1. Commonly, micromixers are reported as having complete mixing after a given number of mixing elements in series. To compare these mixers effectively, the ratio of the reported mixing performance to the mixing path length was used to standardize mixing performance per unit length (i.e. percent per mm). We have chosen to highlight the performance at the highest Re from each of the simulated mixers. From the comparison, the SeLMA mixer had a higher mixing performance per unit length and thus requires a shorter path length to mix the same fluid effectively.
Table 1.
Comparison of mixing performance and mixing efficiency per mm mixing path length, at Re = 70, evaluated numerically in SeLMA and a selection of micromixers adapted from literature: the Archimedes spiral [19], the Meandering-S [18], and a T-Channel.
| Micromixer | η (%) |
|
|
|---|---|---|---|
| SeLMA | 87.015 | 6.8911 | |
| Meandering-S | 72.31 | 6.02 | |
| Archimedes | 63.80 | 5.32 | |
| T-Channel | 19.11 | 1.59 |
Samples introduced to micromixers can have widely varying diffusion coefficients which could affect mixing performance. This parameter’s impact on mixing in SeLMA was numerically investigated over four orders of magnitude of diffusivity (figure 5). For very high diffusivities mixing performance is exceptional over the entire range of Re, not dropping below 96%. As diffusivity decreases, the expected behavior is seen; the mixing performance initially decreases, reaches a minimum, and then begins to increase again as the Reynolds number increases. Particularly encouraging is that all four diffusivities tested reach above 80% at the highest Reynolds numbers tested. Figure 5 does show an artifact that was discussed earlier: distortion of the fluid profile can result in unmixed layers of fluid that when depth-averaged, would be perceived as mixed. This is seen at an Re of 60 where solute of Dab of 10−11 m2/s appears to have higher mixing performance than that of 10−10 m2/s. A species with a diffusivity of an order of magnitude lower diffusivity should not result in a higher mixing performance. The fact that this artifact was only observed this instance suggests the depth-averaging is acceptable in this analysis. The results from figure 5 display SeLMA’s versatility with respect to the types of samples that could be mixed.
Figure 5.
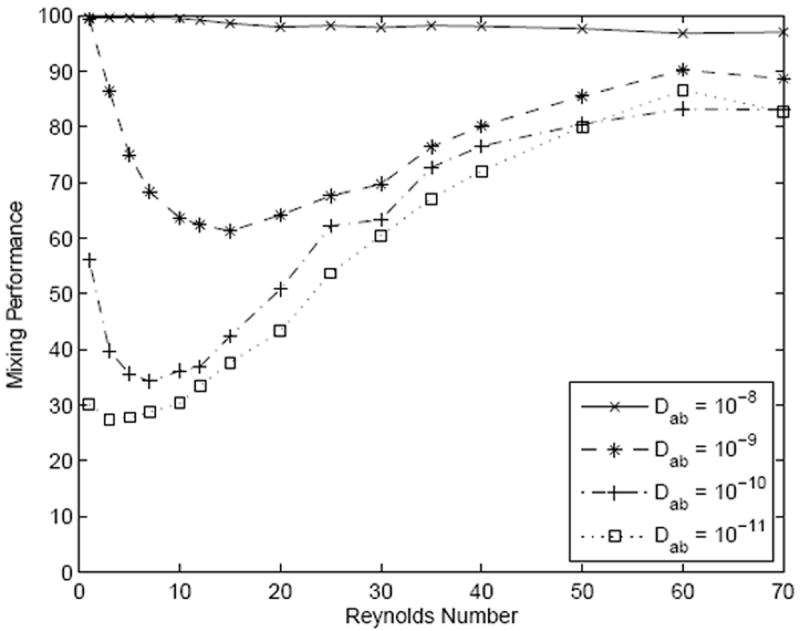
Simulation results over a range of diffusivities.
4.2. Experimental
The SeLMA simulations were validated by device fabrication and observation via fluorescent microscopy (figure 6). Fluorescein, introduced in the center of the hydrodynamically focused streams, was initially contained in the middle of the channel, with limited dispersion (figure 6a). As channel curvature increases, the fluorescein began to distribute, spreading out towards the outside wall of the channel. Near the constriction, a band of higher intensity was observed, presumably due to a rotation of the broadened band due to Dean flow, which then disperses again after the constriction point. Visualization of a concentration contour plot in simulations revealed a similar pattern to that observed experimentally, showing that prior to the increasing curvature and constriction, the fluorescein was constrained to the middle of the channel, whereas afterwards, the flow transitioned to the side walls and dispersed in a helical pattern (figure 6b).
Figure 6.
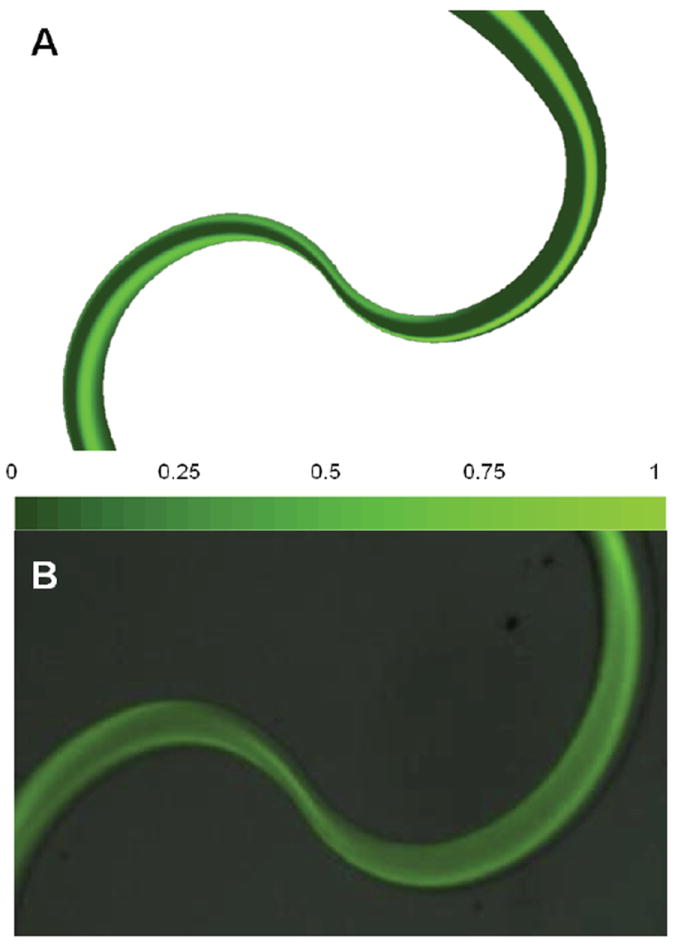
Comparison of the simulation results to experimental results at the first constriction of SeLMA with a Reynolds number of 40. A. Concentration contour plot taken at the mid-plane of the device. B. Fluorescent micrograph of fluorescein mixing in SeLMA device. From inspection of the two images, similar flow characteristics can be seen between the simulated and experimental images. Most notable is the fluid diversion to the channel walls as the channel width decreases.
As noted across mixers that utilize Dean flow, there is a transition between diffusive mixing at low Re to convective components at higher Re. This behavior was compared between simulation and experimental testing in SeLMA (figure 7). There was strong correlation between experimental and simulated mixing performance, which initially decreased as Re increased, with a minima occurring at a Reynolds number of approximately 15. Indicative of a regime change, the mixing efficiency began to increase as the Reynolds number increased beyond this threshold. Above an Re of 15, it is thought that the secondary flows in the mixer become dominant and drive the mixing in the device. In both the simulated and physical experimental device, the transition from one regime to the other occurs at approximately the same Reynolds number. Deviation between simulation results and those acquired experimentally, particularly at higher Re, could be an artifact of the higher velocities on intensity during the relatively long acquisition times employed, or the aforementioned differences between the computational and standard fluorescent microscopy depth-averaging of intensity.
Figure 7.
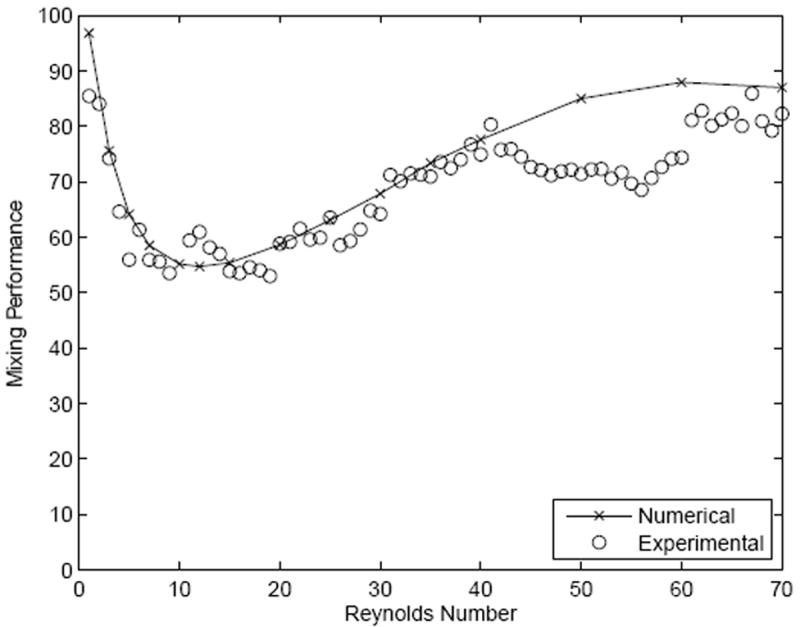
Comparison between simulation and fluorescent microscopy results of mixing performance in SeLMA.
4.3. Confocal Imaging
Confocal imaging of the SeLMA micromixer provided cross-sectional images of the flow profile during mixing with fluorescein and water (figure 8). Initially at the inlet intersections (figure 8a), the cross-section showed confinement of fluorescein to the middle stream. As the curvature increased (figure 8b), the fluorescein began to stratify transverse to the flow, with significant multilayer folding observed at the constriction point (figure 8c). At the outlet of SeLMA (figure 8d), the fluorescein was much more dispersed. Confocal cross-sections were compared at the first constriction of the micromixer at various Re (figure 9). As Re increased, the development of the complex secondary flows increases. From the confocal imaging results, it can be concluded that as Re increases, the degree of secondary flow in the mixer also increases. However, even at low Re, bending of the solute band in the direction of the outer curve could be observed to fold the flow streams horizontally (figure 9a). As Reynolds number increased, this folding becomes more pronounced, with multilayered folding observed at a Reynolds number of 40 (figure 9d). Confocal imaging of the device provided proof of horizontal fluid flow folding and dispersion and true mixing. Because non-confocal fluorescent microscopy averages depth over the height of the microchannel, as noted before, non-mixed horizontal layers of solute could be perceived as being mixed. Here the cross-sectional dispersion pattern of solute at the mixer outlet, shown experimentally through confocal images (figure 8d), provide evidence for mixing.
Figure 8.
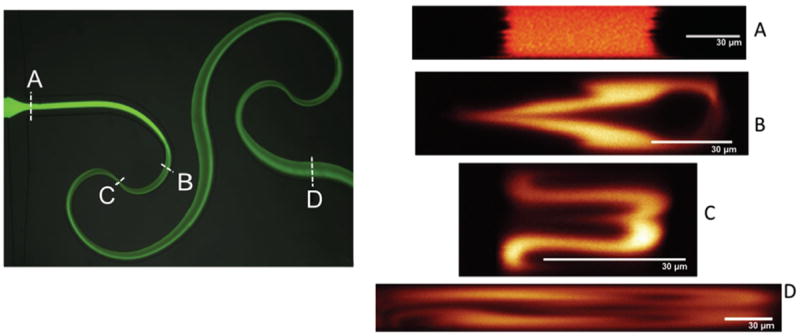
Confocal micrographs of the cross-section of the microchannel at various locations (A-D) throughout the mixer. Re = 40. Z-stacks were reconstucted to observe cross-sectional secondary flows at the various locations. Panel A shows the cross-section before the mixing stucture where no secondary flows are present. As the fluid progressed from B-D, secondary Dean flows developed. Reconstruction of the cross-section from the z-stack was dependent on the depth and width of the channels being imaged. Because SeLMA has a varying width throughout the mixer, images A-D each have different aspect ratios depending on the width of the channel at the imaged location.
Figure 9.
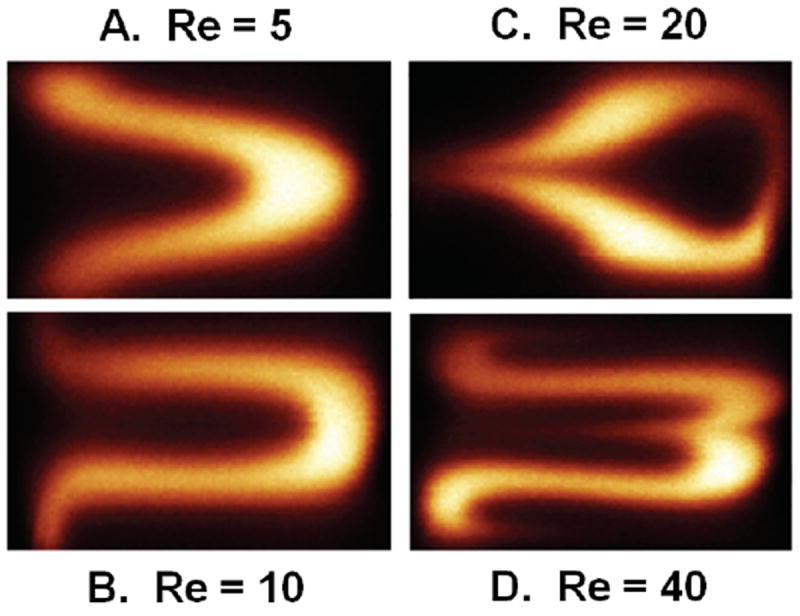
Confocal micrographs of the cross-section at the first constriction point in SeLMA at various Reynolds numbers. Counterclockwise from top left, Re = 5, 10, 20, and 40.
5. Conclusions
Microdevices lacking a mixer rely solely on molecular diffusion, and as such mixing requires channels that can be impractically long. Mixing performance in such devices monotonically decreases as Reynolds number increases, limiting high-throughput processes that require well-mixed solutions. Herein we present a planar passive mixer based on logarithmic spiral geometry. The logarithmic curves can be sequentially arranged to additively increase mixing, thus the design is termed a Sequential Logarithmic Mixing Apparatus, or SeLMA. Being planar allows “one-step” fabrication using traditional photolithography techniques. The logarithmic spirals provided a continuously changing cross-sectional area as well as a continuously changing radius of curvature. The combination of these caused advection that dispersed the sheath and sample fluid amongst one another. This dispersion was larger at higher Reynolds numbers, which yielded higher mixing performance. A transition is clearly seen at a Reynolds number of 15 where the diffusion based trend gives way to increased mixing at higher Re, and a more inertial regime. Initially mixing efficiency decreased to the previously stated minima of 53%, but began to steadily increase to a maximum of 86% at Re = 67.
Based on the presented results, the SeLMA micromixer has been shown to be an improvement over existing passive planar micromixer designs. The mixing performance of SeLMA was compared to scaled models of the Archimedes, Meandering-S, and a simple T-channel. As noted, the three alternative mixers were scaled appropriately for comparisons. A minima was observed in all the mixers as Reynolds number increased from 1-12, and performance begins to increase for all curved channel mixers past the minima. In comparison, SeLMA displayed improved performance throughout the entire sweep of Reynolds numbers simulated. In particular, SeLMA showed a 10-15% higher efficiency than both the Archimedes and Meandering-S mixer designs at all Reynolds numbers greater than 15. Direct comparison of the mixing performance of SeLMA to previously reported mixing performance is problematic due to differences in experimental designs and protocols. In terms of mixing per unit length, SeLMA proved to most efficiently utilize its pathlength for mixing. SeLMA has a larger pressure drop than comparable mixers, but this pressure drop is manageable given the increase in mixing performance it provides. The geometric features responsible for mixing in SeLMA do not require flow obstructions or cavities as do herringbone-type designs which may affect fragile or particulate-containing samples[29].
Overall, the Dean vortices in SeLMA were shown to exist in simulation, and qualitatively demonstrated via confocal fluorescent microscopy. These secondary flows along with the viscous folding and interfacial stretching, caused by the variable cross-sectional area, drive the mixing performance at higher Re. This high level of mixing was observed in numerical experiments over four orders of magnitude of species diffusivity. In future work, we plan to investigate the contributions of the individual coefficients in (4) and their relation to the mixing mechanisms (hydrodynamic focusing, variable cross-sectional area, and curvature), and evaluate how this impacts the overall performance of SeLMA. This deconstruction will provide insight on a mechanisms’ utitity at a particular Reynolds number for future micromixer design. SeLMA lacks obstructions, cavities, or sharp corners that could potentially hold up or damage sensitive biological samples. With the performance stated, and without the need for external drivers and equipment, the SeLMA mixer presented could be implemented into existing μTAS to achieve rapid mixing in a small chip footprint.
Supplementary Material
Acknowledgments
We thank the Louisiana State University Center for Advanced Microstructures and Devices (CAMD) for use of fabrication facilities, Edward Song for expertise in initial microfabrication efforts, and Matt Brown in the LSU Socolofsky Microscopy Core for confocal imaging assistance. This work was supported in part by funding from the NIH National Center for Research Resources (ARRA supplement to R24-RR023998-02), NSF DUE-0814347, the NSF-IGERT Multi-Scale Computational Fluid Dynamics program at LSU, and the LSU College of Agriculture undergraduate research grants. This manuscript was approved for publication by the director of the Louisiana Agricultural Experiment Station as number 2011-244-6476.
References
- 1.Ho Chih-Ming, Tai Yu-Chong. Micro-electro-mechanical systems (mems) and fluid flows. Annual Review of Fluid Mechanics. 1998;30:579–612. [Google Scholar]
- 2.Stone HA, Stroock AD, Ajdari A. Engineering flows in small devices. Annual Review of Fluid Mechanics. 2004;36(1):381–411. [Google Scholar]
- 3.Chung Changkwon, Choi Duwon, Kim Ju Min, Ahn Kyung Hyun, Lee Seung Jong. Numerical and experimental studies on the viscous folding in diverging microchannels. Microfluidics and Nanofluidics. 2009;8(6):767–776. [Google Scholar]
- 4.Nguyen Nam-Trung, Wu Zhigang. Micromixers: A review. Journal of Micromechanics and Microengineering. 2005;15(2):R1–R16. [Google Scholar]
- 5.Hessel V, Lowe H, Schonfeld F. Micromixers: a review on passive and active mixing principles. Chemical Engineering Science. 2005;60(8-9):2479–2501. [Google Scholar]
- 6.Tsai Jr-Hung, Lin Liwei. Active microfluidic mixer and gas bubble filter driven by thermal bubble micropump. Sensors and Actuators A: Physical. 2002;97-98:665–671. [Google Scholar]
- 7.Wen Chih-Yung, Yeh Cheng-Peng, Tsai Chien-Hsiung, Fu Lung-Ming. Rapid magnetic microfluidic mixer utilizing ac electromagnetic field. Electrophoresis. 2009;30:4179–4186. doi: 10.1002/elps.200900400. [DOI] [PubMed] [Google Scholar]
- 8.Wu Hsin-Yu, Liu Cheng-Hsien. A novel electrokinetic micromixer. Sensors and Actuators A: Physical. 2005;118(1):107–115. [Google Scholar]
- 9.Yang Zhen, Goto Hiroshi, Matsumoto Mikio, Maeda Ryutaro. Active micromixer for microfluidic systems using lead-zirconate-titanate(pzt)-generated ultrasonic vibration. Electrophoresis. 2000;21:116–119. doi: 10.1002/(SICI)1522-2683(20000101)21:1<116::AID-ELPS116>3.0.CO;2-Y. [DOI] [PubMed] [Google Scholar]
- 10.Yang Zhen, Matsumoto Sohei, Goto Hiroshi, Matsumoto Mikio, Maeda Ryutaro. Ultrasonic micromixer for microfluidic systems. Sensors and Actuators A: Physical. 2001;93:266–272. [Google Scholar]
- 11.Sudarsan AP. Multivortex micromixing. Proceedings of the National Academy of Sciences. 2006;103(19):7228–7233. doi: 10.1073/pnas.0507976103. [DOI] [PMC free article] [PubMed] [Google Scholar]
- 12.Tofteberg Terje, Skolimowski Maciej, Andreassen Erik, Geschke Oliver. A novel passive micromixer: lamination in a planar channel system. Microfluidics and Nanofluidics. 2010;8:209–215. [Google Scholar]
- 13.Hong Chien-Chong, Choi Jin-Woo, Chong H Ahn. A novel in-plane passive microfluidic mixer with modified tesla structures. Lab on a Chip. 2004;4(2):109. doi: 10.1039/b305892a. [DOI] [PubMed] [Google Scholar]
- 14.Tsai Rei-Tang, Wu Chih-Yang. An efficient micromixer based on multidirectional vortices due to baffles and channel curvature. Biomicrofluidics. 2011;5(1):014103. doi: 10.1063/1.3552992. [DOI] [PMC free article] [PubMed] [Google Scholar]
- 15.Stroock AD. Chaotic mixer for microchannels. Science. 2002;295(5555):647–651. doi: 10.1126/science.1066238. [DOI] [PubMed] [Google Scholar]
- 16.Gambin Yann, Simonnet Claire, VanDelinder Virginia, Deniz Ashok, Groisman Alex. Ultrafast microfluidic mixer with three-dimensional flow focusing for studies of biochemical kinetics. Lab on a Chip. 2010;10(5):598. doi: 10.1039/b914174j. [DOI] [PubMed] [Google Scholar]
- 17.Wang Fen, Wang Hao, Wang Jun, Wang Hsiang-Yu, Rummel Peter L, Garimella Suresh V, Lu Chang. Microfluidic delivery of small molecules into mammalian cells based on hydrodynamic focusing. Biotechnology and Bioengineering. 2008;100(1):150–158. doi: 10.1002/bit.21737. [DOI] [PubMed] [Google Scholar]
- 18.Jiang F, Drese KS, Hardt S, Kupper M, Schonfeld F. Helical flows and chaotic mixing in curved micro channels. AIChE Journal. 2004;50(9):2297–2305. [Google Scholar]
- 19.Sudarsan Arjun P, Victor M. Ugaz Fluid mixing in planar spiral microchannels. Lab on a Chip. 2006;6(1):74. doi: 10.1039/b511524h. [DOI] [PubMed] [Google Scholar]
- 20.Aubin Jolle, Ferrando Montse, Jiricny Vladimir. Current methods for characterising mixing and flow in microchannels. Chemical Engineering Science. 2010;65(6):2065–2093. [Google Scholar]
- 21.Johnson Timothy J, Ross David, Locascio Laurie E. Rapid microfluidic mixing. Analytical Chemistry. 2002;74(1):45–51. doi: 10.1021/ac010895d. [DOI] [PubMed] [Google Scholar]
- 22.Camesasca Marco, Manas-Zloczower Ica, Kaufman Miron. Entropic characterization of mixing in microchannels. Journal of Micromechanics and Microengineering. 2005;15(11):2038–2044. [Google Scholar]
- 23.Kang Tae Gon, Kwon Tai Hun. Colored particle tracking method for mixing analysis of chaotic micromixers. Journal of Micromechanics and Microengineering. 2004;14(7):891–899. [Google Scholar]
- 24.Chang CC, Yang RJ. Computational analysis of electrokinetically driven flow mixing in microchannels with patterned blocks. Journal of Micromechanics and Microengineering. 2004;14(4):550–558. [Google Scholar]
- 25.Squires Todd M, Quake Stephen R. Microfluidics: Fluid physics at the nanoliter scale. Reviews of Modern Physics. 2005;77(3):977–1026. [Google Scholar]
- 26.Galambos P, Forster FK. Micro-fluidic diffusion coefficient measurement. Micro Total Analysis Systems. 1998 [Google Scholar]
- 27.del Campo A, Greiner C. Su-8: a photoresist for high-aspect-ratio and 3d submicron lithography. Journal of Micromechanics and Microengineering. 2007;17:R81–R95. [Google Scholar]
- 28.Pratt Erica D, Huang Chao, Hawkins Benjamin G, Gleghorn Jason P, Brian J. Kirby Rare cell capture in microfluidic devices. Chemical Engineering Science. 2011;66(7):1508–1522. doi: 10.1016/j.ces.2010.09.012. [DOI] [PMC free article] [PubMed] [Google Scholar]
- 29.Park D, Quitadamo C, Tiersch TR, Monroe WT. Microfluidic Mixers for Standardization of Computer-Assisted Sperm Analysis. Cryopreservation in Aquatic Species. 2. World Aquaculture Society; Baton Rouge, Louisiana: 2011. [Google Scholar]
Associated Data
This section collects any data citations, data availability statements, or supplementary materials included in this article.


