

Abstract
Defining the structural organization of emotions is a central unresolved question in affective science. In particular, the extent to which autonomic nervous system activity signifies distinct affective states remains controversial. Most prior research on this topic has used univariate statistical approaches in attempts to classify emotions from psychophysiological data. In the present study, electrodermal, cardiac, respiratory, and gastric activity, as well as self-report measures were taken from healthy subjects during the experience of fear, anger, sadness, surprise, contentment, and amusement in response to film and music clips. Information pertaining to affective states present in these response patterns was analyzed using multivariate pattern classification techniques. Overall accuracy for classifying distinct affective states was 58.0% for autonomic measures and 88.2% for self-report measures, both of which were significantly above chance. Further, examining the error distribution of classifiers revealed that the dimensions of valence and arousal selectively contributed to decoding emotional states from self-report, whereas a categorical configuration of affective space was evident in both self-report and autonomic measures. Taken together, these findings extend recent multivariate approaches to study emotion and indicate that pattern classification tools may improve upon univariate approaches to reveal the underlying structure of emotional experience and physiological expression.
Keywords: emotion theory, autonomic nervous system, multivariate pattern classification, psychophysiology, affective state
A core theoretical question in emotion research concerns understanding how emotions are organized and represented in behavior and bodily responses. Two predominant views on the structure of emotions include dimensional and categorical models. Dimensional models organize emotions based on their coordinates in an affective space commonly anchored using valence and arousal (or related constructs) as dimensional axes (Lang, 1994; Russell, 1980, 2003). The spatial representation, or affective space, posited by dimensional theories typically contains two orthogonal axes, arousal and valence, from which a specific emotion can be charted. This organization implies that distinct emotions are interrelated along these two dimensions. For example, fear and disgust bear similarity to each other because they both lie on the negative hemiplane of affective space. Alternatively, categorical theories propose that emotions form distinct clusters of response properties and often assume a core set of basic emotions from which more complex representations can be built (Ekman, 1992; Izard, 1992; Plutchik, 2001). Categorical theories posit that affective space is constructed from a small set of orthogonal monopolar axes, each corresponding to a distinct emotion. A critical aspect of this characterization is the independence between emotions. For instance, fear and disgust are considered independent phenomena. Although they may share some common features, such as being hedonically negative, the occurrence of one emotion does not inform the likelihood of experiencing another.
Categorical and dimensional theories predict different relationships between emotions and the structure of affective space. For categorical theories, each emotion is hypothesized to be governed by a distinct biological mechanism and specific physiological state. This response configuration should produce a sparse structure in which emotions are distant from each other. Dimensional accounts of emotion suggest responses should be interrelated along either valence or arousal dimensions (although the general consensus is that both these dimensions are required; for a review of models see Barrett & Russell, 1999). Thus, affective space should be densely packed as it has fewer orthogonal dimensions. Although these conceptualizations of affective space differ in their theoretical underpinnings, they are not entirely contradictory. For example, a circumplex model (Russell, 1980) has certain features similar to those suggested by categorical emotion theory. A circumplex configuration in a dimensional model orders emotions along the perimeter of a circle contained by the plane created by the valence and arousal dimensions. As circumplex configurations typically require equal spacing along their perimeter (Acton & Revelle, 2004), placing more intense instances of affect further from each other increases the sparsity of affective space while maintaining two bipolar dimensions. In this way, both sparsity and clustering of emotions can be common to both categorical and dimensional emotion theories. It is therefore essential to determine how emotional responses align to both models, as they are critically different yet bear some commonalities.
There is no consensus on the structure of emotions, and synthesis of current evidence has led some researchers (e.g., Barrett, 2006a) to abandon the notion of emotion categories as “natural kinds.” A primary argument made to support this claim is the lack of evidence from psychophysiological studies and meta-analyses of functional neuroimaging data. Despite a long history of accumulating evidence supporting autonomic specificity between emotions (Ax, 1953; Ekman, Levenson, & Friesen, 1983; Levenson, Ekman, & Friesen, 1990; Stemmler, 1989), such reviews suggest that there is more consistency of findings differentiating positive and negative valence, as opposed to distinct indices of subcategories of emotion in both autonomic (Cacioppo, Tassinary, & Berntson, 2000) and central nervous system activity (Lindquist, Wager, Kober, Bliss-Moreau, & Barrett, 2012; Phan, Wager, Taylor, & Liberzon, 2002; Wager, Phan, Liberzon, & Taylor, 2003). On the opposite side of the argument, others interpret empirical evidence to support emotion categories as natural kinds (Friedman, 2010; Izard, 2007), pointing to methodological and conceptual issues as reasons for observed variability in emotional responses.
A key criticism of the available evidence to date is that most empirical studies have used univariate statistical approaches to address this theoretical question. Univariate approaches test the relationship between a single dependent measure and experimental manipulations with one or more independent variables. In contrast, multivariate statistical approaches are able to jointly consider multiple dependent variables and experimental manipulations. Given that emotions engage a complex set of physiological components that likely make unique contributions to different affective states, univariate approaches are not optimal for identifying such interactions that are critical in characterizing emotions. Even when multiple dependent variables are measured and used to construct an analysis of variance (ANOVA; e.g., if a dependent variable is used to construct an additional factor to test an interaction with an independent variable), they are assumed to be independent. In multivariate approaches, the correlation between both independent and dependent variables is used in the analysis. By jointly considering multiple variables, multivariate approaches can reveal organization in data that is lost when response variables are treated independently or examined one at a time.
A series of investigations using multivariate pattern classification techniques shows promise for testing the autonomic specificity of distinct emotions. Similar to conventional univariate approaches, these studies have elicited distinct affective states using a range of induction methods such as film (Christie & Friedman, 2004; Kreibig, Wilhelm, Roth, & Gross, 2007; Stephens, Christie, & Friedman, 2010), music (Nyklíček, Thayer, & van Doornen, 1997; Stephens et al., 2010), and autobiographical recall (Rainville, Bechara, Naqvi, & Damasio, 2006) while autonomic measures such as cardiac, respiratory, and electrodermal activity were recorded. Patterns of physiological responses were then shown to differentiate the induced states by constructing pattern classifiers capable of using relationships between the multiple responses to infer which emotion had been elicited (for a review of pattern classification, see Jain, Duin, & Mao, 2000). Generally, these studies show that autonomic patterning differentiates distinct emotions, but not as accurately as self-report of the experience. Although these findings demonstrate autonomic patterning of distinct emotions, they fail to determine whether information used by pattern classifiers is organized around multiple categories or more basic dimensions, limiting the conclusions which can be made about the structure of emotions.
The goal of the present study was to investigate the structure of emotion representations in subjective experience and physiological expression, by using pattern classification methods to decode emotional state. The term decode refers to the use of multivariate pattern classifiers to assign a class label to a set of dependent measures. Within the field of cognitive neuroscience, this approach has been widely used to infer the mental state of a participant from patterns of neural activity, termed mind reading or decoding (Norman, Polyn, Detre, & Haxby, 2006). The approach used here is analogous, only the affective state of participants is predicted using patterns of self-report and autonomic responses. We adapted the method of emotion induction from Stephens et al. (2010) and used machine learning algorithms to label the experience of fear, anger, sadness, surprise, contentment, amusement, and a neutral state. We used a nonlinear machine learning algorithm — a support vector machine using a Gaussian kernel — as it is capable of detecting more subtle and complex patterns and may result in improved performance. We compared classification accuracy against chance levels to test the hypothesis that categorical responding occurs in peripheral autonomic systems and self-report. This method of characterizing emotions as natural kinds tests for the presence of projectable property clusters. More specifically, each emotion should have definitive features that co-occur and reliably observed for every instance of the category (Barrett, 2006a). Thus, the accuracy of a pattern classifier can test natural kind status by quantifying to what extent patterns of autonomic responses are unique and differentiate emotions.
To test the organization of emotion evidenced in self-report and peripheral autonomic expression, we compared the distribution of observed classification errors to those predicted by categorical versus dimensional models of emotion. This approach parallels the well-established use of confusion data in psychophysics studies of perceptual categorization and recognition, where participants label stimuli and the distribution of errors is used to characterize the mental representation of stimuli (e.g., Loomis, 1982; Townsend, 1971). Equivalently, examining the structure of errors from a pattern classifier will reflect how classes are represented by the input variables. If emotions are organized categorically, errors should be randomly distributed and unrelated to dimensions such as valence and arousal. Conversely if responses are not specific to any emotion but map to general locations in affective space, classification errors should increase with the proximity of stimuli along dimensions of arousal and valence.
Method
Participants
Twenty healthy volunteers (10 women, 10 men, 15 White, three Black, two Asian, Mage = 23.5 years, age range: 19 –36 years) gave written informed consent and participated in the study. The study was approved in accordance with the Institutional Review Board at Duke University. Participants were compensated either $10 per hour or with course credit.
Materials and Procedure
Standardized music and film clips were presented to elicit the discrete emotions of fear, anger, sadness, surprise, contentment, amusement, and a neutral control condition. Two emotion induction techniques were used to ensure the patterning of responses was not specific to the method of elicitation. The stimuli selected were the same as those used and validated in Stephens et al. (2010), with the exception of the film clips intended to induce contentment. Because these films lacked audio and were of generally low quality, new clips for the contentment category were created from commercially available videos of beach scenes (Powerfloe Network; Portola Valley, CA). In total, the stimuli consisted of two music clips and two films for each intended emotion category, yielding a total of 28 stimuli. Participants viewed stimuli in one of four pseudorandom counterbalanced orderings, which alternated between positive and negative valence. Preceding each emotion induction stimulus, participants were presented with a standardized washout video consisting of colored bars and patterned crosshairs to reduce carry-over between stimuli (Gross & Levenson, 1995). Immediately following each emotion induction, a 23-item affect self-report scale (ASR; Christie & Friedman, 2004; Nyklíček et al., 1997; Stephens et al., 2010) was administered. This questionnaire contains items about both categorical and dimensional aspects of emotion experience, allowing comparisons between basic and dimensional models of emotion. Participants were instructed to “Select the number on the scale that best describes how you felt during the music/film clip that you just listened to/viewed. If the word does not at all describe how you felt during the clip, select ‘1.’ If the word very accurately describes how you felt, select ‘7;’ for an intermediate amount, select ‘4,’ and so forth.” Thus, the instructions emphasized self-experienced affect in response to the emotion induction rather than sensory-evaluative processes regarding the intended emotion based on physical properties of the stimuli. The specific items on the questionnaire include content, amused, surprised, fearful, angry, sad, neutral, good, bad, positive, negative, calm, agitated, pleasant, unpleasant, passive, active, relaxed, excited, indifferent, intensity, enjoyment, and familiarity. Because of the length of this within-subjects procedure, films and music were presented on two separate days within the same week in a counterbalanced order. Each experimental session lasted approximately 2 hr. Responses were made by pressing the corresponding button on a keyboard. Presentation of stimuli and acquisition of behavioral responses was controlled using Cogent 2000 software (Wellcome Department of Imaging Neuroscience, http://www.vislab.ucl.ac.uk/cogent.php).
Psychophysiological Recording and Feature Extraction
Psychophysiological data were acquired using a BIOPAC MP-150 data acquisition system and subsequently processed using AcqKnowledge software (BIOPAC Systems Inc., Goleta, CA) and custom in-house scripts (MATLAB 2010a, The MathWorks Inc., Natick, MA, 2010). Physiological activity was recorded as an analog signal and digitized at a frequency of 200 Hz. Finite sampling of any continuous measure can introduce error in its reconstruction, and selecting a sufficiently high sampling rate is critical. Although the selected sampling rate may contribute as a potential source of error in the computation of measures requiring temporal precision such as heart-rate variability (Merri, Farden, Mottley, & Titlebaum, 1990), it is sufficient for capturing the gestalt of peripheral changes occurring in different biological systems at varying timescales. Electrodermal, cardiac, respiratory, and gastric activity were targeted for recording to provide a broad sampling of autonomic responding. Electrodermal activity was acquired by placing two Ag-AgCl electrodes on the hypothenar eminence of the left palm and amplified using the GSR 100C module. Changes in cardiac activity were measured using a lead II electrocardiogram (ECG) configuration with electrodes placed on the right wrist and left ankle and amplified using the ECG 100C module. Respiratory activity was measured using a BIOPAC SS5LB respiratory effort transducer placed just below the sternum and amplified using the RSP 100C module. Gastric activity was recorded using a monopolar cutaneous electrode placement along the transpyloric plane and amplified using the EGG 100C module. Digitized physiological data were processed on a trial-by-trial basis for each instance of emotion induction to extract features relevant to autonomic patterning. Electrodermal data were processed using custom MATLAB scripts to extract the tonic skin conductance level (SCL) and the skin conductance response rate (SRR). SCL was obtained by calculating the mean level of skin conductance. SRR was derived by counting the number of individual skin conductance responses during the emotion induction, indicated by continuous increases in electrodermal activity with amplitude greater than .02 S. ECG data were processed using heart rate variability software (Acharya, Joseph, Kannathal, Lim, & Suri, 2006; Brennan, Palaniswami, & Kamen, 2001) in the BIOSIG-toolbox (Schlogl & Brunner, 2008) to obtain heart rate (HR), heart period (HP), high frequency cardiac power (HF; .15 to .40 Hz), low frequency cardiac power (LF; .04 to .15 Hz), very low frequency cardiac power (VLF; 0 to .04 Hz), and total cardiac power (TP). AcqKnowledge software was used to decompose digitized respiratory data to measures of inhale time, exhale time, respiratory depth, respiration rate, respiratory sinus arrhythmia (the breath to breath difference between minimum and maximum R-R interval), peak inspiratory flow, and peak expiratory flow for each trial. The relative power of the electrogastrogram at a frequency of 3 cycles per minute was computed as an index of normogastria (Harrison, Gray, Gianaros, & Critchley, 2010). Given that these peripheral measures stem from common sources, considerable correlation between variables was expected. Although this issue of multicollinearity is a common issue in univariate regression-based analysis, linear pattern classifiers can pool evidence offered by correlated inputs and nonlinear classifiers can use the presence or absence of interactions between variables in constructing a classification rule.
These 16 autonomic measures were adjusted to reflect relative change from the washout preceding the trial by subtracting the mean value of the 60 s prior to the end of the emotion induction from the last 60 s of the preceding washout. This averaging served as a temporal filter, reducing the impact of artifacts and ensuring a stable measure of peripheral responses. As the stimuli had variable duration and on average lasted 124 s, averaging during this window ensures the emotions have had sufficient time to emerge and offers an even sampling for all stimuli. Beyond this windowed averaging, no data were explicitly removed due to the presence of artifacts, as the preprocessing and analytical approach used should minimize their impact. Prior to pattern classification analysis, autonomic measures were converted to a standardized z-score within subjects to remove variability related to overall levels of autonomic responsivity between subjects.
Statistical Analysis
The effectiveness of the emotion induction was assessed by performing an ANOVA using categorical items from the self-report scales. Post hoc contrasts were constructed to compare the targeted emotional response against all alternatives. This manipulation check was used to ensure the experience of emotion occurred as intended.
The amount of emotion-related information present in autonomic responding and self-report was investigated using pattern classification analysis. In this type of analysis, a classifier is constructed that determines the categorical grouping of response variables, called features, by creating a decision rule. We constructed classifiers using either autonomic responses or self-report as input in an attempt to decode the categorical emotion label for each trial. Ground truth for classification was determined a priori based on previous work validating the stimuli (Gross & Levenson, 1995; Nyklíček et al., 1997). In this respect, the labeling of ground truth was independent of the measures used as input for pattern classification. Nevertheless, given that prior work has demonstrated categorical experience of these stimuli from single items of self-report, we predict pattern classifiers should be able to decode the emotional state of participants from self-report with high accuracy. As there were 20 participants and 28 instances of emotion induction, a total of 560 data points were available for training and testing the classifier. The number of possible features to use as input to the classifiers was 23 in the case of self-report and 16 for autonomic activity.
We selected a support vector machine algorithm, implemented in libSVM (Chang & Lin, 2011), using both linear and radial basis functions (Boser, Guyon, & Vapnik, 1992) to classify the data. As classification involved labeling seven classes, the default “one-against-one” multiclass algorithm of libSVM was used (Hsu & Lin, 2002). Kernel parameters were automatically tuned for the classifiers using gradient descent (Chapelle, Vapnik, Bousquet, & Mukherjee, 2002). To estimate classifier performance in a manner that generalizes between subjects, repeated random subsampling was performed. This form of validation involves randomly dividing the data into training and testing sets multiple times to estimate the error rate of a classifier. This approach is advantageous because the number of training and testing samples can be matched, which provides balance between model accuracy and low variance in estimating the classification error rate. Unlike other methods such as k-fold cross-validation, the amount and proportion of training and testing data is not dependent on the number of folds. In this case, half of the subjects were chosen at random for training (the remainder used for testing) and the trials were stratified so an equal number of instances from each emotion category (30) was used for training and testing. The subsampling procedure was repeated 100 times, yielding predicted labels made by the classifiers which could be compared to the true categorical label of each instance. This approach is advantageous because using 210 instances for training and testing relative to a much smaller number of features aids against overfitting — a common problem when feature sizes are larger, such as in classification of genomics or neuroimaging data. Thus, the ratio between the number of instances used and the number of features in training was kept large, improving the predictive power of the classifier. Further, the approach ensures that a large number of independent samples were used to test the classifier, factors critical to minimizing bias in the classification of small samples (Raudys & Jain, 1991).
To evaluate our first hypothesis that distinct affective states are represented in patterns of peripheral autonomic activity and self-report, we conducted the following statistical analyses. We calculated the accuracy of the classifier for each repetition by comparing the categories predicted by the classifier to the true categories in the testing set. Nonparametric statistical tests were performed to ensure robustness against violations of normal distribution assumptions. Chance performance was estimated by permuting emotion labels and running the random subsampling procedure on the same data. Statistical significance of performance was determined by entering the multiple repeated estimates of classifier accuracy using true labels against those with the random labels with a Wilcoxon signed-ranks test. This approach has been suggested to overcome violations of the assumptions of parametric tests created when making inference on cross validated data (Bouckaert & Frank, 2004; Demšar, 2006). By adopting a subsampling approach that tested across different subjects and induction methods, we aimed to minimize dependence between samples on factors other than the induced emotion — which could possibly bias estimates of classification accuracy. Although classification was run with support vector machines using both linear and Gaussian kernels, nonlinear classification outperformed simpler linear approaches using both self-report (10.9% improvement, z = 8.14, p < .001) and peripheral responses (27.1% improvement, z = 8.68, p < .001). To simplify the presentation of results, we report only results from nonlinear classification, given its superior performance.
To investigate the degree to which response patterning supports different theoretical organizations of emotion, we examined the distribution of errors produced by pattern classifiers. Using the true and predicted labels from classification, we constructed a confusion matrix to characterize the structure of performance on each repetition. The confusion matrix was then used to tally the number of errors made for the 21 possible pairwise combinations of emotions that could constitute an error (e.g., mistaking fear and anger). The distribution of errors on each repetition was compared to the difference in subjective experience along discrete categories and dimensions of arousal and valence. Categorical items directly corresponded to the seven self-report measures for each emotion: “content,” “amused,” “surprised,” “fearful,” “angry,” “sad,” and “neutral.” Measures of valence were computed by averaging the values from the self-report ratings of “good,” “positive,” and “pleasant,” while subtracting the average of the values from the “bad,” “negative,” and “unpleasant” ratings for each emotion category. Similarly, arousal indices were calculated by averaging ratings for the items “agitated,” “active,” and “excited,” while subtracting the average values of “calm,” “passive,” and “relaxed.” We calculated the Euclidean distance between each pair of emotion categories, yielding 21 measures of proximity of the induced emotions in an affective space characterized either by valence and arousal or discrete categories. Distances were calculated on test data of each repetition, ensuring independence from model construction. Correlations between these proximity values and the number of classification errors were computed on each repetition of the subsampling procedure to test whether information captured in pattern classification is driven by these affective dimensions.
Results
Manipulation Check
Contrasts from the ANOVA of self-report variables revealed that the target emotions were successfully induced. Post hoc analysis of planned contrasts revealed that, on average, the experience of each category of stimuli was judged to be greater for the intended emotion than alternative categories (see Table 1).
Table 1.
Validation of Emotion Induction
| Self-report of experienced emotion vs. other |
Target |
||||||||
|---|---|---|---|---|---|---|---|---|---|
| 1 | 2 | 3 | 4 | 5 | 6 | 7 | t(133) | d | |
| 1. Contentment | 2.20 | 0.62 | 1.12 | 1.38 | 1.33 | 0.72 | 1.54 | 8.46 | 1.47 |
| 2. Amusement | 1.62 | 2.93 | 0.22 | 1.31 | 1.01 | 1.15 | 0.30 | 12.52 | 2.17 |
| 3. Surprise | 0.80 | 0.17 | 2.27 | 0.67 | 0.29 | 0.39 | 0.32 | 9.10 | 1.58 |
| 4. Fear | 1.20 | 0.65 | 0.03 | 2.27 | 0.87 | 0.44 | 0.74 | 10.13 | 1.76 |
| 5. Anger | 1.05 | 0.76 | 0.39 | 0.65 | 1.51 | 1.02 | 1.12 | 6.40 | 1.11 |
| 6. Sadness | 0.29 | 0.24 | 0.05 | 0.01 | 0.37 | 1.47 | 0.78 | 5.71 | 0.99 |
| 7. Neutral | 0.48 | 1.73 | 1.74 | 0.89 | 0.62 | 0.67 | 1.07 | 3.58 | 0.62 |
Note. Self-report of emotion conveys the standardized scores for categorical items, averaged across participants. Numbers in bold font indicate scores for the target emotion. The columns on the right indicate the t statistic and effect size (Cohen’s d) for post-hoc contrasts of the target emotion versus all alternatives.
Decoding Distinct Emotions from Response Patterns
Feature extraction produced an array of 23 self-report and 16 autonomic activity measures (see Figure 1 for mean patterns of self-report and autonomic activity). The confusion matrices in Figure 2 depict the hits, misses, and false alarms of the classifiers, from which statistical measures of performance were computed. Classification using self-report measures yielded an overall accuracy of 88.2%, which was significantly greater than the expected chance rate of 14.3% (z = 8.68, p < .001). Classifiers using autonomic measures to decode emotional state exhibited similar results, with a classification rate of 58.0% (z = 8.68, p < .001). Post hoc tests comparing the accuracy of classification on instances of film versus music induction did not reveal a significant difference (z = 0.89, p = .374), indicating that emotion-specific response patterns did not vary significantly as a function of induction method. These results suggest that configurations of peripheral physiology are diagnostic of affective states across participants, although to a lesser degree than experiential self-report (z = 8.67, p < .001).
Figure 1.
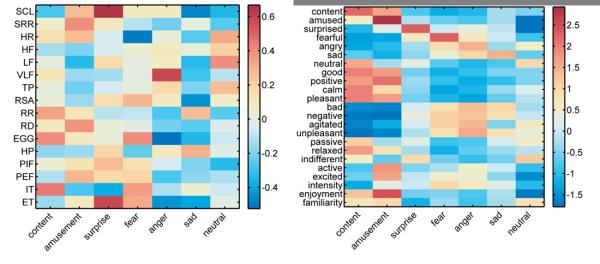
Inputs for pattern classifiers averaged across subjects from peripheral physiology (left) and self-report (right). Colorbars indicate average z-scores standardized within subjects. SCL = tonic skin conductance level; SRR = number of phasic skin conductance responses; HR = heart rate; HF = high frequency cardiac power; LF = low frequency cardiac power; VLF = very low frequency cardiac power; TP = total cardiac power; RSA = respiratory sinus arrhythmia; RR = respiration rate; RD = respiratory depth; EGG = three cycle per minute gastric activity; HP = heart period; PIF = peak inspiratory flow; PEF = peak expiratory flow; IT inhale time; ET = exhale time.
Figure 2.
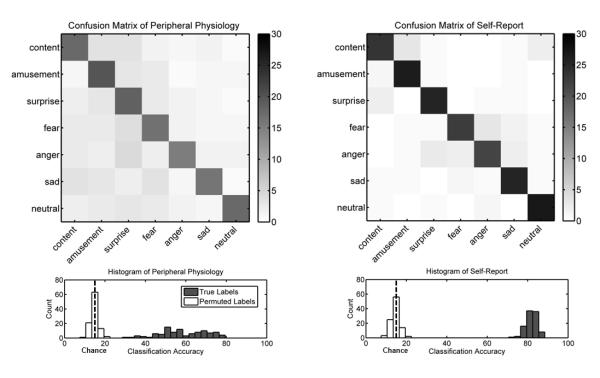
Performance metrics for classification of emotions from peripheral physiology (left) and self-report (right). Confusion matrices (top) illustrate the distribution of classification errors. Colorbars indicate the number of trials in each cell. The diagonal of a confusion matrix contains the number of hits, where the predicted emotion matches the target emotion. The number of misses for a given category is indicated by the sum of off-diagonal values for the corresponding row in the matrix. Similarly, the number of false alarms for a category is indicated by the sum of off-diagonal values in a given column. Note the increased clustering of errors for similar emotions in self-report versus peripheral physiology. As depicted in histograms of accuracy (bottom), overall classification performance greatly exceeds chance levels estimated by running the same classification on randomly permuted labels.
Examining the relationship between the number of classification errors and location in a two-dimensional affective space revealed that valence and arousal contributed selectively to classification of self-report compared to physiological responses. Plotting the location of all 560 trials based on self-report of valence and arousal revealed a broad sampling of affective space, with considerable overlap between distinct emotions (see Figure 3). Consistent with models proposing a dimensional organization of emotion, classification of self-report produced fewer errors when the experienced emotions were more distant in affective space (r = 0.34, z = 8.50, p < .001; see Figure 4). For example, errors between fear and anger (M = 3.00, SD = 0.98) were more frequent than those between contentment and fear (M = 0.31, SD = 0.28) as assessed by a Wilcoxon signed-ranks test (z = 8.66, p < .001). In contrast, the structure of errors from classifying physiological responses was not correlated with distance along dimensions of valence and arousal (r = .03, z = 1.19, p = .235). In this case, confusions between fear and anger (M = 3.74, SD = 1.56) were not more frequent than those between contentment and fear (M = 4.59, SD = 1.43, z = 0.23, p = .81). More broadly, errors between emotions differing in valence and arousal such as anger and contentment (M = 3.48, SD = 1.66) or sadness and amusement (M = 4.25, SD = 1.52) did not produce fewer errors on average than those between fear and anger (z = 0.78, p = .433). These findings indicate that peripheral autonomic responses are specific to distinct emotions irrespective of an underlying structure based on dimensions of valence and arousal.
Figure 3.
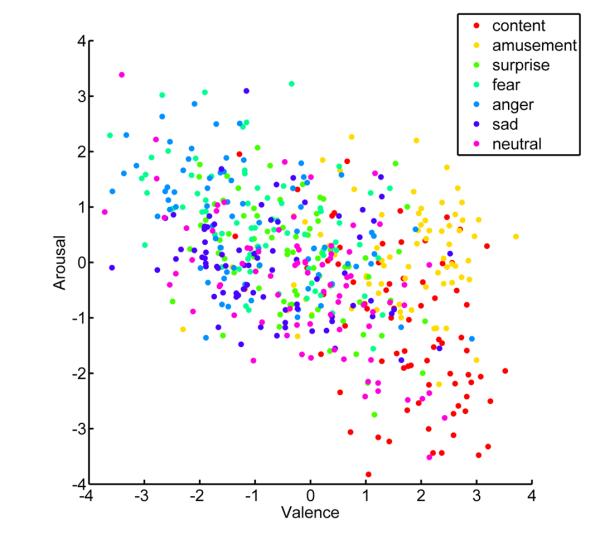
Dimensional sampling from self-report of emotion. Scatterplot shows the distribution of experienced emotion along dimensions of arousal and valence for all 560 trials. The location for trials along the valence axis reflects the average response of self-report items “good,” “positive,” and “pleasant” minus the scores for items “bad,” “negative,” and “unpleasant.” The location along the arousal axis is indicative of the mean value of items “agitated,” “active,” and “excited,” while subtracting the average value of responses for “calm,” “passive,” and “relaxed.”
Figure 4.
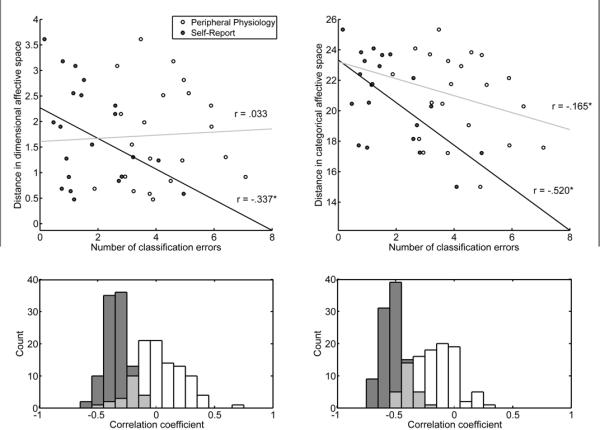
Relationship between classification errors and experienced emotion along dimensions of valence and arousal (left) and seven discrete categories (right). Scatterplots (top) depict the relationship between the number of classification errors made as a function of the distance between experienced emotion in an affective space with dimensions corresponding to either seven categories or valence and arousal (averaged across 100 repetitions). Each point reflects one of 21 possible pairwise combinations between emotions. In the dimensional configuration, for instance, fear versus anger falls close to the origin along the y axis, whereas fear versus contentment has a larger value because the two emotions differ in both valence and arousal. The distance between emotions differs when computed on the basis of categorical items, as each emotion is predominantly mapped to a single measure (see Table 1). Histograms (bottom) show the full distribution of correlation coefficients computed on all repetitions. Average correlation coefficients from these distributions are superimposed on the scatterplots. White points in the scatterplot and bins of the histograms indicate physiological measures, whereas gray points are from self-report. In the dimensional configuration of affective space, classification using self-report produced fewer errors as the distance between emotions increased, whereas the performance of classifiers using peripheral autonomic measures did not exhibit this relationship. Alternatively, when a categorical conception of affective space was considered, classification errors using both self-report and peripheral measures were significantly fewer as the distance between emotions increased.
Testing the relationship between the similarity of experienced emotion on the basis of categorical self-report items and classification errors indicated that both experiential and physiological responding were organized in a categorical manner (see methods). Classification errors were fewer when the Euclidean distance increased in an affective space constructed from seven distinct categories for both self-report (r = 0.52, z = 8.68, p < .001) and peripheral physiological responses (r = 0.17, z = 1.19, p < .001). Further, direct comparisons revealed both self-report (z = 8.51, p < .001) and peripheral autonomic measures (z = 7.93, p < .001) exhibited a closer correspondence to categorical than dimensional arrangement of affective space. Together, the present results demonstrate that information in peripheral physiological signals capable of discriminating between distinct emotional states primarily reflects categorical aspects of emotional experience, whereas self-reports incorporate aspects of both categorical and dimensional structure.
Discussion
Characterizing the organization of affective representations in behavioral, psychophysiological, and neural metrics of emotion is a central goal of affective neuroscience. Recent advances in applying multivariate pattern classification approaches to such complex data sets holds much promise to elucidate the nature of affective space and to advance an understanding of how relevant information for discriminating emotions is decoded. Consistent with Stephens et al. (2010), we found that music and film could be used to elicit specific emotions and that physiological patterning during these experiences could be used to infer the emotion induced. Beyond replicating previous findings, the present study provides novel evidence that emotion-specific information contained in patterns of autonomic activity is not structured around dimensions of valence and arousal. These findings advance knowledge of the structure of physiological responding and self-report in emotion and point to both commonalities and differences between predominant theoretical models.
Although the replication of previous work was notable, there were some methodological and analytical differences worthy of mention. The autonomic measures we recorded differed slightly from those used by Stephens et al. (2010). We did not use impedance cardiography or blood pressure monitors, and we included the use of an electrogastrogram. Although this reduced set of input features potentially limited the capability of classifiers to decode emotional state, the replication of significant classifier performance suggests the sampling of autonomic activity was sufficiently broad for this task. The success of autonomic classification was likely due in part from sampling both branches of the autonomic nervous system simultaneously, which has been identified as a critical aspect of studying autonomic response patterning (Cacioppo et al., 2000).
In addition to these methodological differences, we used more advanced machine learning algorithms than Stephens et al. (2010). By applying principles and methods commonly used in the emerging field of affective computing (Picard, Vyzas, & Healey, 2001) as suggested by Kolodyazhniy, Kreibig, Gross, Roth, and Wilhelm (2011), we improved on the performance of classifiers. The use of nonlinear algorithms improved classification rates beyond those of linear classifiers using both autonomic and self-report measures. Peripheral information signifying distinct emotions could be summed across multiple autonomic systems using linear methods, but also the covariation between multiple autonomic systems was further captured by nonlinear relationships. In this respect the information conveyed by the autonomic nervous system is more than the sum of its parts. Nonlinear classification algorithms are particularly well suited to decoding distinct affective states using psychophysiological approaches for several reasons. First, nonlinear classifiers are capable of using information that is carried in the interaction of variables, which can be entirely missed using linear methods. Second, the number of features used (16) was relatively small compared to the number of instances or data points used for training and testing (210). Finally, decoding seven classes of stimuli is a complex task. Increasing the dimensionality of the data using a nonlinear kernel aids in separating classes by increasing the sparsity of the data in multidimensional space. Thus, although prior pattern classification efforts have provided empirical support for categorical models, advances in machine learning techniques show promise in improving the detection of affective state from autonomic activity.
In addition to showing that autonomic measures are diagnostic of the affective state of an individual, we verified that information used in pattern classification was independent of affective dimensions of valence and arousal. This finding supports emotion theories that suggest information carried in autonomic responses are capable of differentiating distinct emotions, namely basic (Ekman, 1992; Izard, 1992) and appraisal theories (Scherer, 1984) of emotion. These results stand in contrast to meta-analysis of studies relying on univariate methods (Cacioppo et al., 2000), which suggest there is little consistency in autonomic responding for specific emotions, as well as theories suggesting that physiological responses are organized along valence and arousal from which the experience of discrete emotions are constructed (Barrett, 2006b; Russell, 2003). It is important to note that this result is not contrary to the common finding that specific peripheral physiological responses (e.g., electrodermal activity, heart rate, or facial expression) are related to the experience of arousal or valence (Bradley & Lang, 2000). Rather, it demonstrates that the information carried in autonomic signals separate from these dimensions is specific to distinct affective states.
Although we found that autonomic and experiential measures of affective state do not share the same structure, this does not necessitate that a peripheral, autonomic representation of emotion cannot be acted upon by cognitive processes to yield a more distinct conscious experience. This transformation between peripheral physiology and self-report is evident through development (Posner, Russell, & Peterson, 2005), whereby children have difficulty differentiating between distinct emotions but can identify “happy” or “sad” faces (Bullock & Russell, 1984). This difference is also evident in individuals with alexithymia (Sifneos, 1972), who have difficulty reporting their affective state, if only using basic words to describe their feelings. In this regard, cognitive processes engendered through development may be responsible for shaping a peripheral representation of emotion into one that is experienced consciously. Our findings suggest that peripheral autonomic activity contains information capable of representing discrete emotions, and the readout of this information may be partially reorganized, leading to somewhat different manifestations of emotion in peripheral autonomic signals and self-report.
We have demonstrated the use of multivariate pattern classifiers to test the ability of different models to organize distinct emotion states. This novel approach offers affective neuroscience a framework for comparing and validating models of emotion in different response systems. To more fully capture the organizational properties of emotional representation, future assessment of response patterning should directly compare a wider array of models (e.g., those based on cognitive appraisal theory; Scherer, 1984), include other measures of emotional responding (such as neural indices), and use additional induction methods such as autobiographical recall or visual imagery. In addition, as some classification parameters were optimized within the present sample, it will be important to test the accuracy of classification models on separate generalization sets in the future. Finally, it would be important to compare explicit emotion labeling with free viewing or listening of stimuli. Testing the structure proposed by competing models highlights the commonalities and differences between them, hopefully enabling advances in emotion theory to be made. In turn, this endeavor should elucidate the core properties of emotion organization, be they conceptualized as dimensions, clusters, or a series of events.
Acknowledgments
This research was supported in part by NIH R01 DA027802 and a Duke Institute for Brain Sciences Research Incubator Award. We thank Bruce Friedman and Ivan Nyklíček for providing copies of stimulus materials used in the present study.
References
- Acharya UR, Joseph KP, Kannathal N, Lim CM, Suri JS. Heart rate variability: A review. Medical & Biological Engineering & Computing. 2006;44:1031–1051. doi: 10.1007/s11517-006-0119-0. doi:10.1007/s11517-006-0119-0. [DOI] [PubMed] [Google Scholar]
- Acton GS, Revelle W. Evaluation of ten psychometric criteria for circumplex structure. Methods of Psychological Research. 2004;9:1–27. [Google Scholar]
- Ax AF. The physiological differentiation between fear and anger in humans. Psychosomatic Medicine. 1953;15:433–442. doi: 10.1097/00006842-195309000-00007. [DOI] [PubMed] [Google Scholar]
- Barrett LF. Are emotions natural kinds? Perspectives on Psychological Science. 2006a;1(1):28–58. doi: 10.1111/j.1745-6916.2006.00003.x. doi:10.1111/j.1745-6916.2006.00003.x. [DOI] [PubMed] [Google Scholar]
- Barrett LF. Solving the emotion paradox: Categorization and the experience of emotion. Personality and Social Psychology Review. 2006b;10(1):20–46. doi: 10.1207/s15327957pspr1001_2. doi:10.1207/s15327957pspr1001_2. [DOI] [PubMed] [Google Scholar]
- Barrett LF, Russell JA. The structure of current affect: Controversies and emerging consensus. Current Directions in Psychological Science. 1999;8(1):10–14. doi:10.1111/1467-8721.00003. [Google Scholar]
- Boser BE, Guyon IM, Vapnik VN. A training algorithm for optimal margin classifiers. Paper presented at the Proceedings of the fifth Annual Workshop on Computational Learning Theory; Pittsburgh, PA. 1992. [Google Scholar]
- Bouckaert RR, Frank E. Evaluating the replicability of significance tests for comparing learning algorithms. Advances in Knowledge Discovery and Data Mining, Proceedings. 2004;3056:3–12. [Google Scholar]
- Bradley MM, Lang PJ. Measuring emotion: Behavior, feeling, and physiology. In: Lane R, Nadel L, Ahern G, editors. Cognitive neuroscience of emotion. Oxford University Press; New York, NY: 2000. pp. 242–276. [Google Scholar]
- Brennan M, Palaniswami M, Kamen P. Do existing measures of Poincare plot geometry reflect nonlinear features of heart rate variability? IEEE Transactions on Biomedical Engineering. 2001;48:1342–1347. doi: 10.1109/10.959330. doi:10.1109/10.959330. [DOI] [PubMed] [Google Scholar]
- Bullock M, Russell JA. Preschool childrens interpretation of facial expressions of emotion. International Journal of Behavioral Development. 1984;7:193–214. [Google Scholar]
- Cacioppo JT, Tassinary LG, Berntson GG. Handbook of psychophysiology. 2nd ed Cambridge University Press; Cambridge, UK: 2000. [Google Scholar]
- Chang C-C, Lin C-J. LIBSVM: A library for support vector machines. ACM Transactions on Intelligence Systems and Technology. 2011;2(3):1–27. doi:10.1145/1961189.1961199. [Google Scholar]
- Chapelle O, Vapnik V, Bousquet O, Mukherjee S. Choosing multiple parameters for support vector machines. Machine Learning. 2002;46(1/3):131–159. doi:10.1023/A:1012450327387. [Google Scholar]
- Christie IC, Friedman BH. Autonomic specificity of discrete emotion and dimensions of affective space: A multivariate approach. International Journal of Psychophysiology. 2004;51(2):143–153. doi: 10.1016/j.ijpsycho.2003.08.002. doi:10.1016/j.ijpsycho.2003.08.002. [DOI] [PubMed] [Google Scholar]
- Demšar J. Statistical comparisons of classifiers over multiple data sets. Journal of Machine Learning Research. 2006;7:1–30. [Google Scholar]
- Ekman P. An argument for basic emotions. Cognition and Emotion. 1992;6(3):169–200. doi:10.1080/02699939208411068. [Google Scholar]
- Ekman P, Levenson RW, Friesen WV. Autonomic nervous system activity distinguishes among emotions. Science. 1983;221(4616):1208–1210. doi: 10.1126/science.6612338. doi:10.1126/science.6612338. [DOI] [PubMed] [Google Scholar]
- Friedman BH. Feelings and the body: The Jamesian perspective on autonomic specificity of emotion. Biological Psychology. 2010;84:383–393. doi: 10.1016/j.biopsycho.2009.10.006. doi:10.1016/j.biopsycho.2009.10.006. [DOI] [PubMed] [Google Scholar]
- Gross JJ, Levenson RW. Emotion Elicitation Using Films. Cognition and Emotion. 1995;9(1):87–108. doi:10.1080/02699939508408966. [Google Scholar]
- Harrison NA, Gray MA, Gianaros PJ, Critchley HD. The embodiment of emotional feelings in the brain. The Journal of Neuroscience. 2010;30:12878–12884. doi: 10.1523/JNEUROSCI.1725-10.2010. doi:10.1523/JNEUROSCI.1725-10.2010. [DOI] [PMC free article] [PubMed] [Google Scholar]
- Hsu CW, Lin CJ. A comparison of methods for multiclass support vector machines. IEEE Trans Neural Networks. 2002;13:415–425. doi: 10.1109/72.991427. doi:10.1109/72.991427. [DOI] [PubMed] [Google Scholar]
- Izard CE. Basic emotions, relations among emotions, and emotion cognition relations. Psychological Review. 1992;99:561–565. doi: 10.1037/0033-295x.99.3.561. doi:10.1037/0033295X.99.3.561. [DOI] [PubMed] [Google Scholar]
- Izard CE. Basic emotions, natural kinds, emotion schemas, and a new paradigm. Perspectives on Psychological Science. 2007;2:260–280. doi: 10.1111/j.1745-6916.2007.00044.x. doi:10.1111/j.1745-6916.2007.00044.x. [DOI] [PubMed] [Google Scholar]
- Jain AK, Duin RPW, Mao JC. Statistical pattern recognition: A review. IEEE Transactions on Pattern Analysis and Machine Intelligence. 2000;22:4–37. doi:10.1109/34.824819. [Google Scholar]
- Kolodyazhniy V, Kreibig SD, Gross JJ, Roth WT, Wilhelm FH. An affective computing approach to physiological emotion specificity: Toward subject-independent and stimulus-independent classification of film-induced emotions. Psychophysiology. 2011;48:908–922. doi: 10.1111/j.1469-8986.2010.01170.x. doi:10.1111/j.1469-8986.2010.01170.x. [DOI] [PubMed] [Google Scholar]
- Kreibig SD, Wilhelm FH, Roth WT, Gross JJ. Cardiovascular, electrodermal, and respiratory response patterns to fear- and sadnessinducing films. Psychophysiology. 2007;44:787–806. doi: 10.1111/j.1469-8986.2007.00550.x. doi:10.1111/j.1469-8986.2007.00550.x. [DOI] [PubMed] [Google Scholar]
- Lang PJ. The motivational organization of emotion: Affect-reflex connections. Emotions: Essays on Emotion Theory. 1994:61–93. [Google Scholar]
- Levenson RW, Ekman P, Friesen WV. Voluntary facial action generates emotion-specific autonomic nervous-system activity. Psychophysiology. 1990;27:363–384. doi: 10.1111/j.1469-8986.1990.tb02330.x. doi:10.1111/j.1469-8986.1990.tb02330.x. [DOI] [PubMed] [Google Scholar]
- Lindquist KA, Wager TD, Kober H, Bliss-Moreau E, Barrett LF. The brain basis of emotion: A meta-analytic review. Behavioral and Brain Sciences. 2012;35:121–143. doi: 10.1017/S0140525X11000446. doi:S0140525X11000446. [DOI] [PMC free article] [PubMed] [Google Scholar]
- Loomis JM. Analysis of tactile and visual confusion matrices. Perception & Psychophysics. 1982;31:41–52. doi: 10.3758/bf03206199. doi:10.3758/BF03206199. [DOI] [PubMed] [Google Scholar]
- Merri M, Farden DC, Mottley JG, Titlebaum EL. Sampling frequency of the electrocardiogram for spectral analysis of the heart rate variability. IEEE Transactions On Biomedical Engineering. 1990;37:99–106. doi: 10.1109/10.43621. doi:10.1109/10.43621. [DOI] [PubMed] [Google Scholar]
- Norman KA, Polyn SM, Detre GJ, Haxby JV. Beyond mind-reading: Multi-voxel pattern analysis of fMRI data. Trends in Cognitive Sciences. 2006;10:424–430. doi: 10.1016/j.tics.2006.07.005. doi:10.1016/j.tics.2006.07.005. [DOI] [PubMed] [Google Scholar]
- Nyklíček I, Thayer JF, van Doornen LJP. Cardiorespiratory differentiation of musically-induced emotions. Journal of Psychophysiology. 1997;11:304–321. [Google Scholar]
- Phan KL, Wager T, Taylor SF, Liberzon I. Functional neuroanatomy of emotion: A meta-analysis of emotion activation studies in PET and fMRI. Neuroimage. 2002;16:331–348. doi: 10.1006/nimg.2002.1087. doi:10.1006/nimg.2002.1087. [DOI] [PubMed] [Google Scholar]
- Picard RW, Vyzas E, Healey J. Toward machine emotional intelligence: Analysis of affective physiological state. IEEE Transactions on Pattern Analysis and Machine Intelligence. 2001;23:1175–1191. doi:10.1109/34.954607. [Google Scholar]
- Plutchik R. The nature of emotions: Human emotions have deep evolutionary roots, a fact that may explain their complexity and provide tools for clinical practice. American Scientist. 2001;89:344–350. doi:10.1511/2001.4.344. [Google Scholar]
- Posner J, Russell JA, Peterson BS. The circumplex model of affect: An integrative approach to affective neuroscience, cognitive development, and psychopathology. Development and Psychopathology. 2005;17:715–734. doi: 10.1017/S0954579405050340. doi:S0954579405050340. [DOI] [PMC free article] [PubMed] [Google Scholar]
- Rainville P, Bechara A, Naqvi N, Damasio AR. Basic emotions are associated with distinct patterns of cardiorespiratory activity. International Journal of Psychophysiology. 2006;61:5–18. doi: 10.1016/j.ijpsycho.2005.10.024. doi:10.1016/j.ijpsycho.2005.10.024. [DOI] [PubMed] [Google Scholar]
- Raudys SJ, Jain AK. Small sample-size effects in statistical pattern-recognition: Recommendations for practitioners. IEEE Transactions on Pattern Analysis and Machine Intelligence. 1991;13:252–264. doi:10.1109/34.75512. [Google Scholar]
- Russell JA. A circumplex model of affect. Journal of Personality and Social Psychology. 1980;39:1161–1178. doi:10.1037/h0077714. [Google Scholar]
- Russell JA. Core affect and the psychological construction of emotion. Psychological Review. 2003;110:145–172. doi: 10.1037/0033-295x.110.1.145. doi:10.1037/0033-295X.110.1.145. [DOI] [PubMed] [Google Scholar]
- Scherer KR. On the nature and function of emotion: A component process approach. In: Scherer KR, Ekman P, editors. Approaches to emotion. Erlbaum; Hillsdale, NJ: 1984. pp. 293–317. [Google Scholar]
- Schlogl A, Brunner C. BioSig: A free and open source software library for BCI Research. Computer. 2008;41:44–50. doi:10.1109/ MC.2008.407. [Google Scholar]
- Sifneos PE. Short-term psychotherapy and emotional crisis. Harvard University Press; Cambridge, MA: 1972. [Google Scholar]
- Stemmler G. The autonomic differentiation of emotions revisited: Convergent and discriminant validation. Psychophysiology. 1989;26:617–632. doi: 10.1111/j.1469-8986.1989.tb03163.x. doi:10.1111/j.1469-8986.1989.tb03163.x. [DOI] [PubMed] [Google Scholar]
- Stephens CL, Christie IC, Friedman BH. Autonomic specificity of basic emotions: Evidence from pattern classification and cluster analysis. Biological Psychology. 2010;84:463–473. doi: 10.1016/j.biopsycho.2010.03.014. doi:10.1016/j.biopsycho.2010.03.014. [DOI] [PubMed] [Google Scholar]
- Townsend JT. Theoretical analysis of an alphabetic confusion matrix. Perception & Psychophysics. 1971;9(1A):40–50. doi:10.3758/BF03213026. [Google Scholar]
- Wager TD, Phan KL, Liberzon I, Taylor SF. Valence, gender, and lateralization of functional brain anatomy in emotion: A metaanalysis of findings from neuroimaging. Neuroimage. 2003;19:513–531. doi: 10.1016/s1053-8119(03)00078-8. doi:S1053811903000788. [DOI] [PubMed] [Google Scholar]