

ABSTRACT
Enterococcus faecium, natively a gut commensal organism, emerged as a leading cause of multidrug-resistant hospital-acquired infection in the 1980s. As the living record of its adaptation to changes in habitat, we sequenced the genomes of 51 strains, isolated from various ecological environments, to understand how E. faecium emerged as a leading hospital pathogen. Because of the scale and diversity of the sampled strains, we were able to resolve the lineage responsible for epidemic, multidrug-resistant human infection from other strains and to measure the evolutionary distances between groups. We found that the epidemic hospital-adapted lineage is rapidly evolving and emerged approximately 75 years ago, concomitant with the introduction of antibiotics, from a population that included the majority of animal strains, and not from human commensal lines. We further found that the lineage that included most strains of animal origin diverged from the main human commensal line approximately 3,000 years ago, a time that corresponds to increasing urbanization of humans, development of hygienic practices, and domestication of animals, which we speculate contributed to their ecological separation. Each bifurcation was accompanied by the acquisition of new metabolic capabilities and colonization traits on mobile elements and the loss of function and genome remodeling associated with mobile element insertion and movement. As a result, diversity within the species, in terms of sequence divergence as well as gene content, spans a range usually associated with speciation.
IMPORTANCE
Enterococci, in particular vancomycin-resistant Enterococcus faecium, recently emerged as a leading cause of hospital-acquired infection worldwide. In this study, we examined genome sequence data to understand the bacterial adaptations that accompanied this transformation from microbes that existed for eons as members of host microbiota. We observed changes in the genomes that paralleled changes in human behavior. An initial bifurcation within the species appears to have occurred at a time that corresponds to the urbanization of humans and domestication of animals, and a more recent bifurcation parallels the introduction of antibiotics in medicine and agriculture. In response to the opportunity to fill niches associated with changes in human activity, a rapidly evolving lineage emerged, a lineage responsible for the vast majority of multidrug-resistant E. faecium infections.
Introduction
Antibiotic resistance is a leading threat to human health worldwide that substantially increases the cost of health care (1). Enterococci emerged in the 1970s and 1980s as leading causes of antibiotic-resistant infection of the bloodstream, urinary tract, and surgical wounds (1), contributing to 10,000 to 25,000 deaths per year in the USA (2). Resistance to antibiotics is common among enterococci (1), and vancomycin-resistant Enterococcus faecium now represents up to 80% of E. faecium isolates in some hospitals (3). Agricultural practices have promoted the emergence of antibiotic resistance (4–6). The use of avoparcin in animal feed in Europe and elsewhere appears to have contributed to the proliferation of vancomycin resistance (7–11), and enterococci have begun to transmit vancomycin resistance to methicillin-resistant Staphylococcus aureus (12).
Previously, we examined a limited sampling of human commensal and hospital isolates of E. faecium and found that by average nucleotide identity analysis (ANI), some differed by more than 5%, crossing the threshold used for species identity (13). Since variation was noted among hospital strains (13–16) and since little was known about strains from the gastrointestinal (GI) tracts of domestic and other animals, it was of interest to determine the scope of diversity within the species and to precisely define these populations and their origins. We therefore characterized the breadth of the species by sequencing and comparing the genomes of 51 strains, sampling all areas of the existing multilocus sequence type (MLST) phylogeny (Fig. 1).
FIG 1 .

goeBURST analysis of 2,273 E. faecium entries in the E. faecium MLST database (http://efaecium.mlst.net), which can be grouped into 773 sequence types (STs) (brown circles), based upon MLST relatedness. STs included in this study are highlighted in purple.
RESULTS
Phylogenomic reconstruction of E. faecium divergence.
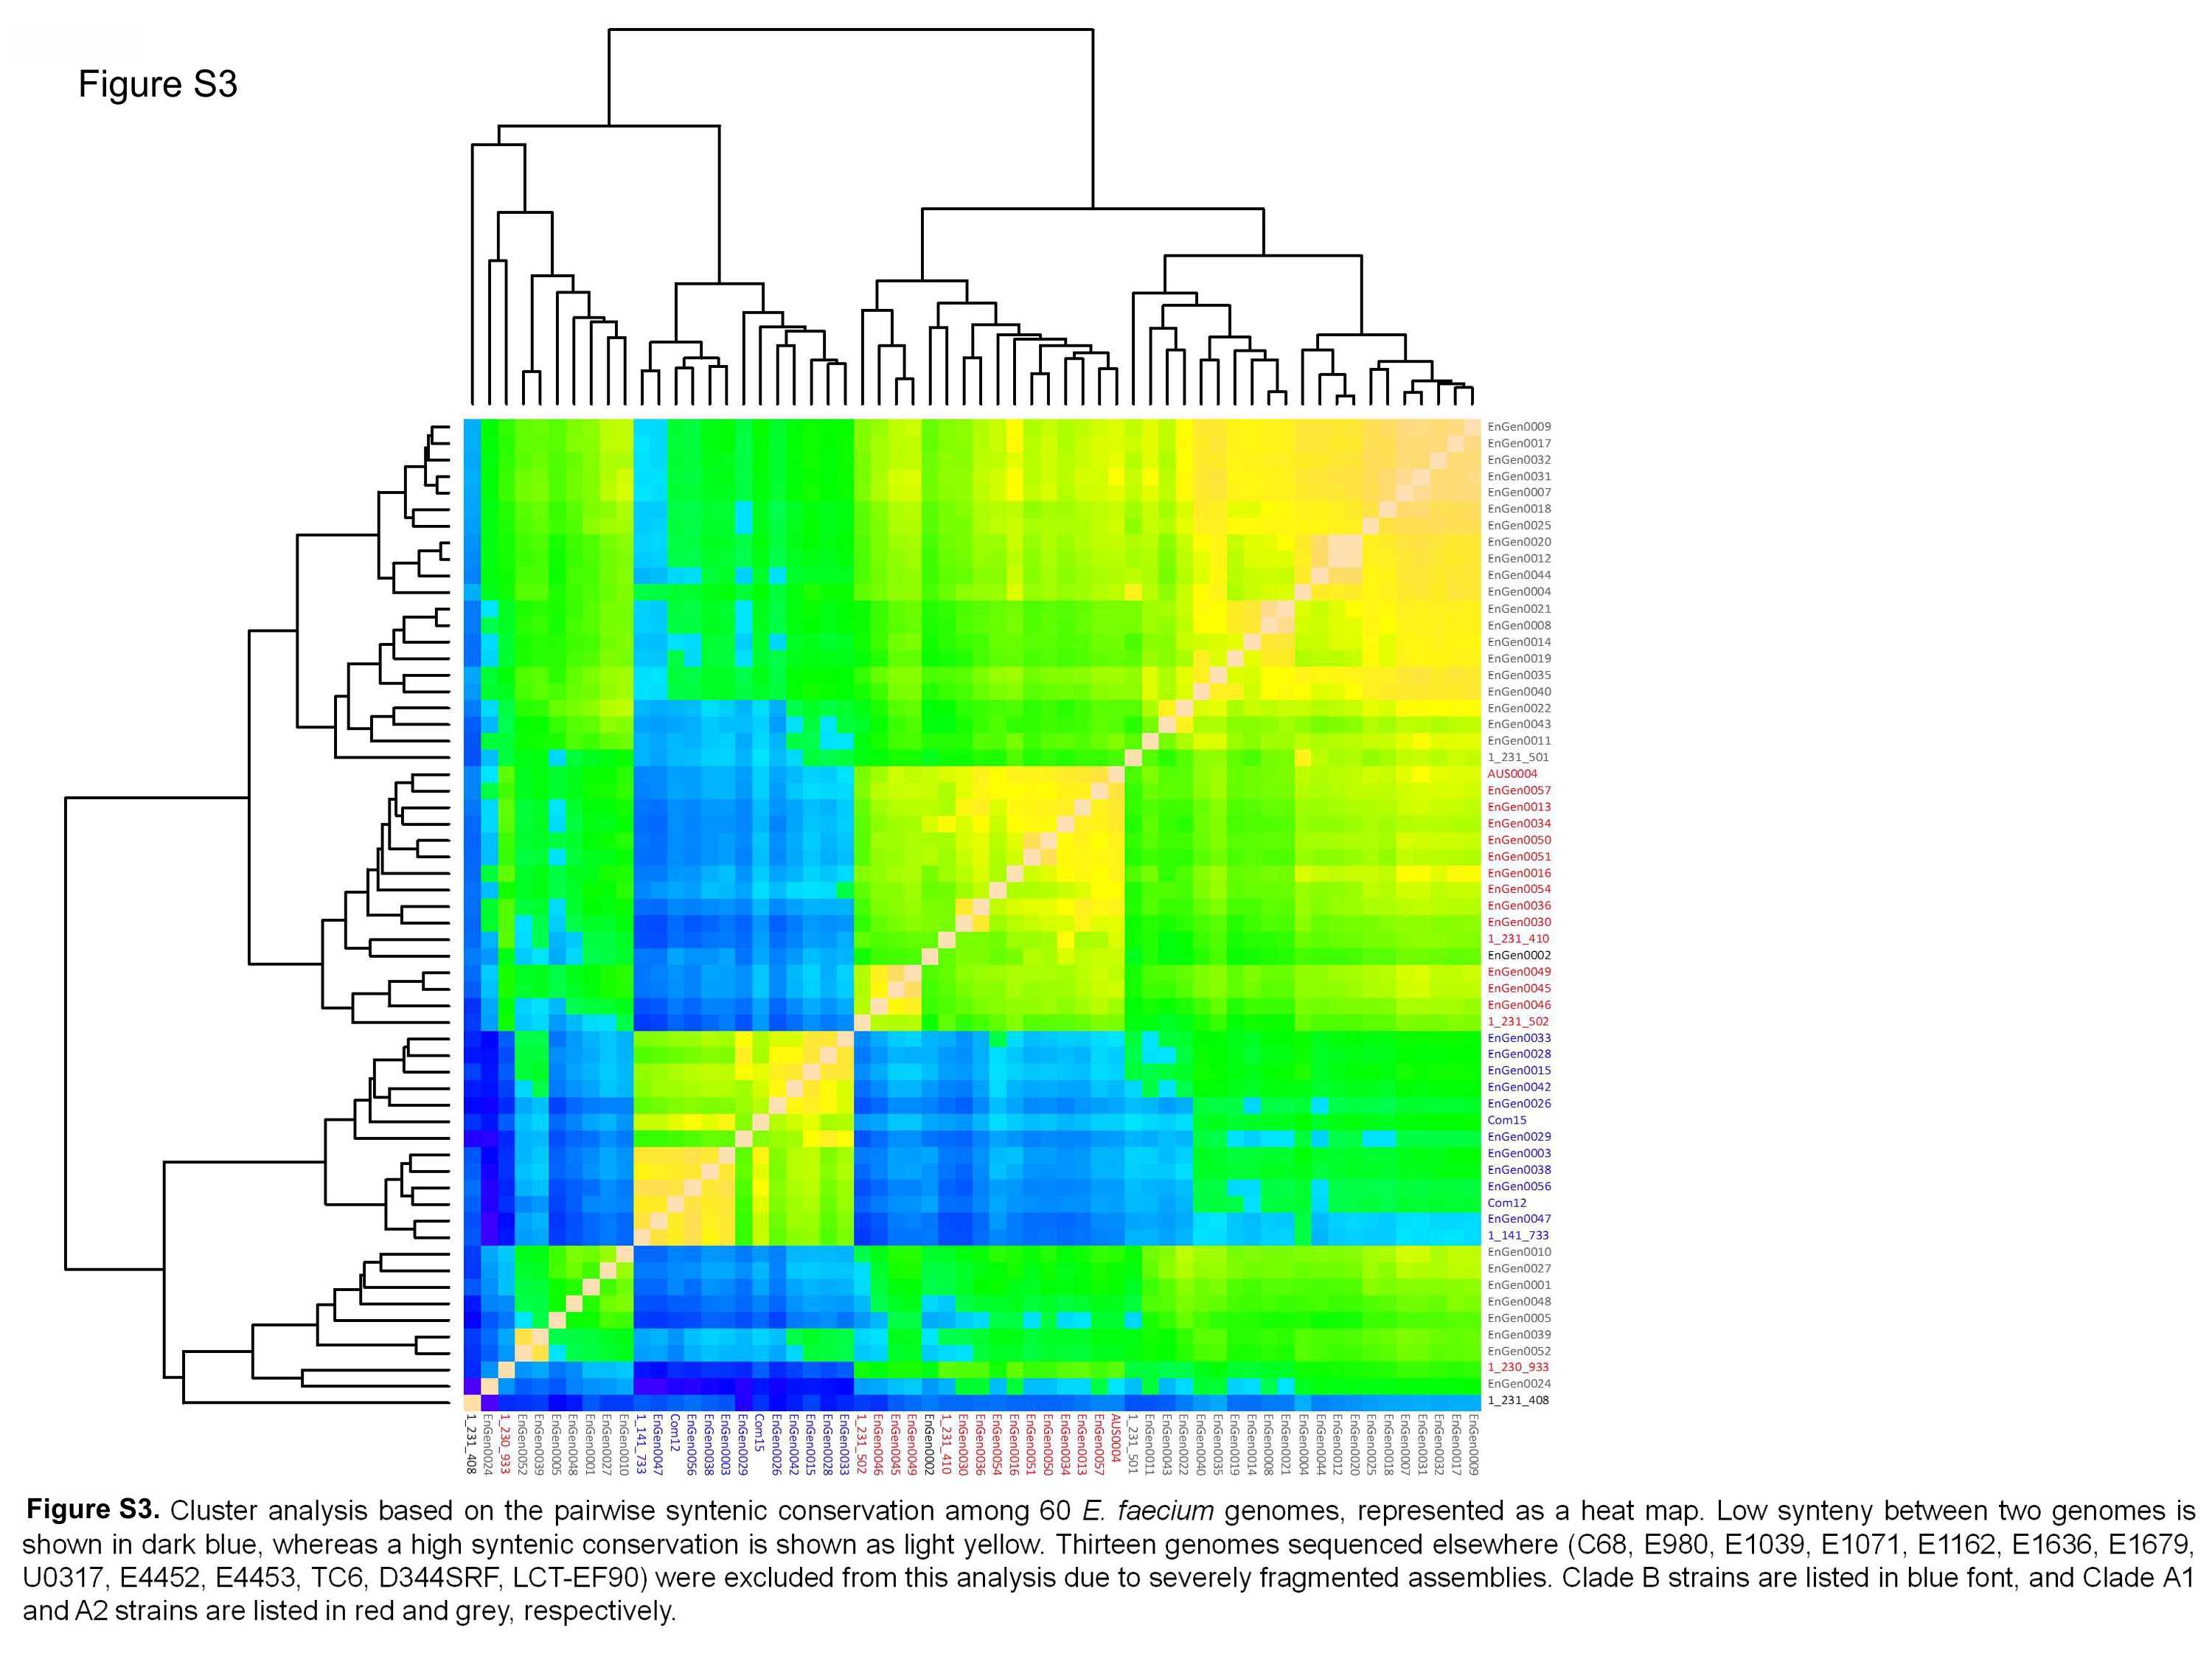
We determined the nucleotide sequences of the genomes of 51 E. faecium strains of different MLST types (see Table S1 in the supplemental material), which were obtained from diverse ecological environments (see Fig. S1 in the supplemental material) on five continents, and isolated over the last 60 years (Fig. S1). A single nucleotide polymorphism (SNP)-based phylogenetic tree, which compared these strains to each other and to an additional 22 strains from GenBank (Table S1), was generated based on variation in 1,344 shared single-copy orthologous groups (orthogroups) (Fig. 2). This tree confirmed the deep divide between clades (clades A and B) (13, 16). Most (5/7) strains isolated from the feces of nonhospitalized humans cluster in clade B. We were able to resolve the epidemic hospital strains (clade A1) from a mixed group of animal strains and sporadic human infection isolates (clade A2). This clade structure was independently recapitulated based on cluster analysis of (i) shared gene content (Fig. S2) and (ii) gene synteny (Fig. S3).
FIG 2 .

RAxML SNP-based tree based on the concatenated alignments of DNA sequences of 1,344 single-copy core genes in 73 E. faecium genomes. Bootstrapping was performed with 1,000 replicates. The origins of the strains are indicated. The dates for the split between the clades, estimated by a BEAST analysis, are indicated (ya, years ago). The infectivity score reflects the number of strains of a particular ST, in the MLST database, isolated from infection. The clades are color coded as follows: clade B in dark blue, clade A1 in red, and clade A2 in gray.
Clade A1 strains account for the vast majority of human infection (Fig. 2) and include sequence types (STs) from the clonal complex 17 (CC17) genogroup (e.g., sequence type 17 [ST17], ST117, and ST78 [18]) associated with hospital ward outbreaks around the globe (see Table S1 in the supplemental material). Interestingly, the three clade A1 strains of animal origin are from pet dogs, consistent with known links between hospital strains and household pets (19). Two strains (EnGen0002 and 1_231_408) possess hybrid genomes, consisting of a background genome of clade A1, into which 195 kb to 740 kb DNA from a clade B donor have recombined (Fig. S4).
To understand the forces that gave rise to the observed clade structure in the context of human activity, we estimated the time at which these bifurcations occurred, using Bayesian evolutionary analysis on sampled phylogenetic trees (BEAST) (20). To limit the confounding effect of recombination, detectable signatures of recombination were removed from the analysis using BRATNextGen (21). Concerned that differing stresses in different habitats could affect mutation rate, we calculated inferred rates of mutation for each clade separately. A significantly higher mutation rate was found for strains in the hospital-adapted clade A1 (4.9 × 10⁻⁵ ± 0.3 × 10⁻⁵ substitutions per nucleotide per year) than for sister clade A2 (3.6 × 10⁻⁶ ± 0.6 × 10⁻⁶ substitutions per nucleotide per year). The mutation rate for clade B was intermediate at 1.3 × 10⁻⁵ ± 0.2 × 10⁻⁵ substitutions per nucleotide per year, a rate that is similar to those recently reported for Staphylococcus aureus (22, 23).
To determine whether the calculated mutation rate differences reflected historic events or whether they are still experimentally detectable, the rate of mutation to fosfomycin resistance was measured for 10 randomly selected strains from each clade. Resistance was verified for stability by passage in the absence of selection, followed by retesting. Clade A1 strains yielded spontaneous fosfomycin-resistant variants at a rate about an order of magnitude higher than strains of either clade A2 or clade B (Fig. 3), paralleling the results of BEAST analysis. Therefore, mutation rates for each clade inferred by BEAST were used to estimate the time of divergence between clades A1, A2, and B. This placed the time of the initial split between clade A and clade B at 2,776 ± 818 years ago and that between clade A1 and clade A2 at 74 ± 30 years ago (Fig. 2).
FIG 3 .
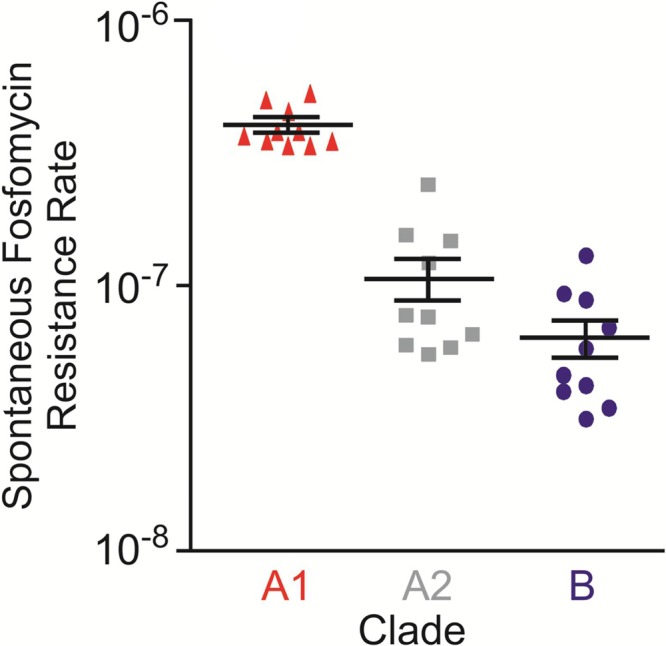
Frequency of fosfomycin resistance was determined in triplicate for 10 randomly selected strains from each E. faecium clade (clade A1 [red], A2 [gray], and B [dark blue]). Each symbol represents the average value for one strain, and the clade average ± standard deviation (error bars) for the 10 strains per clade are indicated.
Gene content differences.
Gene gain and loss make fundamental contributions to new habitat adaptation and the emergence of new lineages (24). Strains from clade A1 were found to have significantly larger overall average genome size (2,843 ± 159 genes; 2.98 ± 0.15 Mb) than strains of either clade A2 (2,597 ± 153 genes; 2.75 ± 0.14 Mb) or clade B (2,718 ± 120 genes; 2.84 ± 0.1 Mb) (Fig. 4A), indicating that perpetuating cycles of infection and survival in the hospital are associated with acquisition of new functions. Clade A1 strains also have larger core genomes (1,945 genes) than strains of clade A2 (1,724 genes) or clade B (1,805 genes), which is consistent with a very recent emergence of this lineage (i.e., little time for divergence between strains to occur) (Fig. 4C). In contrast, the pan-genome of clade A2 is larger (6,343 genes) than those of clade A1 and B (5,663 and 5,551 genes, respectively) (Fig. 4B), which is consistent with the diverse origins of strains from this clade. In comparison to other opportunists, the E. faecium genome is relatively open (see Fig. S5 in the supplemental material).
FIG 4 .

(A) Genome size comparison for E. faecium clade A1 (red), A2 (gray), and B (dark blue). (B and C) Pan-genome (B) and core genome (C) are shown for increasing values of the number of sequenced E. faecium genomes within each clade. Circles represent the number of new or core genes present when a particular genome is added to each subset. Black bars represent median values. The curve for the estimation of the size of the E. faecium pan-genome for each clade is a least-squares power law fit through medians. The size of the core genome within each clade was estimated by fitting an exponential curve through medians. (D) Heat map showing the enrichment in genetic mobile elements in E. faecium genomes within each clade (clade A1 [red], A2, [gray], and B [light blue]). Horizontal boxes represent strains, which are ordered within clades as in Fig. 2 (rotated 90°). The aggregate length (kb) of islands was used to compare content in each clade (ranging from 4 kb to 99 kb; median, 17 kb), whereas the numbers of putative plasmids (ranging from 0 to 9; median, 3) or phage elements (ranging from 0 to 4; median, 1) are represented. The heat map reflects the 10th percentile (light gray), 50th percentile (medium gray), and 90th percentile (black). The “×” symbol in a box indicates genome sequence for which the length of genomic islands could not be determined using the SIGI-HMM algorithm (27).
Previously, the genomes of hospital strains of the sister species, Enterococcus faecalis, were found to differ from commensal organisms largely as the result of mobile element acquisition (13), which was associated with the absence of CRISPR (clustered regularly interspaced short palindromic repeat) protection (25). It was, therefore, of interest to determine the extent to which mobile elements drove the divergence of E. faecium clades. Mobile elements were identified using PHAST (26) for phages, SIGI-HMM (27) for genomic islands, and BLAST for repA orthologs in plasmid-related contigs (28). Clade A1 was found to be enriched in mobile elements, including plasmids (5.4 ± 1.9 plasmids/genome in clade A1, compared to 2.7 ± 2.2 and 1.5 ± 1.1 plasmids/genome in clade A2 and B strains, respectively), integrated phages (1.6 ± 0.9 phages/genome, compared to 0.7 ± 0.7 and 0.9 ± 0.8 phages/genome in clade A2 and B strains, respectively) and other genomic islands (36 ± 26 kb of island-associated sequence/genome, compared to 14 ± 10 and 17 ± 11 kb of island-associated sequence/genome in clade A2 and B strains, respectively) (Fig. 4D). Because the genome sequences generated in the present study were of high quality, yielding a small number of scaffolds (see https://olive.broadinstitute.org/projects/work_package_1/downloads), we were able to quantify and determine the rate of occurrence and location of IS elements. IS element occurrence ranges from a low of 2.6 per Mbp (clade B strain EnGen0047) to a high of 50.7 IS elements per Mbp (clade A2 strain EnGen0024). Three IS elements (ISEnfa3, ISSpn10, and IS16) are highly enriched in clade A1 and are found outside this clade only in a single clade A2 strain (EnGen0024) and the clade A1/B hybrid strain, EnGen0002 (Fig. 5). On average, strains of clade A1 harbored a total of 391 kb of mobile element DNA, and clade A harbored an average of 332 kb. Clade B strains contained an average of 340 kb of mobile element DNA.
FIG 5 .
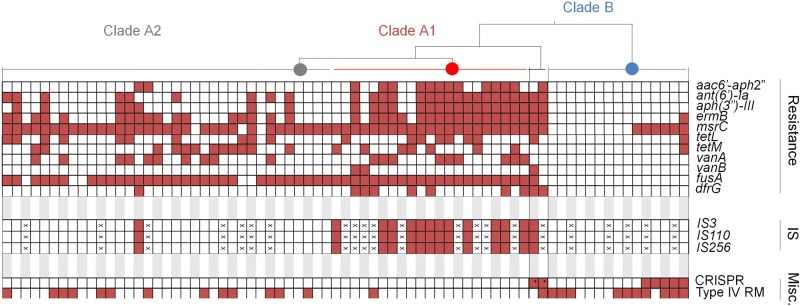
Summary of clade-specific antibiotic resistance genes, insertion sequences (IS), and select defenses against horizontal gene transfer. Each box represents a strain, arranged by clade as shown in Fig. 2. The “×” symbol in a box indicates genome sequence with an assembly quality that precluded identification of the indicated feature. An asterisk in a box indicates hybrid genomes that contain CRISPR-cas on recombined fragments. CRISPR and type IV restriction-modification (RM) systems are included in the miscellaneous (Misc.) category.
To identify functional differences and remaining differences in gene content not restricted to mobile elements, we next identified orthogroups present in ≥80% of genomes of one clade but in ≤20% of strains from a comparator (see Table S2 in the supplemental material). Contiguous groups of genes were identified and associated with the mobile elements identified above where possible. To begin to understand the ecological forces that led to the initial bifurcation between clades A and B, we identified genes occurring in most clade A (A1 plus A2) strains but that were rare in clade B and vice versa. We found 66 orthogroups enriched at the level of ≥80% in clade A and ≤20% in clade B and 138 orthogroups enriched in clade B versus clade A (Table S2). Genes enriched in clade A strains largely occurred in 12 clusters of contiguous genes (cluster 2 [C2], C8, C10, C11, C12, C17, C19, C20, C21, C22, C23, and C24), with 8 clusters occurring in identifiable mobile elements. Cluster 10, 11, 12, and 24 genes encode functions related to altered carbohydrate utilization (Table 1 and Table S2). Cluster 19 genes include ABC transporters putatively related to antibiotic transport. Other genes enriched in clade A strains, with predicted roles in adapting to different habitats, include genes encoding a putative membrane-bound metalloprotease in cluster 17 that likely confers resistance to a cognate bacteriocin (29), and an LPXTG-anchored collagen adhesin in cluster 21 that may relate to colonization and niche selection (30). Individual genes showing an enrichment in clade A versus clade B strains include a putative choloylglycine bile hydrolase related to that known to be important in the pathogenesis of Listeria infection (31), which may enable E. faecium to colonize regions of the intestine more proximal to the bile duct.
TABLE 1 .
Enrichment of functional gene clusters in E. faecium cladesa
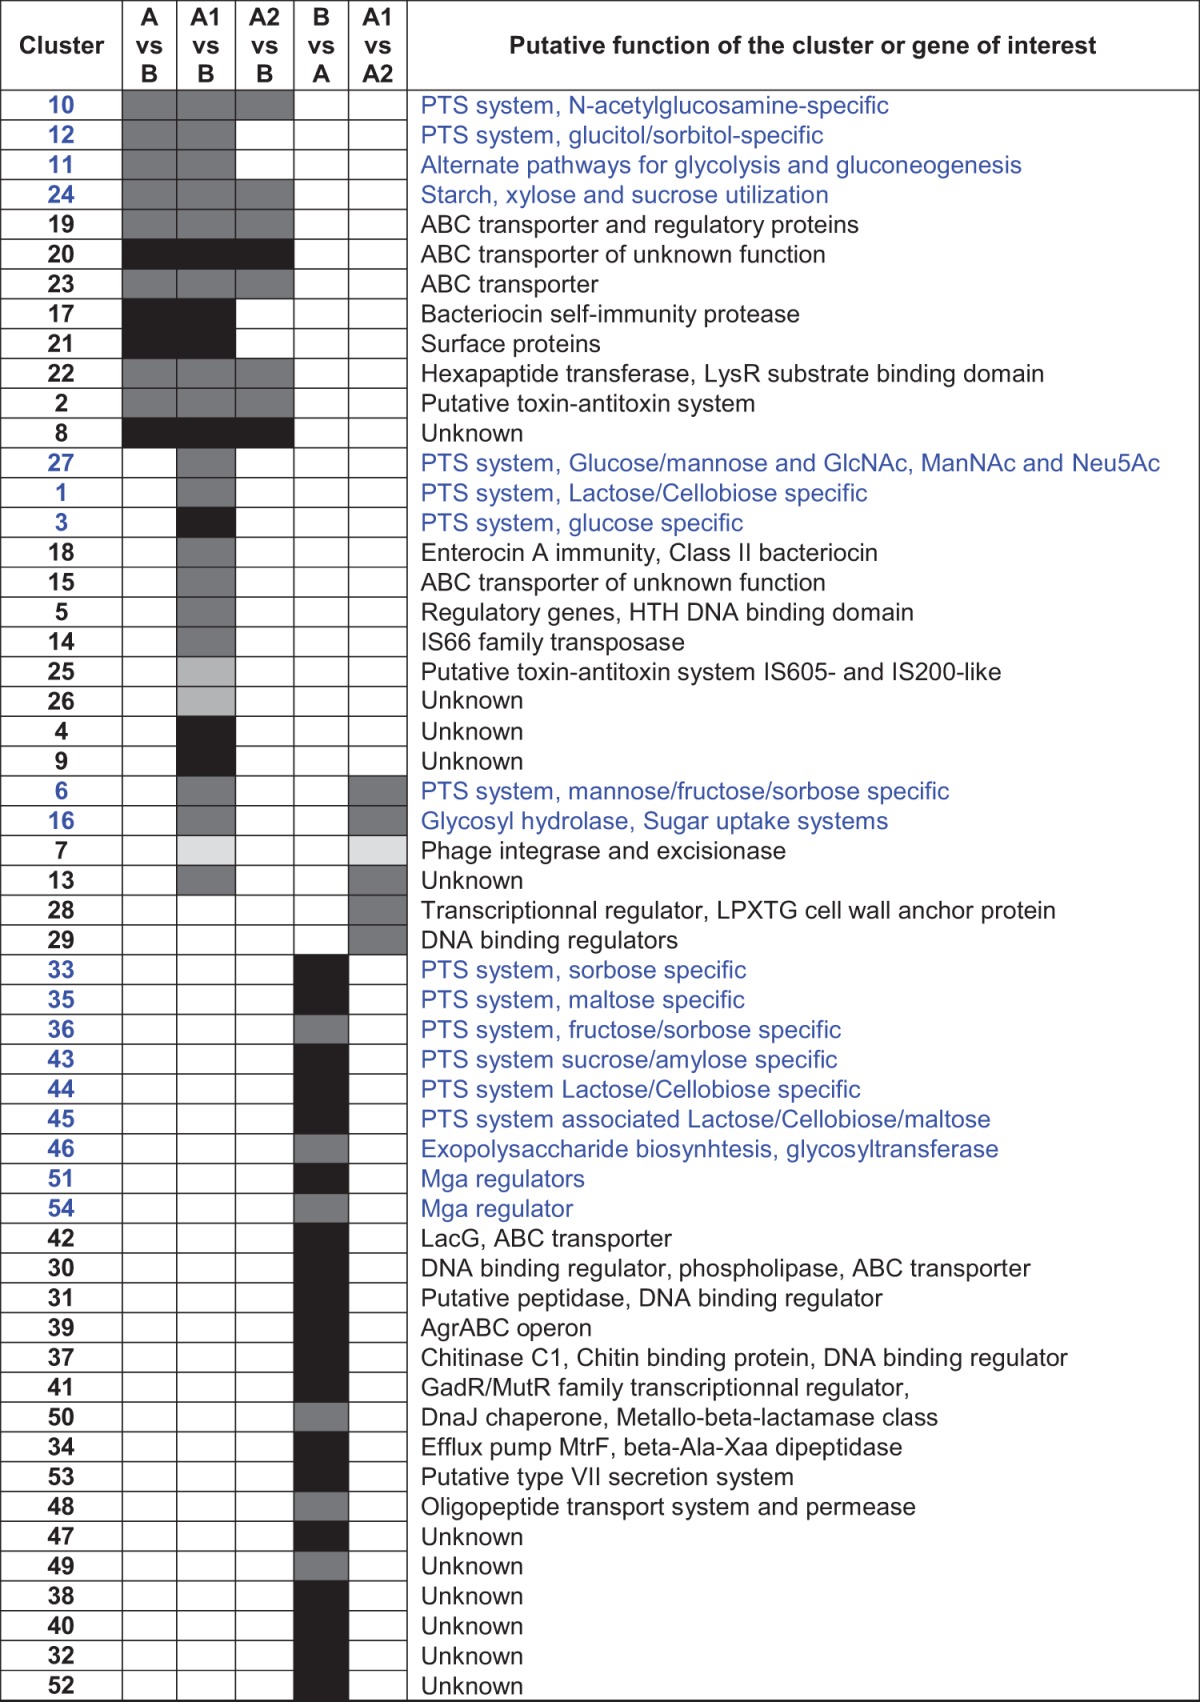
Differentially occurring clusters of genes associated with chromosomal DNA (black), putative ICE elements (integrative and conjugative elements) (dark gray), plasmids (medium gray), or phages (light gray). Clusters functionally associated with carbohydrate uptake and utilization are indicated in blue type. No genes are differentially enriched in the genomes of strains in clade A2 compared to clade A1. HTH, helix-turn-helix.
Genes representing 138 orthogroups were found to be enriched in clade B strains compared to clade A strains. These largely occur in 24 clusters of contiguous genes but this time with few signatures of mobile elements. Gene groups C33, C35, C37, C43, C44, C45, C51, and C54 and a single gene (EfmE980_2866) have predicted roles in carbon metabolism, highlighting the differential use of carbohydrates by strains of each clade (Table 1; see Table S2 in the supplemental material). Cluster 50 encodes a cysteine-containing DnaJ-like chaperone, adjacent to a putative metallo-β-lactamase class protein that is likely to be involved in the homeostasis of glutathione pools (since these commensal strains of E. faecium do not inactivate β-lactams), involved in maintenance of protein structure. A main driver of clade divergence, therefore, appears to stem from residence in different ecological environments that have selected for the systematic exchange of phosphotransferase system (PTS) systems, with strains of clade A acquiring new PTS systems on mobile elements and deleting obsolete PTS systems from the clade B chromosome.
Interestingly, cluster 39, which is enriched in clade B, contains four genes that are predicted to form an agr-like quorum-sensing system (32), along with another Mga-type regulator that may connect quorum sensing to carbohydrate utilization (Table 1; see Table S2 in the supplemental material) (33). Unexpectedly, cluster 53, with an apparent 98-amino-acid secretion target (EfmE980_2510), which also is enriched in clade B, appears to encode a type VII secretion system. Both agr (32) and type VII secretion systems (34, 35) have been studied for their contribution to infection pathogenesis, but the pattern of differential presence observed here highlights potentially important roles in commensalism as well.
It was also of interest to examine differential gene presence in clades A1 and A2. In hospital epidemic clade A1, 48 genes were identified as differentially present, with 37 genes occurring in 6 distinct clusters associated with mobile elements (Table 1; see Table S2 in the supplemental material). Interestingly, the split between clades A1 and A2 is also associated with the gain of pathways for carbohydrate utilization. Clade A1 strains acquired an apparent mobile element of 13 genes (C6 [Table 1]) encoding enzymes for uptake and utilization of fructose, sorbose, and mannose. This appears to be functionally related to a cluster (C36) that earlier was lost from clade B by strains of clade A. C6 is known to play an important role in GI tract colonization following antibiotic treatment (36). It is interesting that clade A1 recovered this ability, and this observation suggests that it may relate to human colonization. Cluster C16 is also differentially enriched in clade A1 and contributes to carbohydrate utilization. No orthogroups were enriched in clade A2 versus clade A1.
We identified additional genes that show enrichment in clade A1 compared to clade B. Gene clusters 1, 3, and 27 putatively encode proteins for PTS systems and enzymes for the interconversion and metabolism of lactose/cellobiose, glucose, mannose, N-acetylneuraminate, N-acetylmannosamine, and other sialic acids. Clusters 1 and 27 are associated with mobile elements. Cluster 18 (C18), which is also enriched in clade A1 compared to clade B, encodes a three-gene operon for a class II bacteriocin that may be a colonization factor (Table 1; see Table S2 in the supplemental material).
Bifurcation of clade A parallels the proliferation of resistance.
To understand the role that antibiotics played as a driver of clade formation, we examined the differential presence of resistance genes (see Table S3 in the supplemental material). Two resistance genes [aac(6')-li conferring resistance to kanamycin and bacA conferring bacitracin resistance] are part of the core E. faecium genome. The ubiquitous presence of aac(6')-li has been observed before and contributes to the intrinsic resistance of E. faecium to several aminoglycosides (37). The bacA gene may be responsible for intrinsic resistance to bacitracin observed among E. faecium (38). Seven strains analyzed were isolated in the 1950s and 1960s, allowing for the identification of genes associated with some of the earliest known acquired resistances to occur in E. faecium. Strains EnGen0025, EnGen0027, EnGen0031, EnGen0032, and E1636 were isolated between 1957 and 1965; these strains fall into clade A2. Each of these strains also possesses the fusA fusidic acid resistance gene. Additionally, strains EnGen0025, EnGen0027, EnGen0031, and E1636 possess the msrC gene, which confers erythromycin resistance. Strain EnGen0025 additionally acquired the aminoglycoside resistance genes ant(6')-la (conferring resistance to streptomycin) and aph(3′)-III (conferring resistance to several aminoglycosides, including neomycin and gentamicin B), ermB, and tetM. As shown in Fig. 2, this strain (the fifth strain from the top of clade A2) is closely related to the clade A1 branch point and presumably the clade A1 founder.
Other resistances exhibit clear clade specificity (Fig. 5; see Table S3 in the supplemental material). Vancomycin resistance is completely absent from clade B. Vancomycin resistance occurs mainly in clade A1 but also occurs in clade A2. Aminoglycoside resistance genes ant(6')-la and aph(3′)-III are completely absent from clade B strains, but they occur in most clade A1 isolates. Interestingly, in clade B, the msrC resistance gene correlates perfectly with the presence of a CRISPR element. We have not found prior mention of the occurrence of several resistance genes in E. faecium, including the aadD cassette, which confers resistance to tobramycin and kanamycin, in a single genome (strain EnGen0035). We also observed genes lnuB, ermG, and ermT (that likely confer various degrees of resistance to the macrolides-lincosamides-streptogramin B [MLS] class of antibiotics), tetC (conferring resistance to tetracycline), and fosB (conferring resistance to fosfomycin) in E. faecium.
Clade structure is reflected in E. faecium genome organization.
The Aus0004 genome possesses a previously identified 683-kb inversion around the replication termination site (17). Similar inversions appear to have occurred several times independently (since boundaries were not strictly identical) in strains of clades A1 and A2 (i.e., in strains EnGen0007 and EnGen0025), but not in strains of clade B (see Fig. S6 in the supplemental material). This inversion is bounded by different phages in different strains, and it appears that the recombination responsible for this rearrangement occurred within the phage sequence. Larger inversions in other areas of clade A1 and A2 genomes were also observed, including a 1.2-Mbp inversion in both EnGen0046 and EnGen0049, and again appear to be driven by recombination within phages present at the boundaries. Most genome rearrangements observed in E. faecium can be linked to the occurrence of mobile genetic elements at the boundaries. Select novel rearrangements were arbitrarily verified by PCR, and the accuracy of assembly was verified in each case.
In addition to mediating inversions and recombinations, introduction and proliferation of IS elements in a bacterial population can facilitate adaptation to new niches as the result of obsolete gene inactivation (1). We identified 133 instances of IS element-mediated gene inactivation in E. faecium (see Table S4 in the supplemental material). The number of IS-mediated gene inactivation events was highest in clade A1 genomes and lowest in clade B strains. In clade A1 strains, we found a strong enrichment for disruption of a core gene encoding a putative major facilitator superfamily (MFS) transporter (EFAU004_02447 in strain AUS0004) (Table S4).
Since compromised defense was associated with the evolution of hospital epidemic strains of E. faecalis (25), it was of interest to examine more closely the relationship between the presence of a CRISPR-Cas system and mobile element content. We therefore examined the 73 E. faecium genome sequences studied for the presence of CRISPR-cas using CRISPRfinder (39). Only 7 E. faecium genomes carried cas genes (Fig. 5), and in 5 of these (strains Com12, EnGen0002, EnGen0056, 1_141_733, and 1_231_408), a CRISPR array could be readily identified immediately downstream. In strains 1_231_408 and EnGen0056, where spacers could be matched to known genes, one was derived from a phage that is a common lysogen in E. faecium genomes (present in 39 out of 73 genomes). Interestingly, this phage is absent from these 2 genomes, suggesting CRISPR-Cas functionality. Notably, all strains that carry cas genes are either found in a distinct subgroup within clade B or are hybrid strains 1_231_408 and EnGen0002 that acquired the cas genes and its associated CRISPR-locus from the clade B parent (see Fig. S4 in the supplemental material). Apart from the CRISPR defense, we observed a gene encoding a putative type IV methyl-directed restriction enzyme in strains of both clade B and A2, but not in clade A1 genomes (Fig. 5).
Evidence of varying selection in genomes from each clade.
We examined polymorphisms in shared genes to detect genes under particularly strong selection in the different habitats occupied by strains of each clade. Because of the clade structure, we used a tree-based approach (40) to compare the ratios of nonsynonymous to synonymous base changes (dN/dS ratio). We removed potentially confounding (41) recombined fragments using BRATNextGen (21). Genes under positive selection were identified when the dN/dS ratio in the clade of interest (foreground) was observed to be significantly higher than the dN/dS ratio in the comparator genomes (background) (see Table S4B in the supplemental material). No genes were found to be under positive selection in clade B compared to clades A, A1, and A2, likely reflecting the fact that clade B strains had long-fixed beneficial mutations in this particular niche before the emergence of the A clade. Only four genes were found to be under differential positive selection pressure in clade A compared to clade B, two of which were annotated as having roles in amino acid transport and metabolism (Table S4B). Interestingly, in strains of the hospital-adapted clade A1, a penicillin binding protein transpeptidase and the d-alanyl-d-alanine ligase were under differential positive selection compared to strains of both clades A2 and clade B (Table S4B). Finally, an MFS transporter involved in carbohydrate transport and metabolism in clade A1 and an N-acetylglucosamine transferase in clade A2 were found to be under positive selection pressure, providing independent support for the importance of differential carbohydrate utilization as a determinant of clade structure, as inferred from gene gain/loss patterns described above.
DISCUSSION
Speciation results from expansion into new ecological niches and subsequent isolation from the founder population (42) and is accompanied by changes in the genome stemming from mutation, recombination (43), and horizontal gene transfer (44). All of these processes have contributed to the current population structure of E. faecium and its emergence as a leading multidrug-resistant hospital pathogen.
Quantification of mutation rates for strains in each E. faecium clade allowed us to estimate that the first bifurcation in the E. faecium population took place approximately 3,000 years ago, substantially sooner than previously suggested (16). Although it is difficult to know the ecological drivers of this split with precision, the timing suggests that it relates to increasing insulation between the flora of humans and animals, which likely stemmed from increased urbanization, increased domestication of animals providing restricted and specialized diets (45, 46), and increasing use of hygienic measures (47, 48). This bifurcation was associated with a wholesale loss and replacement of carbohydrate utilization pathways, mediated largely by acquisition on mobile elements by strains of clade A. Many of the clade B pathways lost by clade A strains relate to the utilization of complex carbohydrates from dietary sources, and the pathways lost were replaced by pathways on mobile elements associated with the utilization of amino sugars, such as those occurring on epithelial cell surfaces and in mucin, suggesting a possible shift from a lifestyle dependent mainly on host diet (clade B) to one increasingly dependent on host secretions (clade A). In addition to carbohydrate utilization pathways, there was a substantial shift in genes encoding Mga-type helix-turn-helix regulators, which in Streptococcus pyogenes connect expression of niche-specific genes with carbohydrate metabolism (33).
The second split in the E. faecium population, the split between clade A1 and clade A2, appears to have occurred approximately 75 years ago, coinciding precisely with the introduction of antibiotics in both clinical medicine and agriculture. However, this split may not have been directly driven by the usage of antibiotics, as antibiotics are used both in farming and in human medicine. The ability to rapidly acquire new traits on mobile elements, including carbohydrate utilization pathways as well as resistance to antibiotics, appears to be an intrinsic trait of clade A1 and clade A2. Although clade A1 strains now cause the vast majority of infections (Fig. 2), early clinical isolates from the 1950s and 1960s do not cluster in clade A1. The earliest isolation of a strain associated with an MLST type occurring in clade A1, occurred in 1982 (49). That isolate already possessed high-level resistance to gentamicin and carried the esp gene.
Interestingly, we found that the recently emergent hospital-adapted clade A1 is hypermutable, as reflected in the inferred rate of mutation in the genomes, and experimentally. Hypermutation in Gram-negative bacteria has been linked to the emergence of antibiotic-resistant lineages that are pathogenic to humans (50–52). In Gram-positive bacteria, hypermutating populations of pathogenic Streptococcus pneumoniae and Staphylococcus aureus have been observed (53, 54). In E. faecium, polymorphisms in mutS and mutL (which encode DNA mismatch repair proteins) have been noted (55), but the polymorphisms are not associated with differential mutation rates in different clades. Higher mutation rates have been associated with microbes recently experiencing a host switch (e.g., Mycoplasma gallisepticum, 0.8 × 10⁻⁵ to 1.2 × 10⁻⁵ substitutions per site per year [61]) and with the emergence of pathogenic lineages (52), possibly including E. faecium strains of the CC17 genogroup (56). It appears that the epidemic hospital clade A1 emerged because of its ability to acquire mobile elements, its ability to utilize carbohydrates of nondietary origin, and its hypermutability.
Previously, the average nucleotide identity of eight E. faecium strains was determined to range between 93.5 and 95.6% when comparing strains from clades A and B (13), and clade A and B strains would be considered to be distinct species by existing criteria (57, 58). The identification of hybrid clade A1/B strains (strains EnGen0002 and 1_231_408) show that the ecological niches of human-infecting hospital strains and human commensal strains do occasionally overlap. The emergence of the distinct clade structure in E. faecium parallels anthropogenic changes in urbanization and animal domestication and, more recently, the introduction of antibiotics into agriculture and medicine. The net effect of these forces is the emergence of a rapidly evolving lineage, which has crossed a degree of divergence usually associated with speciation.
MATERIALS AND METHODS
Bacterial strains.
Strains selected for genome analysis were drawn from those representing diverse points within the known phylogenic structure, as determined by MLST (Fig. 1), and are listed in Table S1 in the supplemental material. DNA was purified from each E. faecium strain as described before (13) for DNA sequence analysis. Methods for DNA sequencing, genome assembly, and bioinformatic analysis are provided in Supplemental Methods at https://olive.broadinstitute.org/projects/work_package_1/downloads, along with details of the genome sequences.
SUPPLEMENTAL MATERIAL
Diversity in isolation site of E. faecium strains (A), geographical origins (B), and isolation date of the 73 genomes studied (C). Download
Strain relationships based on the pattern of gene presence and absence. The presence (green line) or absence (black line) of each gene was determined across each of the E. faecium genomes. Red lines represent orphan genes that are unique to one genome among the population sampled. Clade B strain names are listed in blue, and clade A1 and A2 strain names are listed in red and gray, respectively. The strains were then clustered based on similarity in gene content. Download
Cluster analysis based on the pairwise syntenic conservation among 60 E. faecium genomes, represented as a heat map. Low synteny between two genomes is shown in dark blue, whereas a high syntenic conservation is shown as light yellow. Thirteen genomes sequenced elsewhere (C68, E980, E1039, E1071, E1162, E1636, E1679, U0317, E4452, E4453, TC6, D344SRF, and LCT-EF90) were excluded from this analysis due to severely fragmented assemblies. Clade B strains are listed in blue, and clade A1 and A2 strains are listed in red and gray, respectively. Download
CIRCOS plot of representative E. faecium genomes. The reference genome EnGen0033 (clade B), chosen for its low scaffold count (n = 7), is not shown except to illustrate scaffold organization (white blocks numbered from 1 to 7). The presence or absence of genes for other strains, compared to this reference genome, is then illustrated. Blue tracks represent genes derived from clade B genomes, and red tracks represent genes derived from clade A genomes. An orange arrow shows the location of the CRISPR locus. The two recombined strains, 1_231_408 and EnGen0002, are hybrid and have acquired large blocks of clade B genes (highlighted in purple and green next to the scale) that include the CRISPR immunity element. Download
(A) Pan-genome model with power law regression using medians for E. faecium genomes. The medians of the number n of new genes discovered for increasing values of the number N of genomes sequenced, normalized to the average genome size of the species, are displayed. Solid curves show the power law n = k N−α least-squares fit to data for n > 3, weighted for the 25 to 75 percentile interval. (B) Comparison of the plasticity of E. faecium genomes with other bacterial species. The α value obtained in the presented pan-genome model for E. faecium (0.69) is compared to the α values obtained by a similar analysis of the genomes of other bacterial species by Tettelin et al. (59). Download
Whole-genome Mauve alignment showing synteny between 19 representative E. faecium genomes rendered using GenoPlotR. Phage genes were predicted using PHAST, and all regions identified were blasted against all genomes to map all potential phage elements (red). The region of strain Aus0004 included within a known large inversion (17) was also compared to all other genomes by BLAST, and any hit of 4 kb or larger is shown (blue). The coloring of syntenic sequence blocks was converted to gray-scale, so that only large regions of rearrangement are visible in the contrasting gray to black blocks that are rendered above (positive strand) or below (minus strand) each genome backbone. Pairwise alignment blocks between genomes are rendered as light gray trapezoidal (same strand) or black trapezoidal (opposite strand) projections. Download
Metadata information on E. faecium strains studied.
Gene enrichment analysis.
Antibiotic resistance genes in E. faecium genomes.
Mutations in shared genes. (A) Genes disrupted by the insertion of IS elements; (B) dN/dS ratios of core genes under differential positive selection in E. faecium clades.
ACKNOWLEDGMENTS
This project was funded in part by the National Institute of Allergy and Infectious Diseases, National Institutes of Health, Department of Health and Human Services, under contract HHSN272200900018C. Portions of this work were also supported by NIH/NIAID grants AI083214 (Harvard-wide Program on Antibiotic Resistance), and AI072360. W.V.S. and R.J.L.W. were supported by the European Union Seventh Framework Programme (FP7-HEALTH-2011-single-stage) “Evolution and Transfer of Antibiotic Resistance” (EvoTAR) under grant agreement number 282004.
We acknowledge Lucia Alvarado and Clint Howarth for data submissions, Susanna Hamilton and Sinead Chapman for project management, Chris Desjardins for helpful discussions, and Matthew Laird for help with IslandViewer.
Footnotes
Citation Lebreton F, van Schaik W, Manson McGuire A, Godfrey P, Griggs A, Mazumdar V, Corander J, Cheng L, Saif S, Young S, Zeng Q, Wortman J, Birren B, Willems RJL, Earl AM, Gilmore MS. 2013. Emergence of epidemic multidrug-resistant Enterococcus faecium from animal and commensal strains. mBio 4(4):e00534-13. doi:10.1128/mBio.00534-13.
ADDENDUM IN PROOF
Following submission we were made aware that others recently described a split, between human and bovine populations of S. aureus, datable by BEAST analysis, to approximately 5,000 years ago (L. A. Weinert, J. J. Welch, M. A. Suchard, P. Lemey, A. Rambaut, and J. R. Fitzgerald, Biol Lett. 8:829-832, 2012).
REFERENCES
- 1. Gilmore MS, Lebreton F, van Schaik W. 2013. Genomic transition of enterococci from gut commensals to leading causes of multidrug-resistant hospital infection in the antibiotic era. Curr. Opin. Microbiol. 16:10–16 [DOI] [PMC free article] [PubMed] [Google Scholar]
- 2. McKinnell JA, Kunz DF, Chamot E, Patel M, Shirley RM, Moser SA, Baddley JW, Pappas PG, Miller LG. 2012. Association between vancomycin-resistant enterococci bacteremia and ceftriaxone usage. Infect. Control Hosp. Epidemiol. 33:718–724 [DOI] [PMC free article] [PubMed] [Google Scholar]
- 3. Arias CA, Murray BE. 2008. Emergence and management of drug-resistant enterococcal infections. Expert Rev. Anti Infect. Ther. 6:637–655 [DOI] [PubMed] [Google Scholar]
- 4. Smillie CS, Smith MB, Friedman J, Cordero OX, David LA, Alm EJ. 2011. Ecology drives a global network of gene exchange connecting the human microbiome. Nature 480:241–244 [DOI] [PubMed] [Google Scholar]
- 5. Harrison EM, Paterson GK, Holden MTG, Larsen J, Stegger M, Larsen AR, Petersen A, Skov RL, Christensen JM, Bak Zeuthen A, Heltberg O, Harris SR, Zadoks RN, Parkhill J, Peacock SJ, Holmes MA. 2013. Whole genome sequencing identifies zoonotic transmission of MRSA isolates with the novel mecA homologue mecC. EMBO Mol. Med. 5:509–515 [DOI] [PMC free article] [PubMed] [Google Scholar]
- 6. Price LB, Stegger M, Hasman H, Aziz M, Larsen J, Andersen PS, Pearson T, Waters AE, Foster JT, Schupp J, Gillece J, Driebe E, Liu CM, Springer B, Zdovc I, Battisti A, Franco A, Zmudzki J, Schwarz S, Butaye P, Jouy E, Pomba C, Porrero MC, Ruimy R, Smith TC, Robinson DA, Weese JS, Arriola CS, Yu F, Laurent F, Keim P, Skov R, Aarestrup FM. 2012. Staphylococcus aureus CC398: host adaptation and emergence of methicillin resistance in livestock. mBio 3(1):e00305-11. [DOI] [PMC free article] [PubMed] [Google Scholar]
- 7. Acar J, Casewell M, Freeman J, Friis C, Goossens H. 2000. Avoparcin and virginiamycin as animal growth promoters: a plea for science in decision-making. Clin. Microbiol. Infect. 6:477–482 [DOI] [PubMed] [Google Scholar]
- 8. Collignon PJ. 1999. Vancomycin-resistant enterococci and use of avoparcin in animal feed: is there a link? Med. J. Aust. 171:144–146 [DOI] [PubMed] [Google Scholar]
- 9. Bager F, Madsen M, Christensen J, Aarestrup FM. 1997. Avoparcin used as a growth promoter is associated with the occurrence of vancomycin-resistant Enterococcus faecium on Danish poultry and pig farms. Prev. Vet. Med. 31:95–112 [DOI] [PubMed] [Google Scholar]
- 10. Lauderdale TL, Shiau YR, Wang HY, Lai JF, Huang IW, Chen PC, Chen HY, Lai SS, Liu YF, Ho M. 2007. Effect of banning vancomycin analogue avoparcin on vancomycin-resistant enterococci in chicken farms in Taiwan. Environ. Microbiol. 9:819–823 [DOI] [PubMed] [Google Scholar]
- 11. Willems RJL, Top J, van Santen M, Robinson DA, Coque TM, Baquero F, Grundmann H, Bonten MJM. 2005. Global spread of vancomycin-resistant Enterococcus faecium from distinct nosocomial genetic complex. Emerg. Infect. Dis. 11:821–828 [DOI] [PMC free article] [PubMed] [Google Scholar]
- 12. Kos VN, Desjardins CA, Griggs A, Cerqueira G, Van Tonder A, Holden MTG, Godfrey P, Palmer KL, Bodi K, Mongodin EF, Wortman J, Feldgarden M, Lawley T, Gill SR, Haas BJ, Birren B, Gilmore MS. 2012. Comparative genomics of vancomycin-resistant Staphylococcus aureus strains and their positions within the clade most commonly associated with methicillin-resistant S. aureus hospital-acquired infection in the United States. mBio 3(3):e00112-12. [DOI] [PMC free article] [PubMed] [Google Scholar]
- 13. Palmer KL, Godfrey P, Griggs A, Kos VN, Zucker J, Desjardins C, Cerqueira G, Gevers D, Walker S, Wortman J, Feldgarden M, Haas B, Birren B, Gilmore MS. 2012. Comparative genomics of enterococci: variation in Enterococcus faecalis, clade structure in E. faecium, and defining characteristics of E. gallinarum and E. casseliflavus. mBio 3(1):e00318-11. [DOI] [PMC free article] [PubMed] [Google Scholar]
- 14. Willems RJL, Top J, van Schaik W, Leavis H, Bonten M, Sirén J, Hanage WP, Corander J. 2012. Restricted gene flow among hospital subpopulations of Enterococcus faecium. mBio 3(4):e00151-12. [DOI] [PMC free article] [PubMed] [Google Scholar]
- 15. van Schaik W, Top J, Riley DR, Boekhorst J, Vrijenhoek JEP, Schapendonk CME, Hendrickx APA, Nijman IJ, Bonten MJM, Tettelin H, Willems RJL. 2010. Pyrosequencing-based comparative genome analysis of the nosocomial pathogen Enterococcus faecium and identification of a large transferable pathogenicity island. BMC Genomics 11:239. [DOI] [PMC free article] [PubMed] [Google Scholar]
- 16. Galloway-Peña J, Roh JH, Latorre M, Qin X, Murray BE. 2012. Genomic and SNP analyses demonstrate a distant separation of the hospital and community-associated clades of Enterococcus faecium. PLoS One 7:e30187. 10.1371/journal.pone.0030187 [DOI] [PMC free article] [PubMed] [Google Scholar]
- 17. Lam MMC, Seemann T, Bulach DM, Gladman SL, Chen H, Haring V, Moore RJ, Ballard S, Grayson ML, Johnson PDR, Howden BP, Stinear TP. 2012. Comparative analysis of the first complete Enterococcus faecium genome. J. Bacteriol. 194:2334–2341 [DOI] [PMC free article] [PubMed] [Google Scholar]
- 18. Willems RJ, van Schaik W. 2009. Transition of Enterococcus faecium from commensal organism to nosocomial pathogen. Future Microbiol. 4:1125–1135 [DOI] [PubMed] [Google Scholar]
- 19. De Regt MJA, van Schaik W, van Luit-Asbroek M, Dekker HAT, van Duijkeren E, Koning CJM, Bonten MJM, Willems RJL. 2012. Hospital and community ampicillin-resistant Enterococcus faecium are evolutionarily closely linked but have diversified through niche adaptation. PLoS One 7:e30319. 10.1371/journal.pone.0030319 [DOI] [PMC free article] [PubMed] [Google Scholar]
- 20. Drummond AJ, Suchard MA, Xie D, Rambaut A. 2012. Bayesian phylogenetics with BEAUti and the BEAST 1.7. Mol. Biol. Evol. 29:1969–1973 [DOI] [PMC free article] [PubMed] [Google Scholar]
- 21. Marttinen P, Hanage WP, Croucher NJ, Connor TR, Harris SR, Bentley SD, Corander J. 2012. Detection of recombination events in bacterial genomes from large population samples. Nucleic Acids Res. 40:e6. 10.1093/nar/gkr928 [DOI] [PMC free article] [PubMed] [Google Scholar]
- 22. Holden MTG, Hsu LY, Kurt K, Weinert LA, Mather AE, Harris SR, Strommenger B, Layer F, Witte W, de Lencastre H, Skov R, Westh H, Zemlicková H, Coombs G, Kearns AM, Hill RLR, Edgeworth J, Gould I, Gant V, Cooke J, Edwards GF, McAdam PR, Templeton KE, McCann A, Zhou Z, Castillo-Ramírez S, Feil EJ, Hudson LO, Enright MC, Balloux F, Aanensen DM, Spratt BG, Fitzgerald JR, Parkhill J, Achtman M, Bentley SD, Nübel U. 2013. A genomic portrait of the emergence, evolution, and global spread of a methicillin-resistant Staphylococcus aureus pandemic. Genome Res. 23:653–664 [DOI] [PMC free article] [PubMed] [Google Scholar]
- 23. Nübel U, Dordel J, Kurt K, Strommenger B, Westh H, Shukla SK, Žemličková H, Leblois R, Wirth T, Jombart T, Balloux F, Witte W. 2010. A timescale for evolution, population expansion, and spatial spread of an emerging clone of methicillin-resistant Staphylococcus aureus. PLoS Pathog. 6:e1000855. 10.1371/journal.ppat.1000855 [DOI] [PMC free article] [PubMed] [Google Scholar]
- 24. Dagan T, Martin W. 2007. Ancestral genome sizes specify the minimum rate of lateral gene transfer during prokaryote evolution. Proc. Natl. Acad. Sci. USA 104:870–875 [DOI] [PMC free article] [PubMed] [Google Scholar]
- 25. Palmer KL, Gilmore MS. 2010. Multidrug-resistant enterococci lack CRISPR-cas. mBio 1(4):e00227-10. [DOI] [PMC free article] [PubMed] [Google Scholar]
- 26. Zhou Y, Liang Y, Lynch KH, Dennis JJ, Wishart DS. 2011. PHAST: a fast phage search tool. Nucleic Acids Res. 39:W347–W352 [DOI] [PMC free article] [PubMed] [Google Scholar]
- 27. Waack S, Keller O, Asper R, Brodag T, Damm C, Fricke WF, Surovcik K, Meinicke P, Merkl R. 2006. Score-based prediction of genomic islands in prokaryotic genomes using hidden Markov models. BMC Bioinformatics 7:142. [DOI] [PMC free article] [PubMed] [Google Scholar]
- 28. Jensen LB, Garcia-Migura L, Valenzuela AJS, Løhr M, Hasman H, Aarestrup FM. 2010. A classification system for plasmids from enterococci and other Gram-positive bacteria. J. Microbiol. Methods 80:25–43 [DOI] [PubMed] [Google Scholar]
- 29. Kjos M, Borrero J, Opsata M, Birri DJ, Holo H, Cintas LM, Snipen L, Hernández PE, Nes IF, Diep DB. 2011. Target recognition, resistance, immunity and genome mining of class II bacteriocins from Gram-positive bacteria. Microbiology 157:3256–3267 [DOI] [PubMed] [Google Scholar]
- 30. Hendrickx APA, van Luit-Asbroek M, Schapendonk CME, van Wamel WJB, Braat JC, Wijnands LM, Bonten MJM, Willems RJL. 2009. SgrA, a nidogen-binding LPXTG surface adhesin implicated in biofilm formation, and EcbA, a collagen binding MSCRAMM, are two novel adhesins of hospital-acquired Enterococcus faecium. Infect. Immun. 77:5097–5106 [DOI] [PMC free article] [PubMed] [Google Scholar]
- 31. Dussurget O, Cabanes D, Dehoux P, Lecuit M, Buchrieser C, Glaser P, Cossart P, European, Listeria Genome Consortium 2002. Listeria monocytogenes bile salt hydrolase is a PrfA-regulated virulence factor involved in the intestinal and hepatic phases of listeriosis. Mol. Microbiol. 45:1095–1106 [DOI] [PubMed] [Google Scholar]
- 32. Novick RP, Geisinger E. 2008. Quorum sensing in staphylococci. Annu. Rev. Genet. 42:541–564 [DOI] [PubMed] [Google Scholar]
- 33. Hondorp ER, McIver KS. 2007. The Mga virulence regulon: infection where the grass is greener. Mol. Microbiol. 66:1056–1065 [DOI] [PubMed] [Google Scholar]
- 34. Simeone R, Bottai D, Brosch R. 2009. ESX/type VII secretion systems and their role in host-pathogen interaction. Curr. Opin. Microbiol. 12:4–10 [DOI] [PubMed] [Google Scholar]
- 35. Chen YH, Anderson M, Hendrickx APA, Missiakas D. 2012. Characterization of EssB, a protein required for secretion of ESAT-6 like proteins in Staphylococcus aureus. BMC Microbiol. 12:219. [DOI] [PMC free article] [PubMed] [Google Scholar]
- 36. Zhang X, Top J, de Been M, Bierschenk D, Rogers M, Leendertse M, Bonten MJ, van der Poll T, Willems RJ, van Schaik W. 2013. Identification of a genetic determinant in clinical Enterococcus faecium strains that contributes to intestinal colonization during antibiotic treatment. J. Infect. Dis. 207:1780–1786 [DOI] [PubMed] [Google Scholar]
- 37. Costa Y, Galimand M, Leclercq R, Duval J, Courvalin P. 1993. Characterization of the chromosomal aac(6′)-Ii gene specific for Enterococcus faecium. Antimicrob. Agents Chemother. 37:1896–1903 [DOI] [PMC free article] [PubMed] [Google Scholar]
- 38. Bywater R, McConville M, Phillips I, Shryock T. 2005. The susceptibility to growth-promoting antibiotics of Enterococcus faecium isolates from pigs and chickens in Europe. J. Antimicrob. Chemother. 56:538–543 [DOI] [PubMed] [Google Scholar]
- 39. Grissa I, Vergnaud G, Pourcel C. 2007. CRISPRFinder: a web tool to identify clustered regularly interspaced short palindromic repeats. Nucleic Acids Res. 35:W52–W57 [DOI] [PMC free article] [PubMed] [Google Scholar]
- 40. Stamatakis A. 2006. RAxML-VI-HPC: maximum likelihood-based phylogenetic analyses with thousands of taxa and mixed models. Bioinformatics 22:2688–2690 [DOI] [PubMed] [Google Scholar]
- 41. Anisimova M, Nielsen R, Yang Z. 2003. Effect of recombination on the accuracy of the likelihood method for detecting positive selection at amino acid sites. Genetics 164:1229–1236 [DOI] [PMC free article] [PubMed] [Google Scholar]
- 42. Cohan FM. 2001. Bacterial species and speciation. Syst. Biol. 50:513–524 [DOI] [PubMed] [Google Scholar]
- 43. Fraser C, Hanage WP, Spratt BG. 2007. Recombination and the nature of bacterial speciation. Science 315:476–480 [DOI] [PMC free article] [PubMed] [Google Scholar]
- 44. Wiedenbeck J, Cohan FM. 2011. Origins of bacterial diversity through horizontal genetic transfer and adaptation to new ecological niches. FEMS Microbiol. Rev. 35:957–976 [DOI] [PubMed] [Google Scholar]
- 45. Petroutsa EI, Manolis SK. 2010. Reconstructing Late Bronze Age diet in mainland Greece using stable isotope analysis. J. Archaeol. Sci. 37:614–620 [Google Scholar]
- 46. Jay M, Richards MP. 2006. Diet in the Iron Age cemetery population at Wetwang Slack, East Yorkshire, UK: carbon and nitrogen stable isotope evidence. J. Archaeol. Sci. 33:653–662 [Google Scholar]
- 47. McEvedy C, Jones R. 1978. Atlas of world population history. Penguin Books, Middlesex, United Kingdom [Google Scholar]
- 48. Osborne R, Cunliffe B. 2005. Mediterranean urbanization 800–600 BC. Oxford University Press, Oxford, United Kingdom [Google Scholar]
- 49. Galloway-Peña JR, Nallapareddy SR, Arias CA, Eliopoulos GM, Murray BE. 2009. Analysis of clonality and antibiotic resistance among early clinical isolates of Enterococcus faecium in the United States. J. Infect. Dis. 200:1566–1573 [DOI] [PMC free article] [PubMed] [Google Scholar]
- 50. LeClerc JE, Li B, Payne WL, Cebula TA. 1996. High mutation frequencies among Escherichia coli and Salmonella pathogens. Science 274:1208–1211 [DOI] [PubMed] [Google Scholar]
- 51. Jolivet-Gougeon A, Kovacs B, Le Gall-David S, Le Bars H, Bousarghin L, Bonnaure-Mallet M, Lobel B, Guillé F, Soussy CJ, Tenke P. 2011. Bacterial hypermutation: clinical implications. J. Med. Microbiol. 60:563–573 [DOI] [PubMed] [Google Scholar]
- 52. Maciá MD, Blanquer D, Togores B, Sauleda J, Pérez JL, Oliver A. 2005. Hypermutation is a key factor in development of multiple-antimicrobial resistance in Pseudomonas aeruginosa strains causing chronic lung infections. Antimicrob. Agents Chemother. 49:3382–3386 [DOI] [PMC free article] [PubMed] [Google Scholar]
- 53. del Campo R, Morosini MI, de la Pedrosa EG, Fenoll A, Muñoz-Almagro C, Máiz L, Baquero F, Cantón R, Spanish, Pneumococcal Infection Study Network 2005. Population structure, antimicrobial resistance, and mutation frequencies of Streptococcus pneumoniae isolates from cystic fibrosis patients. J. Clin. Microbiol. 43:2207–2214 [DOI] [PMC free article] [PubMed] [Google Scholar]
- 54. Prunier AL, Malbruny B, Laurans M, Brouard J, Duhamel JF, Leclercq R. 2003. High rate of macrolide resistance in Staphylococcus aureus strains from patients with cystic fibrosis reveals high proportions of hypermutable strains. J. Infect. Dis. 187:1709–1716 [DOI] [PubMed] [Google Scholar]
- 55. Willems RJ, Top J, Smith DJ, Roper DI, North SE, Woodford N. 2003. Mutations in the DNA mismatch repair proteins MutS and MutL of oxazolidinone-resistant or -susceptible Enterococcus faecium. Antimicrob. Agents Chemother. 47:3061–3066 [DOI] [PMC free article] [PubMed] [Google Scholar]
- 56. Ruiz-Garbajosa P, Top J, Coque TM, Cantón R, Bonten MJ, Baquero F, Willems RJ. 2008. Abstr. 18th Eur. Cong Clin Microbiol. Infect. Dis., abstr. P2043 [DOI] [PubMed]
- 57. Goris J, Konstantinidis KT, Klappenbach JA, Coenye T, Vandamme P, Tiedje JM. 2007. DNA-DNA hybridization values and their relationship to whole-genome sequence similarities. Int. J. Syst. Evol. Microbiol. 57:81–91 [DOI] [PubMed] [Google Scholar]
- 58. Konstantinidis KT, Tiedje JM. 2005. Genomic insights that advance the species definition for prokaryotes. Proc. Natl. Acad. Sci. U. S. A. 102:2567–2572 [DOI] [PMC free article] [PubMed] [Google Scholar]
- 59. Tettelin H, Riley D, Cattuto C, Medini D. 2008. Comparative genomics: the bacterial pan-genome. Curr. Opin. Microbiol. 11:472–477 [DOI] [PubMed] [Google Scholar]
- 60. Chang D, Zhu Y, Zou Y, Fang X, Li T, Wang J, Guo Y, Su L, Xia J, Yang R, Fang C, Liu C. 2012. Draft genome sequence of Enterococcus faecium strain LCT-EF90. J. Bacteriol. 194:3556–3557 [DOI] [PMC free article] [PubMed] [Google Scholar]
- 61. Delaney NF, Balenger S, Bonneaud C, Marx CJ, Hill GE, Ferguson-Noel N, Tsai P, Rodrigo A, Edwards SV. 2012. Ultrafast evolution and loss of CRISPRs following a host shift in a novel wildlife pathogen, Mycoplasma gallisepticum. PLoS Genet. 8:e1002511 [DOI] [PMC free article] [PubMed] [Google Scholar]
Associated Data
This section collects any data citations, data availability statements, or supplementary materials included in this article.
Supplementary Materials
Diversity in isolation site of E. faecium strains (A), geographical origins (B), and isolation date of the 73 genomes studied (C). Download
Strain relationships based on the pattern of gene presence and absence. The presence (green line) or absence (black line) of each gene was determined across each of the E. faecium genomes. Red lines represent orphan genes that are unique to one genome among the population sampled. Clade B strain names are listed in blue, and clade A1 and A2 strain names are listed in red and gray, respectively. The strains were then clustered based on similarity in gene content. Download
Cluster analysis based on the pairwise syntenic conservation among 60 E. faecium genomes, represented as a heat map. Low synteny between two genomes is shown in dark blue, whereas a high syntenic conservation is shown as light yellow. Thirteen genomes sequenced elsewhere (C68, E980, E1039, E1071, E1162, E1636, E1679, U0317, E4452, E4453, TC6, D344SRF, and LCT-EF90) were excluded from this analysis due to severely fragmented assemblies. Clade B strains are listed in blue, and clade A1 and A2 strains are listed in red and gray, respectively. Download
CIRCOS plot of representative E. faecium genomes. The reference genome EnGen0033 (clade B), chosen for its low scaffold count (n = 7), is not shown except to illustrate scaffold organization (white blocks numbered from 1 to 7). The presence or absence of genes for other strains, compared to this reference genome, is then illustrated. Blue tracks represent genes derived from clade B genomes, and red tracks represent genes derived from clade A genomes. An orange arrow shows the location of the CRISPR locus. The two recombined strains, 1_231_408 and EnGen0002, are hybrid and have acquired large blocks of clade B genes (highlighted in purple and green next to the scale) that include the CRISPR immunity element. Download
(A) Pan-genome model with power law regression using medians for E. faecium genomes. The medians of the number n of new genes discovered for increasing values of the number N of genomes sequenced, normalized to the average genome size of the species, are displayed. Solid curves show the power law n = k N−α least-squares fit to data for n > 3, weighted for the 25 to 75 percentile interval. (B) Comparison of the plasticity of E. faecium genomes with other bacterial species. The α value obtained in the presented pan-genome model for E. faecium (0.69) is compared to the α values obtained by a similar analysis of the genomes of other bacterial species by Tettelin et al. (59). Download
Whole-genome Mauve alignment showing synteny between 19 representative E. faecium genomes rendered using GenoPlotR. Phage genes were predicted using PHAST, and all regions identified were blasted against all genomes to map all potential phage elements (red). The region of strain Aus0004 included within a known large inversion (17) was also compared to all other genomes by BLAST, and any hit of 4 kb or larger is shown (blue). The coloring of syntenic sequence blocks was converted to gray-scale, so that only large regions of rearrangement are visible in the contrasting gray to black blocks that are rendered above (positive strand) or below (minus strand) each genome backbone. Pairwise alignment blocks between genomes are rendered as light gray trapezoidal (same strand) or black trapezoidal (opposite strand) projections. Download
Metadata information on E. faecium strains studied.
Gene enrichment analysis.
Antibiotic resistance genes in E. faecium genomes.
Mutations in shared genes. (A) Genes disrupted by the insertion of IS elements; (B) dN/dS ratios of core genes under differential positive selection in E. faecium clades.