Abstract
Tumor cell survival relies upon adaptation to the acidic conditions of the tumor microenvironment. To investigate potential acidosis survival mechanisms, we examined the effect of low pH (6.7) on human breast carcinoma cells. Acute low pH exposure reduced proliferation rate, induced a G1 cell cycle arrest, and increased cytoplasmic vacuolization. Gene expression analysis revealed elevated levels of ATG5 and BNIP3 in acid-conditioned cells, suggesting cells exposed to low pH may utilize autophagy as a survival mechanism. In support of this hypothesis, we found that acute low pH stimulated autophagy as defined by an increase in LC3-positive punctate vesicles, double-membrane vacuoles, and decreased phosphorylation of AKT and ribosomal protein S6. Notably, cells exposed to low pH for approximately 3 months restored their proliferative capacity while maintaining the cytoplasmic vacuolated phenotype. Although autophagy is typically transient, elevated autophagy markers were maintained chronically in low pH conditioned cells as visualized by increased protein expression of LC3-II and double-membrane vacuoles. Furthermore, these cells exhibited elevated sensitivity to PI3K-class III inhibition by 3-methyladenine. In mouse tumors, LC3 expression was reduced by systemic treatment with sodium bicarbonate, which raises intratumoral pH. Taken together, these results argue that acidic conditions in the tumor microenvironment promote autophagy, and that chronic autophagy occurs as a survival adaptation in this setting.
Introduction
Cancer progression is a multistep process that is strongly influenced by the physical properties of the tumor microenvironment (1). Advanced solid tumors have regions of acute and chronic hypoxia that can induce and select for metabolic transformations in cells (2, 3). Cells exposed to chronic or intermittent hypoxia can transiently express a glycolytic phenotype, which can eventually become hard-wired even under aerobic conditions. A rapid rate of glycolysis coupled with poor tumor perfusion leads to acidification of the extracellular tumor microenvironment (2). Both hypoxia (3) and acidosis (4) can be cytotoxic. We have proposed that these conditions select for phenotypes that allow cancer cells to survive, proliferate, and eventually metastasize to secondary sites (1, 5).
Tumor cells colonized from early malignant lesions remain highly glycolytic even in oxygenated environments. Aerobic glycolysis was first described by Warburg in the 1920s (6). Positron emission tomography (PET) using 18fluorodeoxyglucose (FDG), a glucose analogue tracer, has shown that both primary and malignant lesions consume glucose at a high rate irrespective of oxygen status (7). We have proposed that maintenance of the glycolytic phenotype contributes to the ability of cancer cells to survive transient periods of hypoxia and low glucose (8). However, a consequence of elevated glycolysis at primary and secondary tumor sites is increased production of organic acids that reduce the pH of the extracellular microenvironment and surrounding stroma (11). Although periods of hypoxia can be transient (9, 10), acidification of the extracellular environment likely remains constant because of aerobic glycolysis, suggesting cellular adaptations must be acquired by tumor cells to survive chronic acidosis.
Survival mechanisms under acidic conditions are not well characterized. Extracellular acidosis has previously been shown to be mutagenic and clastogenic in vitro (11, 12) and also alters gene expression profiles (13), leading to phenotypes that are adapted for survival and growth in low pH conditions. We have previously described upregulation of the Na/H exchanger (NHE-1) in response to regional acidosis; this transporter may contribute to survival by maintaining intracellular pH (14). Identifying additional low pH survival mechanisms would give further insight into tumor progression and potentially introduce novel therapeutic strategies.
Macroautophagy, hereafter called autophagy, is an evolutionarily conserved catabolic process through which cytoplasmic proteins and organelles are self-digested, maintaining cellular metabolism through recycling of the degraded components (15). Low levels of autophagic activity are commonly observed under normal conditions, presumably preserving normal cellular homeostasis (16). However, extracellular stresses such as nutrient deprivation, reduced growth factors, and even hypoxia can transiently increase autophagic activity to promote tumor cell survival (17, 19).
Hypoxia-induced stress responses are well characterized. Hypoxia-inducible factors (HIFs) are transcription factors that control the expression of numerous genes known to regulate glucose uptake, angiogenesis, cell proliferation, apoptosis, and autophagy (17). HIF-1α has been shown to increase autophagy in a survival dependent manner by elevating the expression of BNIP3/BNIP3L, which disrupts the autophagy inhibitory complex of Bcl-2/Beclin1 (18). However, the downstream sequelae of hypoxia, acid pH, has been less well explored. Notably, low pH increases the stability and activity of BNIP3 in vitro (19).
In this work, we describe the induction of autophagy by low pH and propose that it provides an additional survival mechanism to acid stress. Moreover, this autophagic phenotype persists chronically, which has not been observed previously. MDA-MB-231 is a human breast cancer cell line that is highly invasive and metastatic both in vitro and in mouse models. We began by determining the effects of low pH (6.7) growth conditions on this cell line, which had presumably, before the isolation, adapted to the selective pressures of the tumor microenvironment in vivo. The experiments described herein were conducted under atmospheric oxygen so that all observations can be linked to acidosis and not confounded by oxygenation status. We observed elevated autophagic activity after acute and chronic exposure to acidosis thus promoting cell survival and continued proliferation similar to control cells. Pharmacological inhibition of autophagy resulted in reduced viability of cells grown at low pH. In vivo data showed spatial concordance between autophagic proteins and volumes expected to be acidic, and the expression of autophagic biomarkers was reversed with systemic buffers that can raise tumor pH. Although typically reported as an acute stress response, these data indicate that acid stress may lead to chronic maintenance of autophagy even during periods of adequate nutrient and oxygen supply.
Methods
Cell culture
MDA-MB-231 and HS766T cells were acquired from American Type Culture Collection (ATCC, Manassas, VA, 2007–2010) and were maintained in DMEM-F12 (Life Technologies) supplemented with 10% FBS (HyClone Laboratories). Growth medium was further supplemented with 25 mmol/L each of PIPES and HEPES and the pH adjusted to 7.4 or 6.7. Both cell lines were resuscitated from low passage with all experiments carried out with cells of passage number less than 28. Cells were monitored by microscopy and confirmed to maintain their original morphology. Cells were tested for mycoplasma contamination by ATTC. Unless otherwise noted, MDA-MB-231 cells were initially seeded in pH 7.4 medium before the transfer to pH 6.7 for transient experimental studies.
Development of low pH adapted cells
Cells were chronically cultured and passaged directly in pH 6.7 medium for approximately 3 months. Chronic low pH adapted MDA-MB-231 cells (MDA-MB-231/6.7ext) underwent 26 passages. MDA-MB-231/6.7ext cells had similar growth rates as control MDA-MB-231 cells.
Proliferation assay
Cells were either cultured at pH 7.4 or 6.7 for 72 hours. Cell number and viability were determined by trypan blue dye exclusion. MDA-MB-231/6.7ext cells were seeded directly in pH 6.7 medium and cell numbers were determined as previously described. The data represent the mean cell number ± SD of 3 independent experiments.
Immunofluorescence
Cells cultured at pH 7.4 or 6.7 for 48 hours were rinsed with PBS containing Ca2+/Mg2+, fixed in cold 100% methanol at −20°C and then blocked with 2% bovine serum albumin and 0.2% saponin in PBS. Samples were subsequently incubated with LC3 polyclonal primary antibody (1:50; Abgent) and secondary Alexa-Fluor 488 antirabbit (1:500) antibody. Nuclei were stained with 4′,6-diamidino-2-phenylindole (DAPI). Coverslips were mounted using ProLong Gold Antifade Reagent (Life Technologies) and images were captured with a Leica TCS SP5 (Leica) confocal microscope.
Transmission electron microscopy
Cells were cultured at pH 7.4 or 6.7 for 48 hours and MDA-MB-231/6.7ext cells were fixed and processed for transmission electron microscopy. Treated cells were fixed with 2.5% glutaraldehyde in 0.1M phosphate buffer overnight at 4°C. Fixed cells were scraped from the dishes, washed, and postfixed in 1% osmium tetroxide. After dehydration in a graded series of acetone, the cells were embedded in LX 112 epoxy resin. After polymerization of the resin, thin sections of the cells (80 nm) were cut on an ultramicrotome and stained with 8% uranyl acetate and Reynold’s lead citrate. The sections were examined and photographed on a transmission electron microscope (Morgagni 268D; FEI Company).
Western blot analysis
MDA-MB-231/7.4 cells were cultured at pH 6.7 for 24 to 72 hours, whereas MDA-MB-231/6.7ext cells were reintroduced to pH 7.4 medium for 24 to 48 hours. Lysates were collected using Insect Cell Lysis Buffer (554778; BD Biosciences) containing 1× protease inhibitor cocktail (P8340; Sigma-Aldrich). Twenty-five micrograms of protein per sample was separated on polyacrylamide-SDS gels and electrophoretically transferred to nitrocellulose. Membranes were incubated with primary antibodies against LC3 (1:2000, antirabbit; MBL International), ATG5 (1:2000, antirabbit; Cell Signaling Technology), BNIP3 (1:2000, antirabbit; Abgent), Carbonic Anhydrase IX (1:2000, antirabbit; Santa Cruz Bio.), phosphoribosomal protein S6 Ser235/236 (1:1000, antirabbit; Cell Signaling Technology), and GAPDH (1:4000, antirabbit; Santa Cruz Bio.).
Phospho-protein array
Cells cultured at pH 7.4 or 6.7 for 72 hours were lysed with 1× cell lysis buffer (9803; Cell Signaling Technology). The PathScan® RTK Signaling Antibody Array Kit (7949; Cell Signaling Technology) was used to simultaneously detect 28 receptor tyrosine kinases phosphorylated at tyrosine residues and 11 downstream signaling kinases phosphorylated at tyrosine/serine/threonine residues. Streptavidin-conjugated DyLight 680 was used to detect bound protein. Stained slides were fluorescently scanned using the Odyssey Li-Cor Infrared Imaging System (Li-Cor) and quantified using Odyssey V1.2 software.
Tumor development
Female nu/nu mice 6 to 8 weeks old (Charles River Laboratories) were inoculated with MDA-MB-231 cells (1 × 10⁷) in the mammary fat pads (MFP) or with HS766T cells (3 × 10⁶) subcutaneously into the flanks. MDA-MB-231 MFP and HS766T tumors reached a tumor volume of 500 and 1000 mm3 respectively, before the treatment with either tap water or 200 mmol/L NaHCO3 for 2 weeks. One hour before the removal, Pimonidazole hydrochloride was injected into the peritoneal cavity. Tumors were fixed in 10% formalin, paraffin embedded, and further processed for immunohistochemistry.
Pimonidazole hydrochloride
Pimonidazole hydrochloride (60 mg/kg; Hypoxyprobe Inc.) was injected into the peritoneal cavity 1 hour before tumor removal for detection of hypoxic tissue. Pimonidazole positive tissue was detected immunohistochemically with rabbit antisera against pimonidazole hydrochloride (2627; Hypoxyprobe Inc.).
Immunohistochemical staining
MDA-MB-231 MFP tumor cross-sections were stained with a rabbit primary antibody against LC3 (AP1802a; Abgent), a rabbit primary antibody against BNIP3 (AP1321a; Abcam), rabbit antisera against pimonidazole hydrochloride, a rabbit primary antibody against carbonic anhydrase 9 (AB15086; Abcam), and a rabbit primary antibody against Glut1 (AB15309; Abcam). HS766T tumor cross-sections were stained for LC3 expression. The Ventana OmniMap antirabbit secondary was used to detect primary antibodies. The detection system used was the Ventana ChromoMap kit and slides were then counterstained with Hematoxylin. Histology stained slides were scanned using the Aperio ScanScope XT.
Statistical analysis
A 2-tailed unpaired Student t test was employed to determine statistical significance. The significance level was set a P < 0.05.
Results
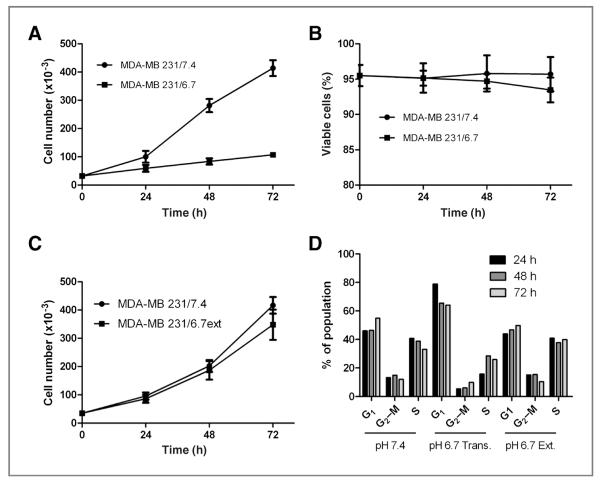
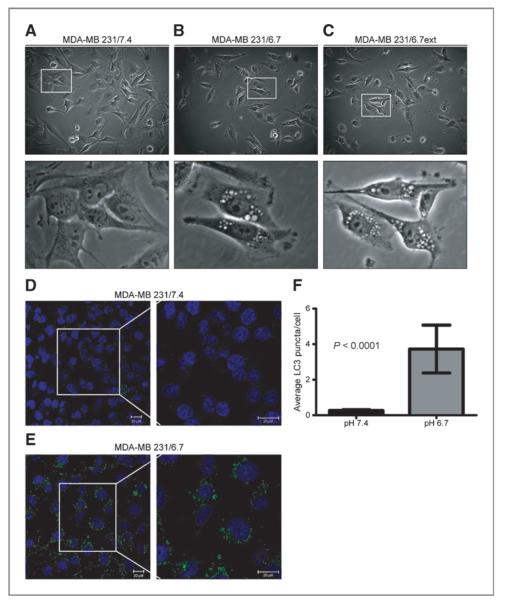
MDA-MB-231 cells maintained under normal growth conditions (MDA-MB-231/7.4) were exposed to pH 6.7 medium for 72 hours and their proliferation determined. Acute exposure to acidic medium reduced the proliferation of cells, hereafter referred to as MDA-MB-231/6.7 cells (Fig. 1A) with very little observable toxicity (Fig. 1B), suggesting a cytostatic response to extracellular acidosis. This was consistent with subsequent analysis via fluorescence-activated cell sorting (FACS): MDA-MB-231 cells grown in low pH media for 24 to 72 hours have an increased percentage of cells with G1 DNA content with fewer cells in S-phase when compared with MDA-MB-231/7.4 cells (Fig. 1D). There was also a lower percentage of cells with sub-G1 DNA content indicative of apoptosis (data not shown), which was consistent with the lack of observed cytotoxicity. In addition, one noticeable morphologic phenotype associated with growth in acidic medium was the presence of cytoplasmic vacuoles in a majority of MDA-MB-231/6.7 cells (Fig. 2B), which were absent in MDA-MB-231/7.4 cells (Fig. 2A).
Figure 1.
A and B, proliferation and viability of MDA-MB-231 cells cultured transiently at low pH (6.7) for 72 hours or (C) chronically at pH (6.7) for approximately 3 months were determined. Data represent the mean × SD of 3 independent experiments. D, cell-cycle profiles were also determined using FACS analysis. Data are representative of 3 independent experiments.
Figure 2.
Morphologic analysis of MDA-MB-231 cells cultured at pH 7.4 (A) or pH 6.7 for 48 hours (B) or for approximately 3 months (C). Subcellular localization of LC3 in MDA-MB-231 cells cultured at pH 7.4 (D) or pH 6.7 (E) for 48 hours. Images were captured by confocal microscopy and are representative of 3 independent experiments. Size bars = 20 μmol/L. F, the number of LC3 puncta was quantified using Definiens Developer XD. Data represent the average LC3 puncta per cell ± SD.
In parallel studies, 6 preinvasive breast cell lines were cultured at low pH for 72 hours, and their gene expression patterns were profiled using an Affymetrix platform (data available upon request). In 4 of 6 preinvasive breast cell lines, there was an observed increase in mRNA expression of ATG5, a critical autophagic regulatory protein involved in the early stages of autophagosome vesicle maturation (20). This suggested that low pH was inducing upregulation of the autophagic machinery. Additional analyses by quantitative real time reverse transcription polymerase chain reaction (real time RT-PCR) and Western blot revealed elevated ATG5 mRNA and protein expression in MDA-MB-231 cells cultured at pH 6.7 for 72 hours, as compared with those maintained at pH 7.4 (Fig. 3A and B). These same cell lysates showed increased mRNA and protein expression of BNIP3 (Fig. 3A and B), another proautophagic protein that has previously been shown to have increased stability and activity at low pH in vitro (19, 21).
Figure 3.
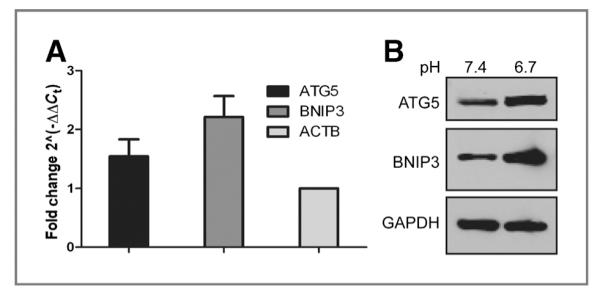
A, quantitative RT-PCR of ATG5 and BNIP3 mRNA expression in MDA-MB-231 cells cultured at pH 6.7 for 72 hours relative to cells cultured at pH 7.4. The fold change was calculated using β-actin as the internal control. The data represent the mean ± SD of 3 experiments. B, whole-cell lysates from MDA-MB-231 cells cultured at pH 7.4 or at pH 6.7 for 72 hours were analyzed for the expression of ATG5 and BNIP3.
Our observations of increased autophagy would be consistent with low pH being a metabolic stressor. Cells can respond to extrinsic stress either by activating cell survival pathways or initiation of cell death. The above data suggest that low pH induces a cytostatic response along with formation of cytoplasmic vacuoles. Together with the gene expression data, we hypothesized that these acid-induced vacuoles were autophagic and part of a catabolic process that is associated with stress-induced survival. The induction of autophagy can be observed by monitoring the subcellular localization of LC3, an autophagy regulatory protein that localizes to the inner membrane of autophagosomes (22). Few MDA-MB-231/7.4 cells had any detectable fluorescent punctate structures, representing basal autophagic activity (Fig. 2D). In contrast, cells grown at low pH for 48 hours exhibited both an increase in the number and signal intensity of LC3 positive punctate structures (P < 0.0001; Fig. 2E and F), consistent with the induction of autophagy.
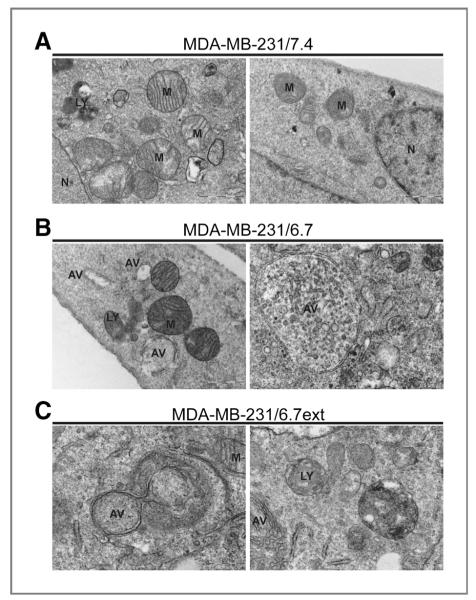
A more definitive technique to identify autophagy in mammalian cultures is transmission electron microscopy (TEM). Autophagophores are double-membrane vacuoles that are readily identifiable by TEM. MDA-MB-231/7.4 cells lacked noticeable double-membrane vacuoles; however, identifiable mitochondria (M) and lysosomes (LY) were present (Fig. 4A). MDA-MB-231 cells cultured in acidic conditions for 48 hours also contained recognizable mitochondria and lysosomes that were not noticeably different from those in the control cultures. In contrast, these MDA-MB-231/6.7 cells contained abundant and large autophagic vacuoles (AV; Fig. 4B). Some autophagic vacuoles (e.g., Fig. 4B) appeared to engulf numerous cellular components. These findings, along with the observation of increased LC3 positive punctate structures by immunocytochemistry are consistent with autophagy being induced at low pH.
Figure 4.
Transmission electron microscopy of double-membrane autophagic vacuoles in MDA-MB-231 cells cultured at pH 7.4 (A), pH 6.7 for 48 hours (B), or at low pH (6.7) for approximately 3 months (C). Autophagic vacuoles were detectable in MDA-MB-231 cells transiently or chronically exposed to pH 6.7. AV, autophagic vacuole; LY, lysosome; M, mitochondria; N, nucleus.
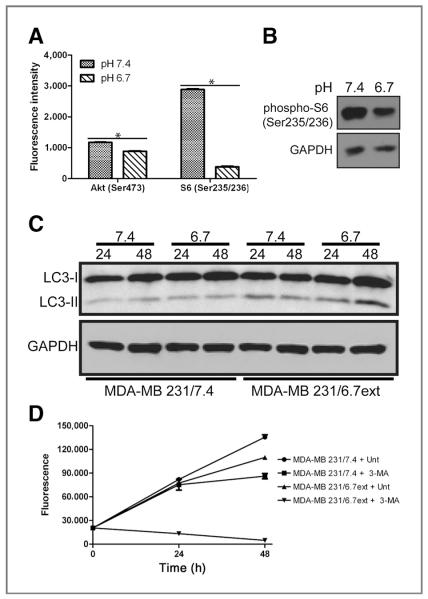
The PI3K/Akt/mTOR axis has been identified as a regulator of normal metabolic activity as well as a negative regulator of autophagic activity (23–25). To investigate this pathway in low pH cultured cells, lysates from MDA-MB-231 cells cultured at pH 7.4 or 6.7 for 72 hours were analyzed using a fluorescent-based phospho-protein array (see Materials and Methods). Significant decreases (P < 0.01) of phospho-Akt (Ser473; Fig. 5A) and phospho-ribosomal protein S6 (Ser235/236; Fig. 5A and B) were observed in response to low pH, suggesting that these phosphoproteins might be involved in transducing the effect of pH on autophagy in MDA-MB-231/6.7 cells. Significant changes to the phosphorylation of receptor kinases and other signaling proteins were not observed (Supplementary Fig. S1).
Figure 5.
A and B, whole-cell lysates from MDA-MB-231 cells cultured at pH 7.4 or at pH 6.7 for 72 hours were analyzed for expression of phospho-Akt (Ser473) and phospho-ribosomal protein S6 (Ser235/236) using a fluorescent-based phospho-protein array and by Western blot. C, whole-cell lysates from MDA-MB-231 cells cultured at pH 7.4 or at pH 6.7 for approximately 3 months were analyzed for the expression of the autophagy marker LC3-II. Elevated levels of LC3-II were observed in MDA-MB-231/6.7ext cells in comparison to MDA-MB-231/7.4 cells. D, cultures were treated with 10 mmol/L 3-methyladenine (3-MA) for 48 hours and CyQuant, a nonmetabolic indicator of viable cells, was used to determine cell number. The data represent the mean ± SD of 3 experiments.
Transient exposure to acidic conditions for 48 to 72 hours decreased cell proliferation, increased the percentage of cells with G1 DNA content, and increased markers of cell survival autophagy. However, human cancers are presumed to be chronically exposed to low pH. Thus, we subsequently inves- tigated the ability of MDA-MB-231 cells to adapt chronically to low pH growth conditions. MDA-MB-231 cells were cultured in pH 6.7 medium for 3 months before beginning analysis. In contrast to the initial studies of transient low pH exposure, the acid pH adapted cultures, MDA-MB-231/6.7ext, proliferated at rates comparable to those of the control MDA-MB-231/7.4 cultures (Fig. 1C) with no detectable loss of viability. Analysis of the cell cycle showed that MDA-MB-231/6.7ext cells no longer arrested in G1 and progressed through the cell cycle similarly to the control MDA-MB-231/7.4 cultures (Fig. 1D).
MDA-MB-231/6.7ext cells remained highly vacuolated (Fig. 2C), similar to the phenotype observed in MDA-MB-231/6.7 cells that were acutely exposed to low pH (cf. Fig. 2B). MDA-MB-231/6.7ext cells were analyzed to determine if chronic low pH adapted cells remain dependent on autophagy for survival. In these studies, we detected autophagophore biogenesis by monitoring the modification of LC3 via immunoblotting. LC3 is translated as a cytoplasmic precursor protein that is pro- cessed at the C-terminus, becoming LC3-I. LC3-I is further conjugated to phosphatidylethanolamine (PE) becoming a mature-membrane bound protein, LC3-II, localizing to the inner membrane of developing autophagophores. Increased expression of LC3-II is commonly used as an indicator for elevated levels of autophagy in mammalian cell models (26). MDA-MB-231/6.7ext cultures were incubated at pH 7.4 and pH 6.7 for 24 to 48 hours; samples were collected and analyzed by immunoblotting for LC3 expression (Fig. 5C). Elevated levels of LC3-II protein were observed in MDA-MB-231/6.7ext as compared with MDA-MB-231/7.4 samples. Notably, LC3-II expression remained elevated in the MDA-MB-231/6.7ext cells regardless of incubation pH, although the LC3-II levels were higher in the cells maintained at pH 6.7 compared with those that were returned to pH 7.4. This suggests that autophagy was chronically active in the low pH-adapted cultures and that it was not reversed, even when the cells were exposed to normal pH conditions for up to 48 hours. Consistent with this, the chronic low pH adapted cultures also contained autophagic vacuoles, as shown by TEM (Fig. 4C).
To test the need for autophagic activity in MDA-MB-231/6.7ext cells, their sensitivity to Class III PI3K (a kinase involved in autophagosome formation) inhibitor, 3-methyladenine (3-MA), was determined (Fig. 5D). Very little effect of 3-MA on MDA-MB-231/7.4 cell proliferation was observed following 24 hours of treatment, and a slight decrease in proliferation was observed by 48 hours. In contrast, 3-MA was potently cytotoxic in MDA-MB-231/6.7ext cultures as early as 24 hours, implying the importance of an autophagic response for prolonged survival in acidic growth conditions.
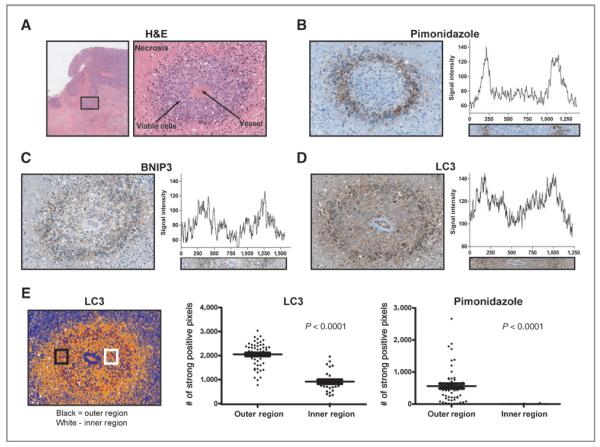
We subsequently investigated expression patterns of LC3 and BNIP3 in MDA-MB-231 MFP tumors to assess the in vivo relevance of the connection between low pH and autophagy (Fig. 6). Because a validated immunohistochemical biomarker for acidic tissue is not available, we used instead pimonidazole hydrochloride staining as a surrogate marker for hypoxic microenvironments that we expect to be acidic (27). Under low oxygen tensions, cells depend more on anaerobic glycolysis to meet energetic demands, known as the Pasteur effect. An end product of glycolysis is increased lactic acid and proton production leading to acidification of the local microenvironment (28). Low oxygenated tissue regions exposed to pimonidazole hydrochloride provide a snapshot of hypoxia present in the tumor for at least the 1 hour before tumor removal.
Figure 6.
Histologic analysis of in vivo LC3 expression in MDA-MB-231 MFP tumors. A, H&E staining of a representative region from an MDA-MB-231 tumor cross-section. A 20× magnification shows a single vessel encapsulated by viable cells (dark purple) surrounded further by necrotic tissue (pink). The same vascular region from sequential cross-sections was used for immunohistochemical analysis. B–D, pimonidazole hydrochloride was injected 1 hour before tumor removal to detect hypoxic tissue. Additional staining shows similar spatial expression patterns for BNIP-3 (C) and LC3 (D) to pimonidazole hydrochloride. E, positive pixel analysis of LC3 and pimonidazole hydrochloride in the outer region (black region) and inner region (white region) of a vascular cross-section using Aperio™ Positive Pixel Count v9 (blue, negative; yellow, weak positive; orange, positive; red, strong positive). Each region of interest is of the same size containing the same number of pixels. The number of strong positive pixels in the outer and inner region of 5 separate vascular cross-sections is plotted for LC3 and pimonidazole hydrochloride.
Figure 6A is a histological representation of an MDA-MB-231 MFP tumor cross-section with an inset containing a single patent vessel surrounded by viable cells, further encompassed by necrotic tissue. The same vascular region from 3 sequential tumor slices was stained for pimonidazole hydrochloride, BNIP3, and LC3 expression (Fig. 6B–D). A ring of pimonidazole hydrochloride positive cells formed a border between viable and necrotic tissue illustrating diffusion-limited hypoxia (Fig. 6B). This region is also expected to be acidic (29). Fitting with our hypothesis, cells with the highest expression level of LC3 and BNIP3 spatially corresponded with pimonidazole hydrochloride positive cells (Fig. 6C and D). Image analysis for signal intensity within a region of interest spanning the entirety of the vascular cross-section showed that all 3 targets had similar expression patterns (Fig. 6B–D). Additional positive pixel analysis of LC3 and pimonidazole hydrochloride expression in inner (viable tissue) and outer (low oxygen tension) regions show a significant increase of strong positive pixels for LC3 and pimonidazole hydrochloride in cells located within the outer region (Fig. 6E). To confirm a glycolytic phenotype is present in the pimonidazole hydrochloride positive regions, tumor cross-sections were stained for Glut1, a membrane-bound glucose transporter (Supplementary Fig. S2). Glut1 expression coincided well spatially with hypoxic regions as well as with LC3 implying a role for acidosis regulation of LC3 expression in vivo.
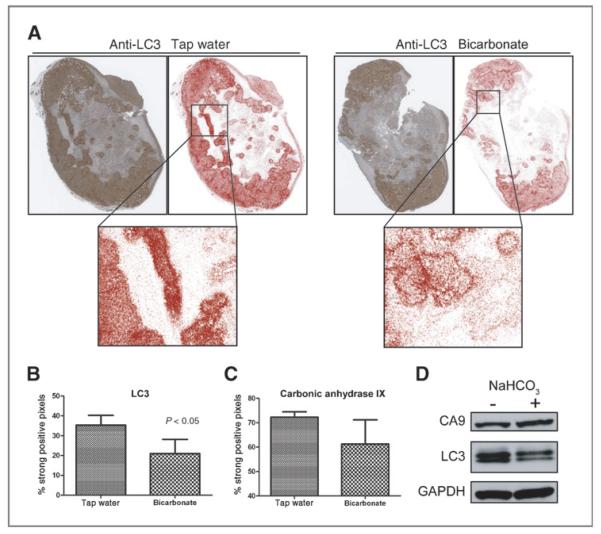
Although the above data are consistent, it could also be argued that the LC3 and BNIP3 were induced by hypoxia, and not acidosis. Therefore, a key experiment was to inhibit the acidosis using oral buffers in vivo. To test this, we chronically increase the extracellular pH of MDA-MB-231 MFP tumors with 200 mmol/L ad lib NaHCO3 for 2weeks and stained tumor cross-sections for LC3. We have previously shown that oral administration of NaHCO3 alkalinizes the extracellular pH of tumors without affecting systemic pH (30).
Positive pixel analysis of LC3 staining intensity in MDA-MB-231 NaHCO3 treated tumor cross-sections showed fewer strong positive pixels (red pixels) as compared with tap water tumors (Fig. 7A). Quantitative image analysis of whole tap water and NaHCO3 tumor cross-sections revealed a significant decrease in the percentage of strong positive pixels in NaHCO3 treated tumors (Fig. 7B). These data are consistent with the hypothesis that autophagy can be regulated by extracellular pH. To confirm that the observed decrease of LC3 expression in NaHCO3 was not simply an artifact of a global decrease in protein expression because of buffering, the same pixel analysis was used to determine the expression levels of Carbonic Anhydrase IX (CA9), a protein that is constitutively expressed, and moderately induced by hypoxia, in MDA-MB-231 cells (31). As expected, oral buffers did not significantly decrease (P = 0.133) the percentage of strong positive pixels substantiating the effect of buffering therapy on LC3 expression in vivo. In addition, total protein expression of LC3 was decreased in lysates from a NaHCO3 treated tumor with no change of CA9 expression between tap water and NaHCO3 treated samples (Fig. 7D)
Figure 7.
A, immunohistochemical staining of LC3 in representative tap and NaHCO3 treated MDA-MB-231 tumor cross-sections. Positive pixel analysis of LC3 staining was carried out using Aperio positive Pixel Count v9 (red, strong positive). B and C, positive pixel analysis was completed for LC3 and carbonic anhydrase IX (CA9) staining on whole tumor cross-sections. An overall significant decrease in the percentage of strong positive LC3 pixels was observed in NaHCO3 treated samples with no significant change in CA9 expression. The data are plotted as the mean ± SD of 3 tumor cross-sections from each treatment group. D, LC3 and CA9 expression in tumor lysates from tap and NaHCO3-treated tumors.
HS766T pancreatic cancer cells were used to verify the autophagic phenotype in another tumor type in response to low pH both in vitro and in vivo (Supplementary Data). HS766T cells were tested in vitro to determine if low pH induced an autophagic response similar to that observed in MDA-MB-231 cells. Consistent with MDA-MB-231 cells, an autophagic response was observed in cells cultured at low pH for 48 hours as evidenced by the increased expression of LC3-II by Western blot (Supplementary Fig. S3A). In vivo, buffer therapy significantly decreased the percentage of LC3 strong positive pixels supporting observations made in buffered MDA-MB-231 MFP tumors (Supplementary Fig. S3B and 3C).
Discussion
In this study, we investigated the effects of extracellular acidosis on MDA-MB-231 cells focusing on the induction of autophagy. We show that cells subjected to transient and chronic low pH growth conditions have elevated markers of autophagy and are dependent on this process for prolonged survival in acidic environments.
The investigation of an autophagic response to extracellular acidosis was pursued after the observation that ATG5 gene expression was increased across breast cell lines acutely cultured in low pH. ATG5 has been characterized as a key regulator of autophagy during early autophagosomal development (32). A similar increase of ATG5 mRNA and protein expression was observed in MDA-MB-231 cells, transiently cultured in low pH (6.7) (Fig. 3A and B) supplying additional evidence to further study this process in response to acidosis.
Cytotoxicity associated with hypoxia is less common than cells exposed to anoxic conditions (29). Survival under hypoxic conditions may be mediated by expression and activity of BNIP3, a Bcl-2 family member. Tracy and colleagues report that autophagy is inhibited under hypoxic conditions after knockdown of BNIP3 (33). BNIP3 expression and autophagic activity are also reported to be elevated in myocardial ischemia and reperfusion models (34). Extracellular acidosis results from both hypoxic and ischemic conditions, and this study investigated BNIP3 in response to low pH survival. In support of this hypothesis, BNIP3 stability was increased under acidic conditions (19). We show in our analysis that BNIP3 mRNA expression was increased in low pH cultured cells and may warrant additional investigation to define its role in low pH survival.
A hallmark of cancer is the ability of cancer cells to limit the rate of attrition by evading apoptosis (35). Autophagy is reported to support this hallmark by having under certain circumstances a tumor promoter/survival role during different stages of tumorigenesis. The observation that autophagy may contribute to cell death, although a definitive cell death role remains controversial, suggests that in order for autophagy to have a survival function, autophagic activity should only moderately increase above basal levels (36–38) Consistent with this hypothesis, MDA-MB-231 cells subjected to acidosis presented modest increases in levels of autophagic markers such as increased localization of LC3 to punctate structures (Fig. 2), double-membrane vesicles as observed by TEM (Fig. 4), and increased LC3-II protein expression (Fig. 5). The response observed in MDA-MB-231 cells was not cytotoxic and may represent a moderate increase above basal activity that promotes prolonged survival without cytotoxic side effects. However, this increase above basal activity is necessary, as inhibition of autophagic activity with 3-methyladenine increased cytotoxicity in the cultures exposed low pH (Fig. 5).
The tumor microenvironment is composed of a multitude of physical stresses that are transient and heterogeneous. Survival by means of increased autophagic activity is not unique to extracellular acidosis. Similar autophagic phenotypes are observed in tumor cells subjected to hypoxic and nutrient limited regions near the interior of tumors (33) protecting cells from apoptotic and necrotic cell death (39, 40). In the case of hypoxia, this physical condition precedes acidosis in vivo and in many cases tumor hypoxia can be intermittent (9, 10). In contrast, extracellular acidosis is expected to be chronic, as it is the product of anaerobic and aerobic glycolysis. Normal cells in the environment respond by increasing cell death pathways thus introducing the need for survival and adaptive mechanisms such as autophagy by the cancer cells.
We showed that in vivo spatial expression patterns of LC3 and BNIP3 corresponded with the hypoxia marker pimonidazole hydrochloride, which we used as a surrogate for acidic tissue because of the Pasteur effect (Fig. 6). Although this does not directly implicate the involvement of acidosis in the regulation of autophagy, it does imply that it may, in part, regulate this stress response. To better understand the regulatory role of acidosis in vivo, we buffered the extracellular pH of both MDA-MB-231 and HS766T tumor xenografts (Fig. 7 and Supplementary Fig. S3). Our group has shown that sodium bicarbonate (NaHCO3) alkalinizes extracellular pH (30, 41) and has the ability to inhibit spontaneous and experimental metastases (30, 42). Overall expression of LC3 decreased in NaHCO3 treated tumors without significantly altering the expression of CA9, a hypoxia marker. The remaining strong positive signal for LC3 in NaHCO3 treated tumors, although reduced, is a result of the other factors regulating autophagy such as hypoxia and nutrient limitations. However, the decrease of LC3 signal intensity in treated samples suggests that extracellular acidosis partially regulates autophagic activity.
Invasive and metastatic cancers maintain the Warburg effect resulting in acidification of the extracellular space in distant metastases irrespective of oxygen status. We have hypothesized that the increased H+ production from glycolysis offers a selective survival advantage over the surrounding normal tissue, whereas acidosis can be cytotoxic. Acquiring and maintaining a survival phenotype, such as autophagy, selected by acidosis in addition to other physical constraints would aid in successful colonization at secondary sites. In this study, we have shown the importance of autophagy in low pH adapted MDA-MB-231 cells and have identified a potential therapeutic strategy using the autophagy inhibitor 3-methyladenine that does not affect cells cultured under neutral conditions. These data suggest that a successful treatment strategy might be based on the dependence of cancer cells on autophagy for survival to acidic tumor microenvironments.
Supplementary Material
Acknowledgments
Grant Support This works is supported by R01 CA077575; U54 CA143970 (R.J. Gillies) and R01 CA131990 (B.F. Sloane). Moffitt Core Facilities are supported in part by Cancer Center Support Grant P30 CA076292. Confocal microscopy and image analyses were completed with the support of the Analytic Microscopy Core Facility at Moffitt Cancer Center and the Optical and Electron Microscopy Core Facility at the University of South Florida. FACS analysis was completed with the support of the Flow Cytometry Core Facility at Moffitt Cancer Center. Gene expression analysis was completed with the support of the Microarray Core Facility at Moffitt Cancer Center.
Footnotes
Disclosure of Potential Conflicts of Interest No potential conflicts of interest were disclosed.
Authors’ Contributions Conception and design: J.W. Wojtkowiak, J.M. Rothberg, M.C. Lloyd, B.F. Sloane, R.J. Gillies
Development of methodology: J.W. Wojtkowiak, E. Haller, M.C. Lloyd
Acquisition of data (provided animals, acquired and managed patients, provided facilities, etc.): J.W. Wojtkowiak, K.J. Schramm, E. Haller, M.C. Lloyd, R.J. Gillies
Analysis and interpretation of data (e.g., statistical analysis, biostatistics, computational analysis): J.W. Wojtkowiak, V. Kumar, J.B. Proemsey, M.C. Lloyd, R.J. Gillies
Writing, review, and/or revision of the manuscript: J.W. Wojtkowiak, J.M. Rothberg, V. Kumar, K.J. Schramm, E. Haller, M.C. Lloyd, B.F. Sloane, R.J. Gillies
Administrative, technical, or material support (i.e., reporting or organizing data, constructing databases): J.B. Proemsey, R.J. Gillies
Note: Supplementary data for this article are available at Cancer Research Online (http://cancerres.aacrjournals.org/).
References
- 1.Gatenby RA, Gillies RJ. A microenvironmental model of carcinogenesis. Nat Rev Cancer. 2008;8:56–61. doi: 10.1038/nrc2255. [DOI] [PubMed] [Google Scholar]
- 2.Schornack PA, Gillies RJ. Contributions of cell metabolism and H+ diffusion to the acidic pH of tumors. Neoplasia. 2003;5:135–45. doi: 10.1016/s1476-5586(03)80005-2. [DOI] [PMC free article] [PubMed] [Google Scholar]
- 3.Riva C, Chauvin C, Pison C, Leverve X. Cellular physiology and molecular events in hypoxia-induced apoptosis. Anticancer Res. 1998;18:4729–36. [PubMed] [Google Scholar]
- 4.Williams AC, Collard TJ, Paraskeva C. An acidic environment leads to p53 dependent induction of apoptosis in human adenoma and carcinoma cell lines: implications for clonal selection during colorectal carcinogenesis. Oncogene. 1999;18:3199–204. doi: 10.1038/sj.onc.1202660. [DOI] [PubMed] [Google Scholar]
- 5.Moellering RE, Black KC, Krishnamurty C, Baggett BK, Stafford P, Rain M, et al. Acid treatment of melanoma cells selects for invasive phenotypes. Clin Exp Metastasis. 2008;25:411–25. doi: 10.1007/s10585-008-9145-7. [DOI] [PubMed] [Google Scholar]
- 6.Warburg O. On metabolism of tumors. Constable; London, UK: 1930. [Google Scholar]
- 7.Czernin J, Phelps ME. Positron emission tomography scanning: current and future applications. Annu Rev Med. 2002;53:89–112. doi: 10.1146/annurev.med.53.082901.104028. [DOI] [PubMed] [Google Scholar]
- 8.Yun J, Rago C, Cheong I, Pagliarini R, Angenendt P, Rajagopalan H, et al. Glucose deprivation contributes to the development of KRAS pathway mutations in tumor cells. Science. 2009;325:1555–9. doi: 10.1126/science.1174229. [DOI] [PMC free article] [PubMed] [Google Scholar]
- 9.Bennewith KL, Durand RE. Quantifying transient hypoxia in human tumor xenografts by flow cytometry. Cancer Res. 2004;64:6183–9. doi: 10.1158/0008-5472.CAN-04-0289. [DOI] [PubMed] [Google Scholar]
- 10.Brown JM. Evidence for acutely hypoxic cells in mouse tumours, and a possible mechanism of reoxygenation. Br J Radiol. 1979;52:650–6. doi: 10.1259/0007-1285-52-620-650. [DOI] [PubMed] [Google Scholar]
- 11.Morita T. Low pH leads to sister-chromatid exchanges and chromosomal aberrations, and its clastogenicity is S-dependent. Mutat Res. 1995;334:301–8. doi: 10.1016/0165-1161(95)90067-5. [DOI] [PubMed] [Google Scholar]
- 12.Morita T, Nagaki T, Fukuda I, Okumura K. Clastogenicity of low pH to various cultured mammalian cells. Mutat Res. 1992;268:297–305. doi: 10.1016/0027-5107(92)90235-t. [DOI] [PubMed] [Google Scholar]
- 13.Chen JL, Lucas JE, Schroeder T, Mori S, Wu J, Nevins J, et al. The genomic analysis of lactic acidosis and acidosis response in human cancers. PLoS Genet. 2008;4:e1000293. doi: 10.1371/journal.pgen.1000293. [DOI] [PMC free article] [PubMed] [Google Scholar]
- 14.Gatenby RA, Smallbone K, Maini PK, Rose F, Averill J, Nagle RB, et al. Cellular adaptations to hypoxia and acidosis during somatic evolution of breast cancer. Br J Cancer. 2007;97:646–53. doi: 10.1038/sj.bjc.6603922. [DOI] [PMC free article] [PubMed] [Google Scholar]
- 15.Mizushima N, Klionsky DJ. Protein turnover via autophagy: implications for metabolism. Annu Rev Nutr. 2007;27:19–40. doi: 10.1146/annurev.nutr.27.061406.093749. [DOI] [PubMed] [Google Scholar]
- 16.Galluzzi L, Morselli E, Vicencio JM, Kepp O, Joza N, Tajeddine N, et al. Life, death and burial: multifaceted impact of autophagy. Biochem Soc Trans. 2008;36:786–90. doi: 10.1042/BST0360786. [DOI] [PubMed] [Google Scholar]
- 17.Rankin EB, Giaccia AJ. The role of hypoxia-inducible factors in tumorigenesis. Cell Death Differ. 2008;15:678–85. doi: 10.1038/cdd.2008.21. [DOI] [PMC free article] [PubMed] [Google Scholar]
- 18.Bellot G, Garcia-Medina R, Gounon P, Chiche J, Roux D, Pouyssegur J, et al. Hypoxia-induced autophagy is mediated through hypoxia-inducible factor induction of BNIP3 and BNIP3L via their BH3 domains. Mol Cell Biol. 2009;29:2570–81. doi: 10.1128/MCB.00166-09. [DOI] [PMC free article] [PubMed] [Google Scholar]
- 19.Frazier DP, Wilson A, Graham RM, Thompson JW, Bishopric NH, Webster KA. Acidosis regulates the stability, hydrophobicity, and activity of the BH3-only protein Bnip3. Antioxid Redox Signal. 2006;8:1625–34. doi: 10.1089/ars.2006.8.1625. [DOI] [PubMed] [Google Scholar]
- 20.Mizushina Y, Kasai N, Sugawara F, Iida A, Yoshida H, Sakaguchi K. Three-dimensional structural model analysis of the binding site of lithocholic acid, an inhibitor of DNA polymerase beta and DNA topoisomerase II. J Biochem. 2001;130:657–64. doi: 10.1093/oxfordjournals.jbchem.a003031. [DOI] [PubMed] [Google Scholar]
- 21.Kubasiak LA, Hernandez OM, Bishopric NH, Webster KA. Hypoxia and acidosis activate cardiac myocyte death through the Bcl-2 family protein BNIP3. Proc Natl Acad Sci U S A. 2002;99:12825–30. doi: 10.1073/pnas.202474099. [DOI] [PMC free article] [PubMed] [Google Scholar]
- 22.Tanida I, Ueno T, Kominami E. LC3 and Autophagy. Methods Mol Biol. 2008;445:77–88. doi: 10.1007/978-1-59745-157-4_4. [DOI] [PubMed] [Google Scholar]
- 23.Blommaart EF, Luiken JJ, Blommaart PJ, van Woerkom GM, Meijer AJ. Phosphorylation of ribosomal protein S6 is inhibitory for autophagy in isolated rat hepatocytes. J Biol Chem. 1995;270:2320–6. doi: 10.1074/jbc.270.5.2320. [DOI] [PubMed] [Google Scholar]
- 24.Jung CH, Ro SH, Cao J, Otto NM, Kim DH. mTOR regulation of autophagy. FEBS Lett. 2010;584:1287–95. doi: 10.1016/j.febslet.2010.01.017. [DOI] [PMC free article] [PubMed] [Google Scholar]
- 25.Wullschleger S, Loewith R, Hall MN. TOR signaling in growth and metabolism. Cell. 2006;124:471–84. doi: 10.1016/j.cell.2006.01.016. [DOI] [PubMed] [Google Scholar]
- 26.Hansen TE, Johansen T. Following autophagy step by step. BMC Biol. 2011;9:39. doi: 10.1186/1741-7007-9-39. [DOI] [PMC free article] [PubMed] [Google Scholar]
- 27.Raleigh JA, Calkins-Adams DP, Rinker LH, Ballenger CA, Weissler MC, Fowler WC, Jr, et al. Hypoxia and vascular endothelial growth factor expression in human squamous cell carcinomas using pimonidazole as a hypoxia marker. Cancer Res. 1998;58:3765–8. [PubMed] [Google Scholar]
- 28.Gillies RJ, Robey I, Gatenby RA. Causes and consequences of increased glucose metabolism of cancers. J Nucl Med. 2008;49(Suppl 2):24S–42S. doi: 10.2967/jnumed.107.047258. [DOI] [PubMed] [Google Scholar]
- 29.Bhujwalla ZM, Artemov D, Ballesteros P, Cerdan S, Gillies RJ, Solaiyappan M. Combined vascular and extracellular pH imaging of solid tumors. NMR Biomed. 2002;15:114–9. doi: 10.1002/nbm.743. [DOI] [PubMed] [Google Scholar]
- 30.Robey IF, Baggett BK, Kirkpatrick ND, Roe DJ, Dosescu J, Sloane BF, et al. Bicarbonate increases tumor pH and inhibits spontaneous metastases. Cancer Res. 2009;69:2260–8. doi: 10.1158/0008-5472.CAN-07-5575. [DOI] [PMC free article] [PubMed] [Google Scholar]
- 31.Tafreshi NK, Bui MM, Bishop K, Lloyd MC, Enkemann SA, Lopez AS, et al. Noninvasive detection of breast cancer lymph node metastasis using carbonic anhydrases IX and XII targeted imaging probes. Clin Cancer Res. 2012;18:207–19. doi: 10.1158/1078-0432.CCR-11-0238. [DOI] [PMC free article] [PubMed] [Google Scholar]
- 32.Mizushima N, Noda T, Yoshimori T, Tanaka Y, Ishii T, George MD, et al. A protein conjugation system essential for autophagy. Nature. 1998;395:395–8. doi: 10.1038/26506. [DOI] [PubMed] [Google Scholar]
- 33.Tracy K, Dibling BC, Spike BT, Knabb JR, Schumacker P, Macleod KF. BNIP3 is an RB/E2F target gene required for hypoxia-induced autophagy. Mol Cell Biol. 2007;27:6229–42. doi: 10.1128/MCB.02246-06. [DOI] [PMC free article] [PubMed] [Google Scholar]
- 34.Hamacher-Brady A, Brady NR, Logue SE, Sayen MR, Jinno M, Kirshenbaum LA, et al. Response to myocardial ischemia/reperfusion injury involves Bnip3 and autophagy. Cell Death Differ. 2007;14:146–57. doi: 10.1038/sj.cdd.4401936. [DOI] [PubMed] [Google Scholar]
- 35.Hanahan D, Weinberg RA. The hallmarks of cancer. Cell. 2000;100:57–70. doi: 10.1016/s0092-8674(00)81683-9. [DOI] [PubMed] [Google Scholar]
- 36.Gozuacik D, Kimchi A. Autophagy and cell death. Curr Top Dev Biol. 2007;78:217–45. doi: 10.1016/S0070-2153(06)78006-1. [DOI] [PubMed] [Google Scholar]
- 37.Kroemer G, Levine B. Autophagic cell death: the story of a misnomer. Nat Rev Mol Cell Biol. 2008;9:1004–10. doi: 10.1038/nrm2527. [DOI] [PMC free article] [PubMed] [Google Scholar]
- 38.Martin SJ. Oncogene-induced autophagy and the Goldilocks principle. Autophagy. 2011;7:922–3. doi: 10.4161/auto.7.8.15821. [DOI] [PubMed] [Google Scholar]
- 39.Degenhardt K, Mathew R, Beaudoin B, Bray K, Anderson D, Chen G, et al. Autophagy promotes tumor cell survival and restricts necrosis, inflammation, and tumorigenesis. Cancer Cell. 2006;10:51–64. doi: 10.1016/j.ccr.2006.06.001. [DOI] [PMC free article] [PubMed] [Google Scholar]
- 40.Karantza-Wadsworth V, Patel S, Kravchuk O, Chen G, Mathew R, Jin S, et al. Autophagy mitigates metabolic stress and genome damage in mammary tumorigenesis. Genes Dev. 2007;21:1621–35. doi: 10.1101/gad.1565707. [DOI] [PMC free article] [PubMed] [Google Scholar]
- 41.Raghunand N, He X, van Sluis R, Mahoney B, Baggett B, Taylor CW, et al. Enhancement of chemotherapy by manipulation of tumour pH. Br J Cancer. 1999;80:1005–11. doi: 10.1038/sj.bjc.6690455. [DOI] [PMC free article] [PubMed] [Google Scholar]
- 42.Ibrahim Hashim A, Cornnell HH, Coelho Ribeiro MD, Abrahams D, Cunningham J, Lloyd M, et al. Reduction of metastasis using a nonvolatile buffer. Clin Exp Metastasis. 2011;28:841–9. doi: 10.1007/s10585-011-9415-7. [DOI] [PMC free article] [PubMed] [Google Scholar]
Associated Data
This section collects any data citations, data availability statements, or supplementary materials included in this article.


