

Abstract
Background
In HIV-infected adults, we and others have shown that vitamin D deficiency is independently associated with increased carotid intima-media thickness (cIMT), a surrogate marker for cardiovascular disease (CVD). This study explored for the first time the relationship between vitamin D and CVD risk in HIV-infected youth.
Methods
This is a cross-sectional assessment of cIMT, inflammation, metabolic markers and vitamin D status in HIV-infected youth and healthy controls. We measured serum 25-hydroxyvitamin D (25(OH)D), fasting lipids, insulin, glucose, inflammatory markers, and cIMT.
Results
30 HIV–infected subjects and 31 controls were included. Among HIV-infected subjects, median age was 11 years (37% males; 73% black; similar to controls). HIV-infected subjects’ mean (standard deviation) serum 25(OH)D was 24 (35) ng/mL; 70% had 25(OH)D <20 ng/mL (deficient), 23% between 20–30 ng/mL (insufficient), and 7% >30 ng/mL (sufficient); proportions were similar to controls (P=0.17). After adjusting for season, sex and race, there was no difference in serum 25(OH)D between groups (P=0.11). Serum 25(OH)D was not significantly correlated with cIMT, inflammatory markers, or lipids. Serum 25(OH)D was negatively correlated with body mass index, insulin resistance, HIV duration, and cumulative use of antiretroviral therapy, non- and nucleoside reverse transcriptase inhibitors.
Conclusions
Most HIV-infected youth have vitamin D deficiency or insufficiency. Despite no direct association between serum 25(OH)D and cIMT, there were notable associations with some CVD risk factors, particularly inverse correlation with insulin resistance. Studies are needed to determine whether CVD risk, including insulin resistance, could be improved with vitamin D supplementation.
Keywords: HIV, children and adolescents, vitamin D deficiency, cardiovascular disease, insulin resistance
HIV infection independently increases the risk of developing cardiovascular disease (CVD).1,2 This increased risk is likely multi-factorial, including contributions from traditional risk factors, as well as HIV-related factors such as increased inflammation and antiretroviral therapy (ART).3–7 In the general population, vitamin D deficiency has been shown to be associated with a number of physiologic and pathophysiologic processes known to increase CVD risk, such obesity, hypertension, diabetes and insulin resistance, exercise capacity, and increased inflammation.8–14 Likewise, vitamin D deficiency is associated with worse arterial compliance15 and increased carotid intima-media thickness (cIMT),16 both surrogate markers for CVD. Proposed mechanisms of vitamin D’s role in CVD include its effects on the renin-angiotensin system,17 on glycemic control,18 and on inflammatory cytokines,9 and/or its direct effects on the vasculature.19
The prevalence of vitamin D deficiency, as measured by blood concentrations of 25-hydroxyvitamin D (25(OH)D; the established marker of overall vitamin D status20), is very high in the HIV-infected population, including in HIV-infected youth.21–23 A number of cross-sectional studies have also found increased carotid IMT in HIV-infected children and young adults compared to healthy controls,24–27 suggesting that this population is at an increased risk of CVD similar to their adult counterparts. However, it is unknown how vitamin D status affects cIMT, inflammation, and CVD risk in this population, despite data that suggests that vitamin D status affects cIMT in the HIV-infected adult population.21,28 Demonstrating significant relationships between vitamin D status and markers of CVD risk would suggest that correcting vitamin D deficiency could offer a potentially inexpensive strategy to attenuate risk and help to optimize health. Thus, the purpose of this study was to 1) to examine vitamin D status among HIV+ subjects and healthy controls, 2) to determine the relationship of serum 25(OH)D with carotid IMT in HIV+ children and young adults, and 3) to investigate the relationship of serum 25(OH)D with both traditional and HIV-related CVD risk factors, including inflammation.
METHODS
Study design/population
This study is a cross-sectional analysis from a prospective, longitudinal, observational cohort study evaluating carotid IMT in HIV-infected youth and healthy uninfected controls. As previously described,25,29 HIV-infected children and young adults attending the HIV clinic at University Hospitals Case Medical Center, Cleveland, Ohio were eligible for enrollment. Inclusion criteria were HIV infection and age 2–21 years. Exclusion criteria included active opportunistic infections, renal failure, diabetes, hypertension, family history of premature CVD, and smoking. All HIV-infected children and young adults between 2–21 years old were eligible and enrolled into the original cohort study.
Healthy controls were chosen randomly from a larger convenience sample including children of hospital staff, siblings of HIV-infected patients, and patients seen at the general pediatric clinic. The goal was to achieve a group with similar age (±2 years), body mass index (BMI) (±1 kg/m2), and proportions of sex and race. Matching used for selection was not retained in the analysis. Additional exclusion criteria for uninfected controls included current or recent infectious or inflammatory illness, known chronic disease, and receiving any prescription medication. None of the controls had a prior history of perinatal HIV exposure or received any antiretrovirals in utero or after birth.
Stored serum was utilized for analysis and all subjects with an available sample from any time point were included in this cross-sectional, post hoc analysis. Measurements associated with a particular sample were used for each subject.
The study was reviewed and approved by the Institutional Review Board of the University Hospitals Case Medical Center. All parents or legal guardians and children, when appropriate, gave written informed consent to participate in the study.
Clinical assessments
Standardized blood pressure measurements and anthropometry were performed by the same experienced study coordinator (NS). Anthropometric measurements were performed based on procedure recommendations from the Metabolic Study Group of the AIDS Clinical Trials Group, which included waist and hip circumference obtained at the level of the umbilicus and at the widest portion of the buttocks, respectively. Weight and height measurements were obtained in all subjects from the same clinic scale, and blood pressure was obtained with an automated, calibrated blood pressure machine. An extensive chart review of HIV-infected subjects included demographics, all past and current medical diagnoses, concomitant medications, and detailed ART history. Controls (or guardians) completed questionnaires in order to obtain their relevant demographic and medical information.
Laboratory tests
Fasting blood (≥8 hours) was drawn from all subjects for real-time measurements of insulin, glucose, and lipoprotein profile. Insulin resistance was calculated using the homeostasis model assessment of insulin resistance (HOMA-IR) (fasting insulin (μU/ml) × fasting glucose (mg/dl)/405.30 Absolute and percent CD4+ T-cell count and serum HIV-1 RNA level were concomitantly measured in the HIV-infected group as markers of HIV disease activity.
Serum concentrations of 25(OH)D were measured as the best determinant of vitamin D status.20 All samples were analyzed in the same co-investigator’s laboratory (VT) at Emory University by an experienced technician (SS). Concentrations of 25(OH)D were assessed using specific ELISA kits (IDS, LTD, Fountain Hills, AZ, USA) as per the manufacturer’s product manual and tested in duplicate. Median intra-assay and inter-assay coefficients of variation (CV) were <12%. Quality control was ensured by participation in the vitamin D external quality assessment scheme (DEQAS, site 606). Laboratory personnel were blinded to clinical information. We adopted the current Endocrine Society’s and Institute of Medicine’s (IOM) guidelines defining vitamin D deficiency as serum 25(OH)D concentrations <20 ng/mL.31,32 We also further defined serum 25(OH)D concentrations ≥20–29 ng/mL as vitamin D insufficiency and serum 25(OH)D concentrations >29 ng/mL as optimal vitamin D status, as per the Endocrine Society guidelines.31
We selected biomarkers known to be associated with heightened CVD risk and to be elevated in HIV-infected patients.33–36 Tumor necrosis factor (TNF)-α, soluble tumor necrosis factor receptor-I (sTNFR-I), soluble tumor necrosis factor receptor-II (sTNFR-II), interleukin-6 (IL-6), high sensitivity C-reactive protein (hsCRP), soluble intercellular adhesion molecule-1 (sICAM-1), and soluble vascular cellular adhesion molecule-1 (sVCAM-1) were measured using an enzyme-labeled immunosorbent sandwich assay (AushonBiosystems, Billerica, Massachusetts, USA). The median intra-assay coefficients of variation for TNF-a, sTNFR-I, sTNFR-II, IL-6, hsCRP, vWF, sICAM-1, sVCAM-1, and MPO were 14.5%, 8.8%, 8.6%, 11.7%, 6.9%, 13.3%, 8.0%, 8.7%, and 7.5%, respectively. The median interassay coefficients of variation for each assay were 9.8%, 10.8%, 6.0%, 10.4%, 4.5%, 9.0%, 4.2%, 13.4%, and 12.6%, respectively.
Carotid IMT measurements
All carotid ultrasounds were performed by an experienced sonographer and read by an experienced radiologist, both blinded to HIV status. Carotid IMT methods were used as previously described.25 Briefly, images of the bilateral common carotid artery (CCA) and internal carotid artery (ICA) were obtained in longitudinal views separately. Images of the near (proximal) and far (distal) wall free of plaques were acquired with a 7–14 MHz AT 1204 linear array transducer (Toshiba American Medical Systems, Tustin, California) operating at 14 MHz with differential harmonics. Three measurements of IMT were obtained at near and far wall of each CCA and ICA. The mean of three measurements at each site (right and left side) was used as final measurement of IMT for that site (for both CCA and ICA, the far and near wall had three IMT measurements each, resulting in a total of 12 measurements per subject). Right and left sides were then averaged, and reported as a single ICA and CCA measurement.37
Statistical methods
Demographics, clinical characteristics and fasting metabolic parameters are described by study group, and HIV-related characteristics are described for HIV-infected subjects. HIV-infected subjects were compared to the controls for all variables of interest. For between-group comparisons, nominal variables were compared using χ2 analysis or Fisher’s exact test. Continuous measures were tested for normality. Normally-distributed variables were compared using t-tests, and non-normally distributed variables were compared using Wilcoxon rank sum tests. Serum 25(OH)D concentrations were compared between groups using both ordinal categories based on vitamin D status (i.e. deficient, insufficient and sufficient) and by continuous measures. ANCOVA was then used on continuous measures of serum 25(OH)D concentrations to compare P values between unadjusted means and means adjusted for sex, race, and season of blood draw.
The relationships of 25(OH)D to the other variables of interest were estimated separately for the HIV-infected group and the controls with Spearman Rank Correlation Coefficients. Variables with P < 0.05 in the univariate analysis among the HIV-infected subjects were then included in a multiple linear regression model using a forward selection process. P ≤ 0.50 was used as the limit for inclusion in the final model.
All analyses were performed using SAS, version 9.2 (SAS Institute, Cary, North Carolina). The level of significance was set at 0.05.
RESULTS
Study Population and Comparison between Groups
Thirty HIV-infected subjects and 31 controls were included in the analysis. Table 1 describes the demographic, clinical, and laboratory characteristics for both groups. Median age in the HIV-infected group was 12.5 years with 37% male and 81% black. Seventy-seven percent of HIV-infected subjects had their blood drawn in either winter or spring seasons. Ten of the HIV-infected subjects were taking vitamin D supplements or multivitamins that contained 200–400 IU/day of vitamin D, while none of the controls were taking dietary supplements. There were no smokers in either group.
Table 1.
Subjects characteristics.
| Median (Range) Unless Specified Otherwise | HIV-infected | Controls | P |
|---|---|---|---|
| N = 30 | N = 31 | ||
| Age, years | 12.5 (4.2–24.3) | 10.8 (4.3–28.0) | 0.23 |
| Male, no. (%) | 11 (37%) | 14 (45%) | 0.50 |
| Black, no. (%) | 25 (81%) | 22 (73%) | 0.50 |
| Winter/spring blood draw | 24 (77%) | 19 (63%) | 0.23 |
| BMI (kg/m2) | 20 (15–38) | 19 (15–31) | 0.31 |
| Systolic BP (mmHg) | 104 (88–140) | 104 (88–126) | 0.94 |
| Diastolic BP (mmHg) | 68 (48–88) | 70 (56–82) | 0.40 |
| TC (mg/dL) | 164 (106–278) | 154 (93–222) | 0.07 |
| HDL (mg/dL) | 51 (23–74) | 55 (40–80) | 0.12 |
| TG (mg/dL) | 78 (30–292) | 45 (10–124) | <0.01 |
| HOMA-IR | 2.01 (0.18–6.89) | 1.64 (0.34–5.39) | 0.43 |
| CCA IMT (mm) | 1.00 (0.70–1.25) | 1.00 (0.75–1.25) | 0.75 |
| ICA IMT (mm) | 0.85 (0.53–1.83) | 0.90 (0.50–1.15) | 0.49 |
| TNF-α (pg/ml) | 3.65 (0.44–17.12) | 3.55 (0.55–29.11) | 0.70 |
| sTNFR-I (pg/ml) | 578 (192–6,274) | 644 (253–6,870) | 0.36 |
| sTNFR-II (pg/ml) | 673 (315–7,368) | 570 (163–7,533) | 0.23 |
| hsCRP (mg/L) | 0.59 (0.00–47.46) | 0.05 (0.00–11.98) | <0.01 |
| IL-6 (pg/ml) | 3.45 (0.36–17.88) | 2.58 (0.29–29.10) | 0.33 |
| sICAM-1 (ng/ml) | 679 (215–2,406) | 304 (44–1,061) | <0.01 |
| sVCAM-1 (ng/ml) | 2,905 (395–16,661) | 1,240 (627–7,347) | 0.02 |
BMI, body mass index; BP, blood pressure; TC, total cholesterol; HDL, high-lipoprotein cholesterol; TG, triglycerides; HOMA-IR, homeostasis model assessment of insulin resistance; CCA, common carotid artery; IMT, intima-media thickness; ICA, internal carotid artery; TNF-α, tumor necrosis factor-α; sTNFR-I, soluble tumor necrosis factor receptor-I; sTNFR-II, soluble tumor necrosis factor receptor-II; IL-6, interleukin-6; hsCRP, high sensitivity C-reactive protein; sICAM-1, soluble intercellular adhesion molecule-1; sVCAM-I, soluble vascular cellular adhesion molecule-1
Table 2 describes HIV-specific characteristics. None of the subjects had any co-morbid conditions or were taking any medications which could affect the results. All of the subjects who were on an non-nucleoside reverse transcriptase inhibitor (NNRTI) at the time of the analysis were on efavirenz except one. Three subjects had lipodystrophy.
Table 2.
HIV-infected subjects’ characteristics.
| Median (range) unless specified | N = 30 |
| CD4 cell count (no./mm3) | 896 (59–1988) |
| Nadir CD4 cell count (no./mm3) | 270 (0–1394) |
| Vertical transmission, no. (%) | 26 (87%) |
| HIV-1 RNA <400 copies/mL, no (%) | 23 (79%) |
| Subjects on ART, no. (%) | 27 (90%) |
| PI | 17 (57%) |
| NNRTI | 13 (43%) |
| Cumulative ART duration (mo.) | 81 (16–215) |
| Cumulative NNRTI duration (mo.) | 37 (0–114) |
| Cumulative PI duration (mo.) | 53 (0–136) |
ART, antiretroviral therapy; PI, protease inhibitors; NNRTI, non-nucleoside reverse transcriptase inhibitors
Age, male sex, race, BMI, blood pressure, and season of blood draw were similar between groups. Total cholesterol, high-density lipoprotein cholesterol, and HOMA-IR were also similar between groups, but triglycerides were higher in the HIV-infected group. Tumor necrosis factors, its soluble receptors, and IL-6 were similar between groups, but hCRP, sICAM-1 and sVCAM-1 were higher in the HIV-infected group. Both CCA and ICA IMT were similar between groups.
Vitamin D Status in HIV-infected Subjects and Healthy Controls
The proportion of subjects by study group in each category of vitamin D status based on their serum 25(OH)D concentrations is presented in Figure 1. The proportion of subjects in each category was similar for both groups, but the overwhelming majority of subjects in both groups were in the vitamin D deficient range.
Figure 1. Percentage of HIV-infected subjects and healthy controls with vitamin D deficiency, insufficiency, and sufficiency.
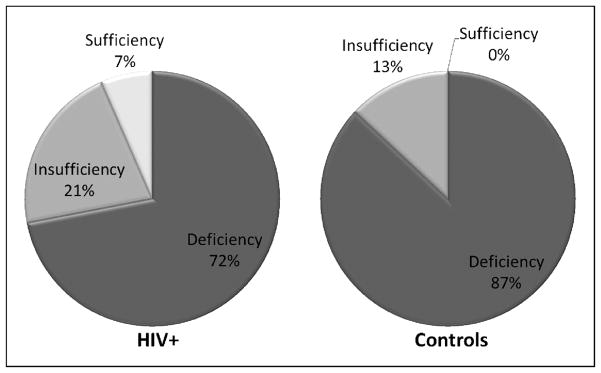
This figure shows the proportion of subjects by study group in each category of vitamin D status based on serum concentrations of 25(OH)D. Vitamin D deficiency is defined as 25(OH)D <20 ng/mL, vitamin D insufficiency as 25(OH)D ≥20–29 ng/mL, and optimal vitamin D status as 25(OH)D >29 ng/mL. There was no difference between groups in the proportions of subjects in each vitamin D status category (P = 0.17). The majority of subjects from both groups were in the vitamin D deficient range. One HIV-infected subject was inadvertently taking mega-doses of vitamin D and had a 25(OH)D concentration of 204 ng/mL. 25(OH)D, 25-hydroxyvitamin D
The unadjusted mean (standard deviation, SD) was 24 (35) ng/mL in the HIV-infected group versus 14 (5) ng/ml in the control group (P = 0.07). After adjusting for season, sex and race, there was still no difference in 25(OH)D between groups (P=0.11). One HIV-infected subject was inadvertently taking mega-doses of vitamin D and had a 25(OH)D concentration of 204 ng/mL, which accounts for the high SD in the HIV-infected group. Excluding this subject in the analysis did not change the overall significance of the results.
Relationship Between 25(OH)D and CVD Risk Factors, Inflammation and HIV-Related Factors
Serum 25-hydroxyvitamin D was negatively correlated with BMI in both the HIV-infected subjects and healthy controls, while it was only negatively correlated with age among the controls (Table 3). Among controls, serum 25(OH)D was also positively correlated with sTNFR-II and sICAM-1 and negatively correlated with CCA IMT. Within the HIV-infected group, 25(OH)D was negatively correlated with HOMA-IR, HIV duration, and cumulative duration of ART, NRTI, and NNRTI duration.
Table 3.
Correlations between serum 25(OH)D and cardiovascular disease risk factors, inflammation, and HIV-related variables.
| Variable | HIV+ | Controls | ||
|---|---|---|---|---|
|
| ||||
| R | P | R | P | |
| Age | −0.33 | 0.07 | −0.47 | <0.01 |
| BMI | −0.41 | 0.03 | −0.44 | 0.01 |
| HOMA-IR | −0.42 | 0.02 | −0.30 | 0.10 |
| sTNFR-II | −0.16 | 0.40 | −0.38 | 0.04 |
| sICAM-I | −0.28 | 0.53 | 0.44 | 0.02 |
| CCA IMT | −0.13 | 0.34 | −0.61 | <0.01 |
| HIV Duration | −0.63 | <0.01 | -- | -- |
| ART Duration | −0.52 | <0.01 | -- | -- |
| NRTI Duration | −0.49 | <0.01 | -- | -- |
| NNRTI Duration | −0.45 | 0.02 | -- | -- |
R = Spearman Correlation Coefficient
Other variables tested but not significant: For both groups: systolic/diastolic BP, TC, LDL, HDL, TNF-α, sTNFR-I, hsCRP, IL-6, sVCAM-1; For HIV-infected group: cumulative PI duration 25(OH)D, 25-hydroxyvitamin D; BMI, body mass index; HOMA-IR, homeostasis model assessment of insulin resistance; soluble tumor necrosis factor receptor-II; sICAM-1, soluble intercellular adhesion molecule-1; CCA IMT, common carotid artery intima-media thickness; ART, antiretroviral therapy; NRTI, nucleoside reverse transcriptase inhibitors; NNRTI, non-nucleoside reverse transcriptase inhibitors; BP, blood pressure; TC, total cholesterol; HDL, high-lipoprotein cholesterol; TG, triglycerides; TNF-α, tumor necrosis factor-α;-α; sTNFR-I, soluble tumor necrosis factor receptor-I; hsCRP, high sensitivity C-reactive protein; IL-6, interleukin-6;; sVCAM-I, soluble vascular cellular adhesion molecule-1; PI, protease inhibitor
In the multiple linear regression model, the very high outlying value described earlier was excluded from the analysis to prevent an extreme departure from normality. Four variables remained in the final model, including duration of HIV (P < 0.01), HOMA-IR (P = 0.09), duration of NNRTI (P = 0.25) and age (P = 0.50).
DISCUSSION
In this study, we investigated the relationship between vitamin D status, CVD risk factors and vascular disease (cIMT) in HIV-infected children and young adults. In contrast to similar studies in HIV-infected adults, we did not detect any significant associations between vitamin D status and cIMT with the HIV-infected group. However, there were notable significant correlations between low vitamin D and several well-established CVD risk factors, including insulin resistance and higher BMI.38,39 In addition, we demonstrated significant correlations between low vitamin D and HIV-related factors, including longer duration of HIV disease and cumulative use of ART, NRTI, and NNRTI. There were no significant correlations within the HIV-infected group between serum 25(OH)D and CD4 count, inflammation markers, and lipids.
Importantly, there was a very high prevalence of vitamin D deficiency and insufficiency. In fact, 72% and 87% of the HIV-infected subjects and healthy controls, respectively, were deficient as per both the current Endocrine Society and IOM guidelines31,32. Moreover, 93% and 100% of the HIV-infected subjects and healthy controls, respectively, had vitamin D deficiency or insufficiency per the current Endocrine Society Guidelines31. Albeit striking, these numbers are consistent with other studies of HIV-infected youth in other geographical regions22,23, suggesting the generalizability of these current data. These data underscore the need to investigate the appropriate supplementation dose and adequate blood concentration of 25(OH)D in HIV-infected youth with the ultimate goal of developing population-specific guidelines. The findings of this study suggest that vitamin D deficiency is common and randomized-controlled trials are needed to determine if vitamin D supplementation has a positive impact on CVD risk factors.
We have previously shown a relationship between vitamin D status and CVD in ART-stable, HIV-infected adults, where an independent association was observed between vitamin D status and carotid IMT21. Notably, subjects with CCA IMT levels above the median were 10-fold more likely to have the lowest 25(OH)D concentrations. Vitamin D status was also associated with the inflammatory and endothelial activation markers, sTNFR-1 and sICAM-1, both shown to be associated with CVD and atherosclerosis development in the general population35,36. In this current study investigating HIV-infected children and young adults, we observed a similar relationship within the control group but not within the HIV-infected group. This may be due to the fact that the HIV-infected group had additional HIV-related confounders that neither the controls nor the previously-studied adults had, as not all of the HIV-infected subjects in our current study were virologically-suppressed. This relationship deserves further investigation in larger, prospective trials of virologically-suppressed HIV-infected children and young adults.
In univariate analysis, HOMA-IR was significantly associated with 25(OH)D among the HIV-infected group. While this relationship did not remain significant in the regression analysis, these results must be interpreted with caution as we explored a large number of variables given our small number of subjects, and this potential link deserves further investigation. The association of vitamin D status and diabetes was reviewed recently in a meta-analysis of 28 independently published studies and showed a significant 55% reduction in the risk of diabetes in the general population.40
Insulin resistance and diabetes are very well-described disorders among HIV-infected individuals.41–46 In ART-treated HIV-infected men, the risk of diabetes is 4-fold higher than healthy controls without HIV.42 The prevalence of impaired glucose homeostasis in HIV-infected children ranges from about 8–35%, and most commonly manifests itself as insulin resistance.41,44–46 Insulin resistance in the HIV population is a common component of lipodystrophy and metabolic syndrome, complications of HIV infection and ART.47 In HIV-infected adults, there are a few pharmacologic interventions that have been shown to improve insulin resistance associated with these conditions, including thiazolidinediones and metformin.48–50 While metformin is approved for children ≥10 years of age with type 2 diabetes, it has not been tested in HIV-infected children as a means of improving insulin resistance in individuals who do not have frank diabetes.51
Thus, there are currently few options in the HIV-infected pediatric population for improving insulin resistance, and the CVD risk associated with it, other than diet and exercise.52 There are some antiretroviral medications which are less likely to cause insulin resistance than others;53 however, choices are very limited in children due to inadequate weight to take the doses in the pills on the market and/or inability to swallow pills for medications that are not available in liquid formulations. Similarly, it is necessary in some cases of perinatally-infected young adults to return to older antiretrovirals with more toxic metabolic profiles due extensive viral resistance that prohibits the use of newer drugs and drug classes. If raising serum 25(OH)D concentrations in HIV-infected children and young adults improves insulin resistance, this would offer a potential adjuvant treatment that is inexpensive and safe.
In HIV-infected adults, vitamin D supplementation has actually been associated with decreasing insulin sensitivity; however, these effects warrant investigation specifically in the pediatric population, as data from adult studies cannot be automatically extrapolated.54,55 Moreover, in Longenecker, et al, 12 weeks of 4,000 IU/daily of vitamin D supplementation vitamin D supplementation not only worsened insulin resistance but also did not improve endothelial function. However, this supplementation dose was inadequate to increase serum concentrations to optimal levels and was a relatively short follow-up period. Thus, further studies are needed to better evaluate any changes in insulin resistance and surrogate CVD markers that may occur with adequate vitamin D repletion doses before any definitive conclusions can be made.
While vitamin D has long been known to play a major role in bone metabolism, over the last few years, it has become clear that vitamin D has many non-classic, but vital functions in almost every tissue of the body, including those that regulate glucose metabolism.20 Studies from the adult general population show that there is a higher prevalence of type 2 diabetes in individuals with vitamin D deficiency,56,57 and a similar association has been described in HIV-infected adults.58 Prevention of type 1 diabetes has been demonstrated in animals exposed to high doses of the active form of vitamin D, 1,25-dihydroxyvitamin D (1,25(OH)2D) which acts as a steroid hormone by binding to the nuclear vitamin D receptor (VDR) and regulating transcription of hundreds of genes. To date, >900 regulated genes have been identified.59 In the case of glucose metabolism, 1,25(OH)2D has been shown to bind to the VDR on the pancreatic beta cells.60 Based on these epidemiologic and pre-clinical data, further studies investigating the relationship between vitamin D and insulin resistance in the HIV-infected population are warranted.
In addition to a negative correlation between serum 25(OH)D and insulin resistance within the HIV-infected group, we demonstrated similar relationships between serum 25(OH)D and BMI, HIV duration, and ART duration. Studies demonstrate that certain antiretrovirals, such as efavirenz and ritonavir, interfere with vitamin D metabolism.55,61–63 Similarly, obesity increases the likelihood of vitamin D deficiency because a greater amount of synthesized 25(OH)D is deposited in fat tissue.64 These data emphasize the importance of conducting population-specific research trials within this unique population, especially given the high prevalence of vitamin D deficiency demonstrated among HIV-infected children and young adults in this study and others.21–23 With the growing obesity issue in industrialized countries, HIV-infected children’s life-long need for ART, and HIV/ART’s associated metabolic complications, trials are needed to further define the role that vitamin D plays, the impact of improving blood concentrations of 25(OH)D, and what doses are needed to restore and maintain vitamin D status.
Despite the novel data presented, there are limitations to this study. As an exploratory study, this study was not powered and investigated a number of number of associations between 25(OH)D and variables of interest. Thus, this limits the overall interpretation of the data. Likewise, as a cross-sectional design, the associations demonstrated cannot prove causality. Additionally, there were a relatively small number of subjects which may have limited our ability to detect relationships with serum 25(OH)D within the HIV-infected group. The fact that CCA IMT, sTNFR-II, and sICAM-1 were correlated with serum 25(OH)D within the control group but not with the HIV-infected group may provide support for this, but, on the other hand, it may merely emphasize the complex interaction of vitamin D with the variety of HIV-related factors. Similarly, the regression model must be interpreted with caution given the large number of relevant variables and the small overall N.
Nevertheless, this study supports the concept that vitamin D deficiency is associated with worse CVD risk profile in HIV-infected individuals. Randomized-controlled clinical trials are needed to further explore these relationships, better account for potential confounders, and investigate the effect of vitamin D supplementation on attenuating CVD risk, especially among HIV-infected youth where an opportunity exists for disease prevention.
Acknowledgments
Sources of Support: The study was funded by an independent research grant from GlaxoSmithKline Collaborative Study Group, as well as supported by research grants to Dr. McComsey (R01HD070490) and Dr. Eckard (1K23HD069199) from the National Institutes of Health, National Institute of Child Health and Development. The funding agencies had absolutely no role in study design, data collection or analysis.
Footnotes
Disclosure Statement: GAM serves as a consultant and has received research funding from Bristol-Myers Squibb, GlaxoSmithKline, Gilead, Merck, Tibotec, and Abbott. GAM currently chairs a DSMB for a Pfizer-funded study. ARE has received research funding from Bristol-Myers Squibb, Cubist Pharmaceuticals, and GlaxoSmithKline. All other authors: no conflicts.
References
- 1.Triant VA, Lee H, Hadigan C, Grinspoon SK. Increased acute myocardial infarction rates and cardiovascular risk factors among patients with human immunodeficiency virus disease. Journal of Clinical Endocrinology & Metabolism. 2007;92:2506–12. doi: 10.1210/jc.2006-2190. [DOI] [PMC free article] [PubMed] [Google Scholar]
- 2.Obel N, Thomsen HF, Kronborg G, et al. Ischemic heart disease in HIV-infected and HIV-uninfected individuals: a population-based cohort study. Clinical Infectious Diseases. 2007;44:1625–31. doi: 10.1086/518285. [DOI] [PubMed] [Google Scholar]
- 3.Friis-Moller N, Reiss P, Sabin CA, et al. Class of antiretroviral drugs and the risk of myocardial infarction. The New England journal of medicine. 2007;356:1723–35. doi: 10.1056/NEJMoa062744. [DOI] [PubMed] [Google Scholar]
- 4.Friis-Moller N, Weber R, Reiss P, et al. Cardiovascular disease risk factors in HIV patients--association with antiretroviral therapy. Results from the DAD study AIDS. 2003;17:1179–93. doi: 10.1097/01.aids.0000060358.78202.c1. [DOI] [PubMed] [Google Scholar]
- 5.Lorenz MW, Stephan C, Harmjanz A, et al. Both long-term HIV infection and highly active antiretroviral therapy are independent risk factors for early carotid atherosclerosis. Atherosclerosis. 2008;196:720–6. doi: 10.1016/j.atherosclerosis.2006.12.022. [DOI] [PubMed] [Google Scholar]
- 6.Friis-Moller N, Sabin CA, Weber R, et al. Combination antiretroviral therapy and the risk of myocardial infarction. The New England journal of medicine. 2003;349:1993–2003. doi: 10.1056/NEJMoa030218. [DOI] [PubMed] [Google Scholar]
- 7.Triant VA, Meigs JB, Grinspoon SK. Association of C-reactive protein and HIV infection with acute myocardial infarction. J Acquir Immune Defic Syndr. 2009;51:268–73. doi: 10.1097/QAI.0b013e3181a9992c. [DOI] [PMC free article] [PubMed] [Google Scholar]
- 8.Cannell JJ, Hollis BW, Sorenson MB, Taft TN, Anderson JJ. Athletic performance and vitamin D. Med Sci Sports Exerc. 2009;41:1102–10. doi: 10.1249/MSS.0b013e3181930c2b. [DOI] [PubMed] [Google Scholar]
- 9.Judd SE, Nanes MS, Ziegler TR, Wilson PW, Tangpricha V. Optimal vitamin D status attenuates the age-associated increase in systolic blood pressure in white Americans: results from the third National Health and Nutrition Examination Survey. Am J Clin Nutr. 2008;87:136–41. doi: 10.1093/ajcn/87.1.136. [DOI] [PubMed] [Google Scholar]
- 10.Liu J, Cao Z, Zhang Z, Zhou S, Ye Z. A comparative study on several models of experimental renal calcium oxalate stones formation in rats. J Huazhong Univ Sci Technolog Med Sci. 2007;27:83–7. doi: 10.1007/s11596-007-0124-z. [DOI] [PubMed] [Google Scholar]
- 11.Schleithoff SS, Zittermann A, Tenderich G, Berthold HK, Stehle P, Koerfer R. Vitamin D supplementation improves cytokine profiles in patients with congestive heart failure: a double-blind, randomized, placebo-controlled trial. The American journal of clinical nutrition. 2006;83:754–9. doi: 10.1093/ajcn/83.4.754. [DOI] [PubMed] [Google Scholar]
- 12.Shea MK, Booth SL, Massaro JM, et al. Vitamin K and vitamin D status: associations with inflammatory markers in the Framingham Offspring Study. Am J Epidemiol. 2008;167:313–20. doi: 10.1093/aje/kwm306. [DOI] [PMC free article] [PubMed] [Google Scholar]
- 13.Martins D, Wolf M, Pan D, et al. Prevalence of cardiovascular risk factors and the serum levels of 25-hydroxyvitamin D in the United States: data from the Third National Health and Nutrition Examination Survey. Arch Intern Med. 2007;167:1159–65. doi: 10.1001/archinte.167.11.1159. [DOI] [PubMed] [Google Scholar]
- 14.Scragg R, Sowers M, Bell C. Serum 25-hydroxyvitamin D, ethnicity, and blood pressure in the Third National Health and Nutrition Examination Survey. Am J Hypertens. 2007;20:713–9. doi: 10.1016/j.amjhyper.2007.01.017. [DOI] [PubMed] [Google Scholar]
- 15.London GM, Guerin AP, Verbeke FH, et al. Mineral metabolism and arterial functions in end-stage renal disease: potential role of 25-hydroxyvitamin D deficiency [see comment] Journal of the American Society of Nephrology. 2007;18:613–20. doi: 10.1681/ASN.2006060573. [DOI] [PubMed] [Google Scholar]
- 16.Targher G, Bertolini L, Padovani R, et al. Serum 25-hydroxyvitamin D3 concentrations and carotid artery intima-media thickness among type 2 diabetic patients. Clin Endocrinol (Oxf) 2006;65:593–7. doi: 10.1111/j.1365-2265.2006.02633.x. [DOI] [PubMed] [Google Scholar]
- 17.Khazai N, Judd SE, Tangpricha V. Calcium and vitamin D: skeletal and extraskeletal health. Current rheumatology reports. 2008;10:110–7. doi: 10.1007/s11926-008-0020-y. [DOI] [PMC free article] [PubMed] [Google Scholar]
- 18.Mathieu C, Gysemans C, Giulietti A, Bouillon R. Vitamin D and diabetes. Diabetologia. 2005;48:1247–57. doi: 10.1007/s00125-005-1802-7. [DOI] [PubMed] [Google Scholar]
- 19.Simpson RU, Hershey SH, Nibbelink KA. Characterization of heart size and blood pressure in the vitamin D receptor knockout mouse. Journal of Steroid Biochemistry & Molecular Biology. 2007;103:521–4. doi: 10.1016/j.jsbmb.2006.12.098. [DOI] [PMC free article] [PubMed] [Google Scholar]
- 20.Holick MF. Vitamin D deficiency. The New England journal of medicine. 2007;357:266–81. doi: 10.1056/NEJMra070553. [DOI] [PubMed] [Google Scholar]
- 21.Ross AC, Judd S, Kumari M, et al. Vitamin D is linked to carotid intima-media thickness and immune reconstitution in HIV-positive individuals. Antivir Ther. 2011;16:555–63. doi: 10.3851/IMP1784. [DOI] [PMC free article] [PubMed] [Google Scholar]
- 22.Eckard AR, Judd SE, Ziegler TR, et al. Risk factors for vitamin D deficiency and relationship with cardiac biomarkers, inflammation and immune restoration in HIV-infected youth. Antivir Ther. 2012;17:1069–78. doi: 10.3851/IMP2318. [DOI] [PMC free article] [PubMed] [Google Scholar]
- 23.Rutstein R, Downes A, Zemel B, Schall J, Stallings V. Vitamin D status in children and young adults with perinatally acquired HIV infection. Clin Nutr. 2011;30:624–8. doi: 10.1016/j.clnu.2011.02.005. [DOI] [PubMed] [Google Scholar]
- 24.de Giuliano IC, de Freitas SF, de Souza M, Caramelli B. Subclinic atherosclerosis and cardiovascular risk factors in HIV-infected children: PERI study. Coronary Artery Disease. 2008;19:167–72. doi: 10.1097/MCA.0b013e3282f6dffb. [DOI] [PubMed] [Google Scholar]
- 25.McComsey GA, O’Riordan M, Hazen SL, et al. Increased carotid intima media thickness and cardiac biomarkers in HIV infected children. AIDS. 2007;21:921–7. doi: 10.1097/QAD.0b013e328133f29c. [DOI] [PubMed] [Google Scholar]
- 26.Charakida M, Donald AE, Green H, et al. Early structural and functional changes of the vasculature in HIV-infected children: impact of disease and antiretroviral therapy. Circulation. 2005;112:103–9. doi: 10.1161/CIRCULATIONAHA.104.517144. [DOI] [PubMed] [Google Scholar]
- 27.de Giuliano IC, de Freitas SF, de Souza M, Caramelli B. Subclinic atherosclerosis and cardiovascular risk factors in HIV-infected children: PERI study. Coronary artery disease. 2008;19:167–72. doi: 10.1097/MCA.0b013e3282f6dffb. [DOI] [PubMed] [Google Scholar]
- 28.Choi AI, Lo JC, Mulligan K, et al. Association of vitamin D insufficiency with carotid intima-media thickness in HIV-infected persons. Clin Infect Dis. 2011;52:941–4. doi: 10.1093/cid/ciq239. [DOI] [PMC free article] [PubMed] [Google Scholar]
- 29.Ross AC, Storer N, O’Riordan MA, Dogra V, McComsey GA. Longitudinal changes in carotid intima-media thickness and cardiovascular risk factors in human immunodeficiency virus-infected children and young adults compared with healthy controls. The Pediatric infectious disease journal. 2010;29:634–8. doi: 10.1097/inf.0b013e3181d770c4. [DOI] [PubMed] [Google Scholar]
- 30.Matthews DR, Hosker JP, Rudenski AS, Naylor BA, Treacher DF, Turner RC. Homeostasis model assessment: insulin resistance and beta-cell function from fasting plasma glucose and insulin concentrations in man. Diabetologia. 1985;28:412–9. doi: 10.1007/BF00280883. [DOI] [PubMed] [Google Scholar]
- 31.Holick MF, Binkley NC, Bischoff-Ferrari HA, et al. Evaluation, treatment, and prevention of vitamin D deficiency: an Endocrine Society clinical practice guideline. The Journal of clinical endocrinology and metabolism. 2011;96:1911–30. doi: 10.1210/jc.2011-0385. [DOI] [PubMed] [Google Scholar]
- 32.Institute of Medicine (U.S.) Dietary Reference Intakes for Calcium and Vitamin D. The National Academies Press; Washington, DC: 2011. [PubMed] [Google Scholar]
- 33.Pai JK, Pischon T, Ma J, et al. Inflammatory markers and the risk of coronary heart disease in men and women. The New England journal of medicine. 2004;351:2599–610. doi: 10.1056/NEJMoa040967. [DOI] [PubMed] [Google Scholar]
- 34.Ridker PM, Rifai N, Rose L, Buring JE, Cook NR. Comparison of C-reactive protein and low-density lipoprotein cholesterol levels in the prediction of first cardiovascular events. The New England journal of medicine. 2002;347:1557–65. doi: 10.1056/NEJMoa021993. [DOI] [PubMed] [Google Scholar]
- 35.Ridker PM, Rifai N, Pfeffer M, Sacks F, Lepage S, Braunwald E. Elevation of tumor necrosis factor-alpha and increased risk of recurrent coronary events after myocardial infarction. Circulation. 2000;101:2149–53. doi: 10.1161/01.cir.101.18.2149. [DOI] [PubMed] [Google Scholar]
- 36.Hwang SJ, Ballantyne CM, Sharrett AR, et al. Circulating adhesion molecules VCAM-1, ICAM-1, and E-selectin in carotid atherosclerosis and incident coronary heart disease cases: the Atherosclerosis Risk In Communities (ARIC) study. Circulation. 1997;96:4219–25. doi: 10.1161/01.cir.96.12.4219. [DOI] [PubMed] [Google Scholar]
- 37.O’Leary DH, Polak JF, Wolfson SK, Jr, et al. Use of sonography to evaluate carotid atherosclerosis in the elderly. The Cardiovascular Health Study. CHS Collaborative Research Group. Stroke; a journal of cerebral circulation. 1991;22:1155–63. doi: 10.1161/01.str.22.9.1155. [DOI] [PubMed] [Google Scholar]
- 38.Mora S, Yanek LR, Moy TF, Fallin MD, Becker LC, Becker DM. Interaction of body mass index and framingham risk score in predicting incident coronary disease in families. Circulation. 2005;111:1871–6. doi: 10.1161/01.CIR.0000161956.75255.7B. [DOI] [PubMed] [Google Scholar]
- 39.Huxley R, Barzi F, Woodward M. Excess risk of fatal coronary heart disease associated with diabetes in men and women: meta-analysis of 37 prospective cohort studies. BMJ. 2006;332:73–8. doi: 10.1136/bmj.38678.389583.7C. [DOI] [PMC free article] [PubMed] [Google Scholar]
- 40.Parker J, Hashmi O, Dutton D, et al. Levels of vitamin D and cardiometabolic disorders: systematic review and meta-analysis. Maturitas. 2010;65:225–36. doi: 10.1016/j.maturitas.2009.12.013. [DOI] [PubMed] [Google Scholar]
- 41.Dapena M, Jimenez B, Noguera-Julian A, et al. Metabolic disorders in vertically HIV-infected children: future adults at risk for cardiovascular disease. Journal of pediatric endocrinology & metabolism : JPEM. 2012;25:529–35. doi: 10.1515/jpem-2012-0005. [DOI] [PubMed] [Google Scholar]
- 42.Brown TT, Cole SR, Li X, et al. Antiretroviral therapy and the prevalence and incidence of diabetes mellitus in the multicenter AIDS cohort study. Archives of internal medicine. 2005;165:1179–84. doi: 10.1001/archinte.165.10.1179. [DOI] [PubMed] [Google Scholar]
- 43.Brown TT, Li X, Cole SR, et al. Cumulative exposure to nucleoside analogue reverse transcriptase inhibitors is associated with insulin resistance markers in the Multicenter AIDS Cohort Study. AIDS. 2005;19:1375–83. doi: 10.1097/01.aids.0000181011.62385.91. [DOI] [PubMed] [Google Scholar]
- 44.Geffner ME, Patel K, Miller TL, et al. Factors associated with insulin resistance among children and adolescents perinatally infected with HIV-1 in the pediatric HIV/AIDS cohort study. Hormone research in paediatrics. 2011;76:386–91. doi: 10.1159/000332957. [DOI] [PMC free article] [PubMed] [Google Scholar]
- 45.Bockhorst JL, Ksseiry I, Toye M, et al. Evidence of human immunodeficiency virus-associated lipodystrophy syndrome in children treated with protease inhibitors. The Pediatric infectious disease journal. 2003;22:463–5. [PubMed] [Google Scholar]
- 46.Amaya RA, Kozinetz CA, McMeans A, Schwarzwald H, Kline MW. Lipodystrophy syndrome in human immunodeficiency virus-infected children. The Pediatric infectious disease journal. 2002;21:405–10. doi: 10.1097/00006454-200205000-00011. [DOI] [PubMed] [Google Scholar]
- 47.Carr A, Samaras K, Chisholm DJ, Cooper DA. Abnormal fat distribution and use of protease inhibitors. Lancet. 1998;351:1736. doi: 10.1016/S0140-6736(05)77775-8. [DOI] [PubMed] [Google Scholar]
- 48.Hadigan C, Corcoran C, Basgoz N, Davis B, Sax P, Grinspoon S. Metformin in the treatment of HIV lipodystrophy syndrome: A randomized controlled trial. JAMA : the journal of the American Medical Association. 2000;284:472–7. doi: 10.1001/jama.284.4.472. [DOI] [PubMed] [Google Scholar]
- 49.van Wijk JP, de Koning EJ, Cabezas MC, et al. Comparison of rosiglitazone and metformin for treating HIV lipodystrophy: a randomized trial. Annals of internal medicine. 2005;143:337–46. doi: 10.7326/0003-4819-143-5-200509060-00009. [DOI] [PubMed] [Google Scholar]
- 50.Hadigan C, Yawetz S, Thomas A, Havers F, Sax PE, Grinspoon S. Metabolic effects of rosiglitazone in HIV lipodystrophy: a randomized, controlled trial. Annals of internal medicine. 2004;140:786–94. doi: 10.7326/0003-4819-140-10-200405180-00008. [DOI] [PubMed] [Google Scholar]
- 51.Kim RJ, Rutstein RM. Impact of antiretroviral therapy on growth, body composition and metabolism in pediatric HIV patients. Paediatric drugs. 2010;12:187–99. doi: 10.2165/11532520-000000000-00000. [DOI] [PubMed] [Google Scholar]
- 52.Panel on Antiretroviral Therapy and Medical Management of HIV-Infected Children. [Accessed on September 22, 2012];Guidelines for the Use of Antiretroviral Agents in Pediatric HIV Infection. 2011 Aug 11;:1–268. Available at http://aidsinfo.nih.gov/contentfiles/lvguidelines/PediatricGuidelines.pdf.
- 53.Busti AJ, Bedimo R, Margolis DM, Hardin DS. Improvement in insulin sensitivity and dyslipidemia in protease inhibitor-treated adult male patients after switch to atazanavir/ritonavir. Journal of investigative medicine : the official publication of the American Federation for Clinical Research. 2008;56:539–44. doi: 10.2310/JIM.0b013e3181641b26. [DOI] [PubMed] [Google Scholar]
- 54.van den Bout-van den Beukel CJ, van den Bos M, Oyen WJ, et al. The effect of cholecalciferol supplementation on vitamin D levels and insulin sensitivity is dose related in vitamin D-deficient HIV-1-infected patients. HIV medicine. 2008;9:771–9. doi: 10.1111/j.1468-1293.2008.00630.x. [DOI] [PubMed] [Google Scholar]
- 55.Longenecker CT, Hileman CO, Carman TL, et al. Vitamin D supplementation and endothelial function in vitamin D deficient HIV-infected patients: a randomized placebo-controlled trial. Antivir Ther. 2012;17:613–21. doi: 10.3851/IMP1983. [DOI] [PMC free article] [PubMed] [Google Scholar]
- 56.Boucher BJ, Mannan N, Noonan K, Hales CN, Evans SJ. Glucose intolerance and impairment of insulin secretion in relation to vitamin D deficiency in east London Asians. Diabetologia. 1995;38:1239–45. doi: 10.1007/BF00422375. [DOI] [PubMed] [Google Scholar]
- 57.Isaia G, Giorgino R, Adami S. High prevalence of hypovitaminosis D in female type 2 diabetic population. Diabetes care. 2001;24:1496. doi: 10.2337/diacare.24.8.1496. [DOI] [PubMed] [Google Scholar]
- 58.Szep Z, Guaraldi G, Shah SS, et al. Vitamin D deficiency is associated with type 2 diabetes mellitus in HIV infection. AIDS. 2011;25:525–9. doi: 10.1097/QAD.0b013e328342fdfd. [DOI] [PMC free article] [PubMed] [Google Scholar]
- 59.Wang TT, Tavera-Mendoza LE, Laperriere D, et al. Large-scale in silico and microarray-based identification of direct 1,25-dihydroxyvitamin D3 target genes. Mol Endocrinol. 2005;19:2685–95. doi: 10.1210/me.2005-0106. [DOI] [PubMed] [Google Scholar]
- 60.Lee S, Clark SA, Gill RK, Christakos S. 1,25-Dihydroxyvitamin D3 and pancreatic beta-cell function: vitamin D receptors, gene expression, and insulin secretion. Endocrinology. 1994;134:1602–10. doi: 10.1210/endo.134.4.8137721. [DOI] [PubMed] [Google Scholar]
- 61.Brown TT, McComsey GA. Association between initiation of antiretroviral therapy with efavirenz and decreases in 25-hydroxyvitamin D. Antivir Ther. 2010;15:425–9. doi: 10.3851/IMP1502. [DOI] [PubMed] [Google Scholar]
- 62.Dao CN, Patel P, Overton ET, et al. Low vitamin D among HIV-infected adults: prevalence of and risk factors for low vitamin D Levels in a cohort of HIV-infected adults and comparison to prevalence among adults in the US general population. Clin Infect Dis. 2011;52:396–405. doi: 10.1093/cid/ciq158. [DOI] [PubMed] [Google Scholar]
- 63.Cozzolino M, Vidal M, Arcidiacono MV, Tebas P, Yarasheski KE, Dusso AS. HIV-protease inhibitors impair vitamin D bioactivation to 1,25-dihydroxyvitamin D. AIDS. 2003;17:513–20. doi: 10.1097/00002030-200303070-00006. [DOI] [PubMed] [Google Scholar]
- 64.Lagunova Z, Porojnicu AC, Vieth R, Lindberg FA, Hexeberg S, Moan J. Serum 25-hydroxyvitamin D is a predictor of serum 1,25-dihydroxyvitamin D in overweight and obese patients. The Journal of nutrition. 2011;141:112–7. doi: 10.3945/jn.109.119495. [DOI] [PubMed] [Google Scholar]