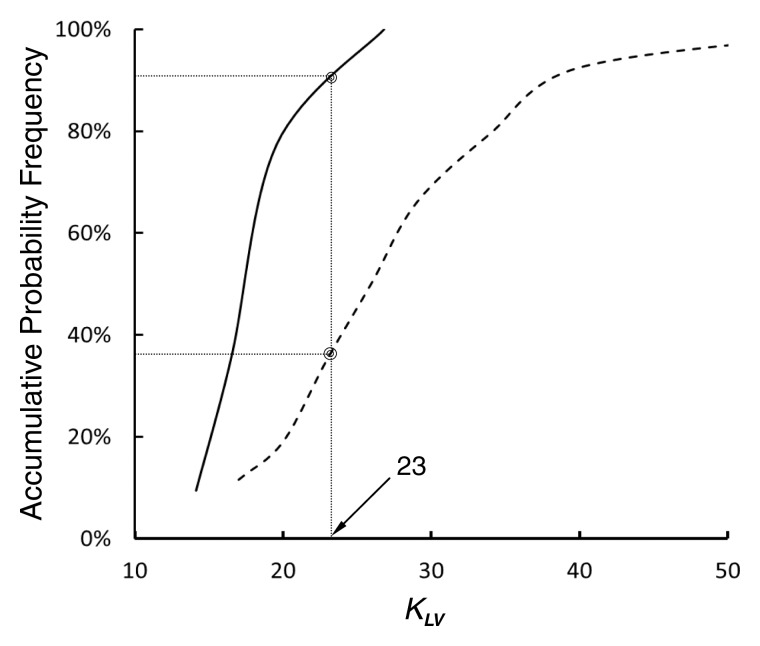
An increase of the coefficient of the coronary vascular length-volume scaling power law (≥23) can be a CT-based diagnostic index of diffuse coronary artery disease.
Abstract
Purpose:
To provide proof of concept for a diagnostic method to assess diffuse coronary artery disease (CAD) on the basis of coronary computed tomography (CT) angiography.
Materials and Methods:
The study was approved by the Cleveland Clinic Institutional Review Board, and all subjects gave informed consent. Morphometric data from the epicardial coronary artery tree, determined with CT angiography in 120 subjects (89 patients with metabolic syndrome and 31 age- and sex-matched control subjects) were analyzed on the basis of the scaling power law. Results obtained in patients with metabolic syndrome and control subjects were compared statistically.
Results:
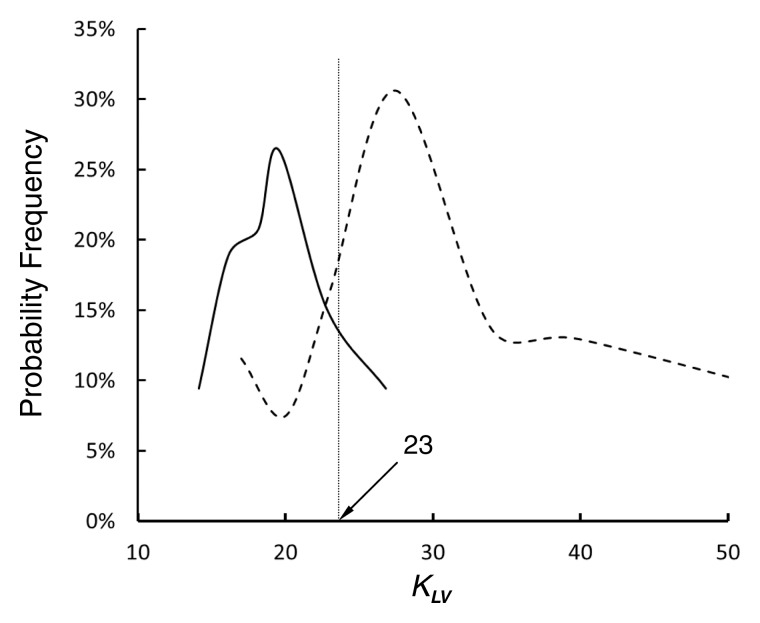
The mean lumen cross-sectional area (ie, lumen cross-sectional area averaged over each vessel of an epicardial coronary artery tree) and sum of intravascular volume in patients with metabolic syndrome (0.039 cm2 ± 0.015 [standard deviation] and 2.71 cm3 ± 1.75, respectively) were significantly less than those in control subjects (0.054 cm2± 0.015 and 3.29 cm3± 1.77, respectively; P < .05). The length-volume power law showed coefficients of 27.0 cm−4/3 ± 9.0 (R2 = 0.91 ± 0.08) for patients with metabolic syndrome and 19.9 cm−4/3 ± 4.3 (R2 = 0.92 ± 0.07) for control subjects (P < .05). The probability frequency shows that more than 65% of patients with metabolic syndrome had a coefficient of 23 or more for the length-volume scaling power law, whereas approximately 90% of the control subjects had a coefficient of less than 23.
Conclusion:
The retrospective scaling analysis provides a quantitative rationale for diagnosis of diffuse CAD.
© RSNA, 2013
Supplemental material: http://radiology.rsna.org/lookup/suppl/doi:10.1148/radiol.13122181/-/DC1
Introduction
Diffuse coronary artery disease (CAD) without severe segmental stenosis is a substrate for plaque rupture (1–3). Hence, diffuse CAD is associated with unstable coronary syndromes or myocardial infarctions, which have significant clinical implications (4–6). In contrast to severe segmental stenosis, diffuse CAD is difficult to diagnose angiographically given the absence of a “normal” reference vessel (7). Although intravascular ultrasonography (US) has been used to visualize plaque burden in the vessel wall for the diagnosis of diffuse CAD (8,9), it is an interventional tool that requires an invasive procedure. Hence, there is a need for a noninvasive method with which to quantify diffuse CAD.
There have been previous attempts at applying global morphologic features of the coronary artery tree in the assessment of diffuse CAD (7,10,11). Several experimental reports have also documented a direct relationship between coronary artery lumen size and heart weight or distal myocardial bed size (12–18) and between myocardial mass and the cumulative length of the arterial branches that perfuse the region (18,19). On the basis of the principle of minimum energy, we have recently deduced scaling power laws between length and volume and between length and cross-sectional area in an entire tree structure of various organs in different species (20,21). In particular, these scaling power laws have a self-similar nature (20–22), which implies that they can be clinically applied to a partial tree (eg, an epicardial coronary artery tree obtained with angiography, computed tomography [CT], or magnetic resonance [MR] imaging). Hence, we hypothesized that the length-volume scaling power law (ie, scaling relation and power law distribution for the sum of intravascular lengths and volumes in a tree) provides the signature of “normal” vasculature and deviations from which can be used to quantify the extent of diffuse CAD. The purpose of this study was to provide proof of concept for a diagnostic method to assess diffuse CAD on the basis of coronary CT angiography.
Materials and Methods
Study Design
To assess the extent of diffuse CAD, patients with metabolic syndrome (a high-risk population for diffuse CAD) and age- and sex-matched control subjects underwent coronary CT angiography at the Cleveland Clinic between 2007 and 2009. The CT reconstruction and scaling analyses were performed at Indiana University–Purdue University Indianapolis with help from an independent laboratory at Wright State University. The study was approved by the Cleveland Clinic Institutional Review Board, and all subjects gave informed consent.
Patients
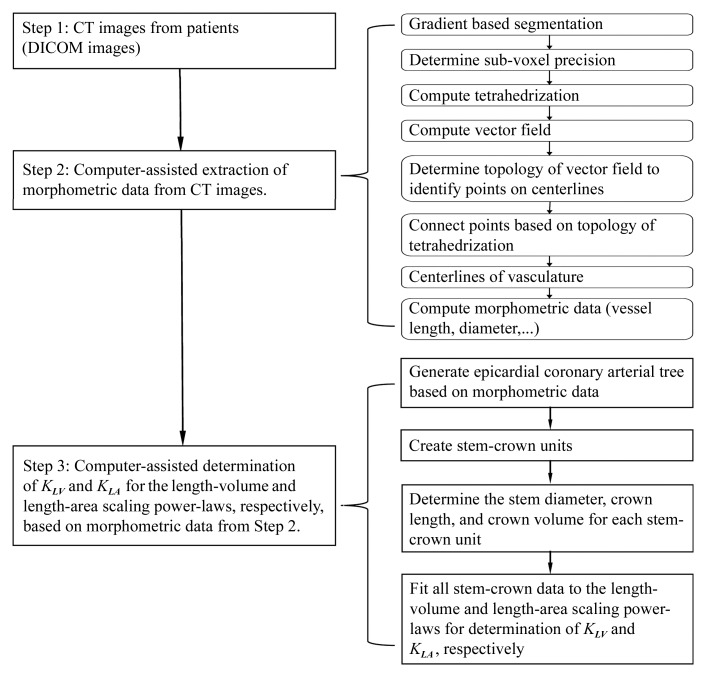
A total of 93 patients who met U.S. National Cholesterol Education Program Adult Treatment Panel III (NCEP III) criteria for metabolic syndrome (23), as well as 31 age- and sex-matched control subjects, were identified and recruited from a large database at the Cleveland Clinic if they had none of the following symptoms: (a) heart rhythm other than sinus rhythm, (b) contraindication to iodinated contrast material, and (c) end-stage renal disease necessitating dialysis. Four subjects with severe segmental stenoses (ie, stenosis diameter >50% or stenosis area >75%) were excluded from the metabolic syndrome group. Hence, we retrospectively evaluated 89 patients with metabolic syndrome (mean age ± standard deviation, 56 years ± 9.2; 52 men [58%]; symptom: cardiac chest pain) and 31 control subjects (mean age, 55 years ± 9; 21 men [58%]; symptom: cardiac chest pain without metabolic syndrome). With use of NCEP III criteria, metabolic syndrome was diagnosed if patients fulfilled at least three of the following conditions: (a) waist circumference of at least 102 cm for men and at least 88 cm for women, (b) triglyceride level of at least 150 mg/dL, (c) high-density lipoprotein level of less than 40 mg/dL for men and less than 50 mg/dL for women, (d) blood pressure of at least 130/85 mm Hg, or (e) fasting plasma glucose level of at least 110 mg/dL. The control subjects, who did not fulfill the NCEP III criteria, underwent coronary CT angiography for the evaluation of cardiac chest pain but had no history of heart attack, angina, or severe segmental stenoses. The control group had a significantly lower body mass index and triglyceride level and a higher high-density lipoprotein level than the metabolic syndrome group. Table 1 summarizes the demographic characteristics for the metabolic syndrome and control groups. Figure 1 shows the imaging acquisition and data analysis protocol.
Table 1.
Baseline Demographics of the Study Population
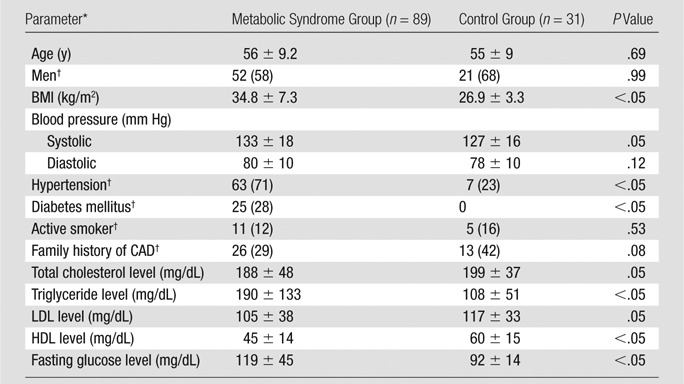
Note.—Except where indicated, data are means ± standard deviations (averaged over the subjects).
BMI = body mass index, HDL = high-density lipoprotein, LDL = low-density lipoprotein.
Data are numbers of subjects, with percentages in parentheses.
Figure 1:
Flowchart of experimental procedures and data analysis. DICOM = Digital Imaging and Communications in Medicine.
Image Acquisition
Electrocardiographic parameters and blood pressures were monitored. Before imaging acquisition, 5 mg of metoprolol was intravenously administered in repeated doses every 5 minutes until the heart rate was 65 beats per minute or less or until a maximum dose of 15 mg was given (mean dose, 10 mg ± 3). If patients had contraindications to β-blockers, they received intravenous administration of 10 mg of diltiazem followed by an additional 5-mg dose every 5 minutes up to a maximum of 20 mg. All patients received a sublingual nitroglycerin tablet (0.4 mg) 3–5 minutes before CT examination.
All studies were performed with a dual-source CT scanner (Siemens Definition; Siemens, Forchheim, Germany). After an initial survey scan was obtained, retrospectively gated contrast material–enhanced CT was performed by injecting 80 mL of iodinated contrast material (iopromide [Ultravist 370; Bayer Healthcare, Morristown, NJ]) via an antecubital vein at 3.5 mL/sec followed by 50 mL of normal saline at the same rate. The scanning parameters were as follows: collimation, 2 × 64 × 0.6 mm; tube voltage, 120 kV; tube current, average 620 mAs adjusted to body size; gantry rotation time, 330 msec; and pitch, 0.2–0.43 depending on heart rate. The entire heart was scanned from the carina to the diaphragm within a single breath hold of approximately 10 seconds. To reduce radiation dose, electrocardiographic pulsing was used to reduce tube current by 80% outside a time window between 30% and 75% of the cardiac cycle.
Images were reconstructed with a section thickness of 0.7 mm in 0.4-mm increments with B26f (a Siemens reconstruction kernel) at a temporal resolution of 83 msec (half scan). The initial data window was positioned at 70% of the R-R interval, with additional data sets reconstructed at ±5% intervals to compensate for motion artifacts in coronary arteries if necessary.
Imaging Analysis
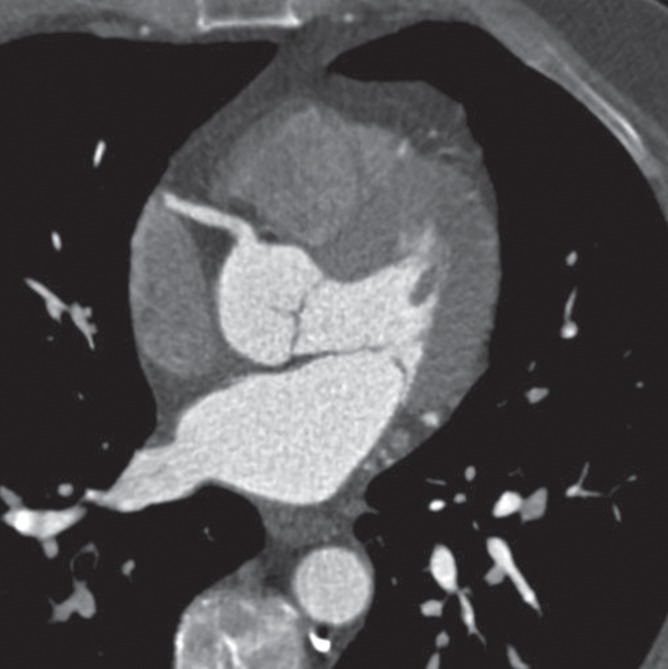
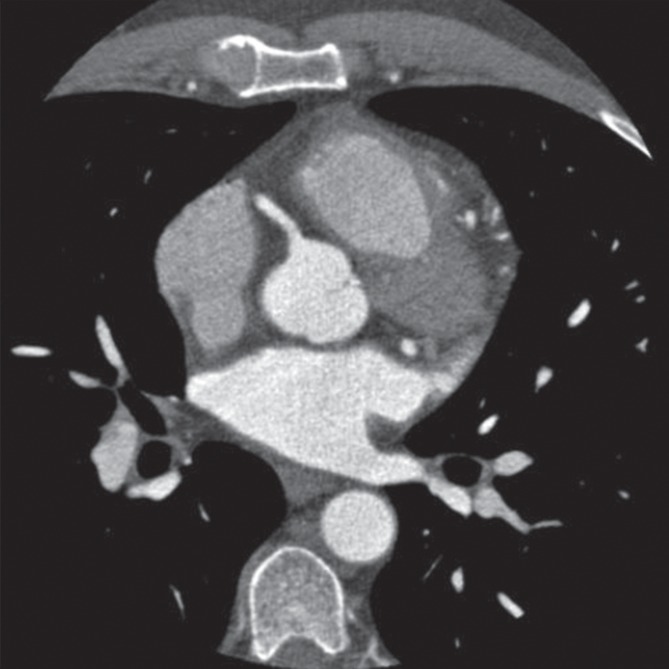
As shown in Figure 2, the morphometric parameters (ie, centerlines, cross-sectional area, and lengths) of the left main coronary artery and right coronary artery trees were extracted from CT angiograms obtained in control subjects and patients with metabolic syndrome by using a validated software algorithm (24,25). Briefly, the algorithm first segmented the vessels within the volumetric image on the basis of the image gradients (Fig 1). To get a more accurate representation of the vessel boundary, the points resulting from the segmentation step were moved along the gradient direction in such a way that they were located at the maximal gradient. This determines the most likely location of the vessel boundary at subvoxel precision and reduces a jagged appearance of the vessel boundary. Thus, it provides a more precise and smoother representation of the boundary than does the use of the original voxel locations. This is important because representation of the boundary at a subvoxel level improves the accuracy of the morphometric measurements. A vector field was then computed in such a way that all vectors were pointing inward to the center of the vessel. On the basis of a tetrahedrization of all the boundary points and their image gradient vectors, a vector field was computed by using a trilinear interpolation. Finally, points on the centerlines were determined with topologic analysis of the vector field within the cross-sectional area of the vessels and connected on the basis of the topology of the tetrahedrization. This provides the centerline at a subvoxel precision, which further contributes to the enhanced accuracy of this approach and results in a precise representation of the centerlines of all vessels within the volumetric image. The algorithm was validated by comparing optical microscope measurements of coronary casts (24). The root mean square error between optical and CT measurements was 0.16 mm (<10% of the mean value), with an average deviation of 0.13 mm (24).
Figure 2a:
Epicardial coronary artery trees in patient with metabolic syndrome and control subject. (a, b) Axial CT scans in patient with metabolic syndrome (a) and control subject (b) and (c, d) corresponding schematic representations of reconstructed artery trees.
Figure 2b:
Epicardial coronary artery trees in patient with metabolic syndrome and control subject. (a, b) Axial CT scans in patient with metabolic syndrome (a) and control subject (b) and (c, d) corresponding schematic representations of reconstructed artery trees.
Figure 2c:
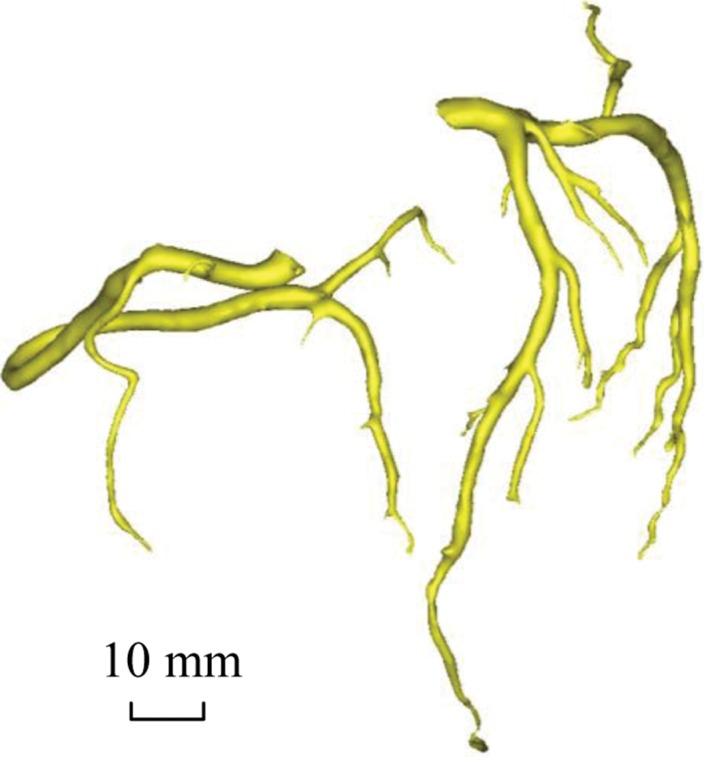
Epicardial coronary artery trees in patient with metabolic syndrome and control subject. (a, b) Axial CT scans in patient with metabolic syndrome (a) and control subject (b) and (c, d) corresponding schematic representations of reconstructed artery trees.
Figure 2d:
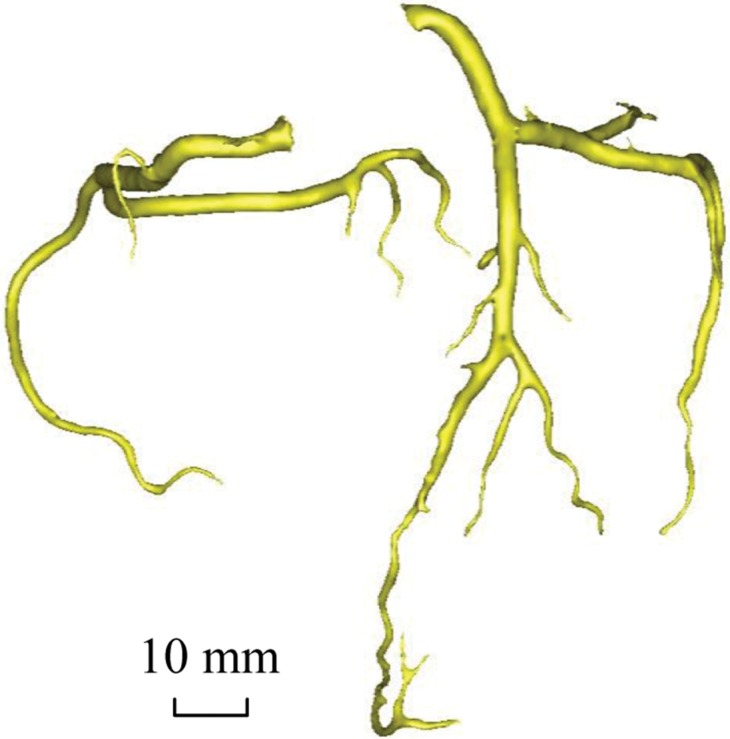
Epicardial coronary artery trees in patient with metabolic syndrome and control subject. (a, b) Axial CT scans in patient with metabolic syndrome (a) and control subject (b) and (c, d) corresponding schematic representations of reconstructed artery trees.
Scaling Power Laws
We defined a vessel segment as a stem and the tree distal to the stem as a crown, as shown in Figure E1 (online). The epicardial coronary artery tree has many stem-crown units. On the basis of the principle of minimum energy (20–22), we derived the length-volume scaling power law as follows:
where KLV is a constant (in cm−4/3) and Lc and Vc are the crown length (in centimeters) and crown volume (in cubic centimeters), respectively. The mathematic derivation of Equation [1] is provided in Appendix E1 (online). The length-volume scaling power law of Equation [1] represents the relationship between the total length and the total intravascular volume in a stem-crown system of the epicardial coronary artery tree (Fig E1 [online]). Furthermore, the length-area scaling power law is given as follows:
where KLA is a constant (in cm−4/3) and AS the cross-sectional area of the stem (in square centimeters) in a stem-crown unit (Fig E1 [online]). The length-area scaling power law of Equation [2] represents the relationship between the total length of each vessel and the stem cross-sectional area in the stem-crown system of the epicardial coronary artery tree.
We determined the coefficients KLV and KLA of the two scaling power laws for the epicardial coronary artery tree reconstructed from CT angiograms in each subject in the metabolic syndrome and control groups. Briefly, the centerlines formed the skeleton of the epicardial coronary artery tree, which stretched over a consecutive sequence of vessel segments (Fig 1). The mother and daughter vessels were labeled and indexed. The stem-crown system was then generated in the epicardial coronary artery tree. Finally, we determined the following parameters: (a) both coefficient K0 and exponent X in a power law relation M = K0 ⋅ YX (defined as a two-parameter model) and (b) coefficient K with exponent X equal to the theoretic value (ie, 7/9 in Eq [1] and 7/6 in Eq [2]) in a power law relation M = K ⋅ Ytheoretic value (defined as a one-parameter model) with a least-square fit of all stem-crown units in an epicardial coronary artery tree to the corresponding power laws.
Data Analysis
The mean and standard deviation were computed by averaging over all epicardial coronary artery trees in each group. The coefficient of variation ([standard deviation/mean] × 100%) was also calculated in the one-parameter model. The two-sample Student t test (Excel 2010; Microsoft, Redmond, Wash) was used to compare coefficients and exponents in the metabolic syndrome group with those in the control group. P < .05 was indicative of a statistically significant difference.
For patients with metabolic syndrome and control subjects, we defined the probability frequency as (number of patients for Ki < K < Ki + 1/total number of patients) × 100% (where K0 = Kminimum, Ki < Ki + 1, and KN = Kmaximum, i = 0…N − 1) and plotted the probability frequency as a function of K. We also defined the accumulative probability frequency as (number of patients for K < Ki + 1/total number of patients) × 100% and plotted the accumulative probability frequency versus coefficient K.
Results
Table 2 shows morphometric data from the reconstructed epicardial coronary arteries in the metabolic syndrome and control groups. The mean lumen cross-sectional area (averaged over each vessel in a tree structure) and the sum of intravascular volume in epicardial coronary artery trees were significantly different between the metabolic syndrome and control groups (P < .05); however, there was no significant difference in the cross-sectional area at the inlet of the coronary artery trees (P = .96) and the sum of vessel length (P = .19).
Table 2.
Morphometric Data Reconstructed from CT Angiography

Note.—Maximum As = cross-sectional area at the inlet of the coronary artery tree (ie, left main coronary artery or right coronary artery), mean As = mean cross-sectional area averaged over vessels of the entire epicardial coronary artery tree, maximum Lc = sum of vessel length of the entire epicardial coronary artery tree, maximum Vc = sum of intravascular volume of the entire epicardial coronary artery tree.
Data are means ± standard deviations (averaged over arterial trees).
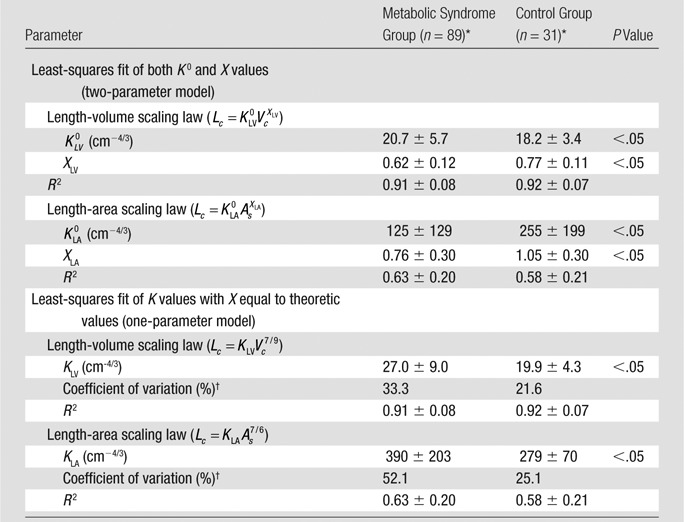
Table 3 summarizes the mean (averaged over individual patients) coefficients and exponents for the length-volume (Eq [1]) and length-area (Eq [2]) scaling power laws, demonstrating a significant difference between metabolic syndrome and control groups (P < .05). Moreover, the least-square fit of all the measurements to the one-parameter model for the length-volume and length-area scaling power laws results in KLV values of 26.6 cm−4/3 (R2 = 0.85) and 19.9 cm−4/3 (R2 = 0.88) and KLA values of 363 cm−4/3 (R2 = 0.50) and 278 cm−4/3 (R2 = 0.55) for metabolic syndrome and control groups, respectively, where |[26.6 + 19.9]/2| = 23. Coefficients KLV and KLA in the one-parameter model are significantly increased in the metabolic syndrome group compared with the control group.
Table 3.
Coefficients and Exponents for the Length-Volume and Length-Area Scaling Power Laws in Epicardial Coronary Artery Trees of Metabolic Syndrome and Control Groups
Data are means ± standard deviations (averaged over arterial trees).
The coefficient of variation was calculated as follows: (standard deviation/mean) × 100%.
In comparison with the length-area scaling power law, the length-volume scaling power law fits well to CT data (R2 > 0.9, Table 3). Moreover, Figure 3 shows the probability frequency as a function of coefficient KLV, and Figure 4 shows the accumulative probability frequency as a function of coefficient KLV in the length-volume scaling power law. The two figures imply that approximately 90% of patients in the control group had a KLV of less than 23 cm−4/3 and that more than 65% of patients in the metabolic syndrome group had a KLV of 23 cm−4/3 or greater.
Figure 3:
Graph shows probability frequency as function of coefficient KLV (in cm−4/3) in the one-parameter model of length-volume scaling power law. Solid and dashed lines = control and metabolic syndrome groups, respectively. Because least-square fit of all measurements to one-parameter model for length-volume scaling power law results in KLV values of 26.6 cm−4/3 (R2 = 0.85) and 19.9 cm−4/3 (R2 = 0.88) for metabolic syndrome and control groups, respectively, the mean value of 23 cm−4/3 (|[26.6/19.9]/2|) was selected as a demarcation value between the two groups.
Figure 4:
Graph shows accumulative probability frequency as function of coefficient KLV (in cm−4/3) in the one-parameter model of length-volume scaling power law. Solid and dashed lines = control and metabolic syndrome groups, respectively.
Discussion
The major finding of this study is that patients with metabolic syndrome who have a higher predilection to diffuse CAD had significantly increased KLV values of the length-volume scaling power law.
Morphometry of Epicardial Coronary Artery Trees
Coronary atherosclerosis is usually diffuse along the length of large arteries (7,26). Herein, we reconstructed epicardial coronary artery trees from CT angiograms in patients with metabolic syndrome and control subjects. In general, metabolic syndrome precedes the onset of full-blown diabetes but has a similar, albeit lesser, effect on the growth of plaque (27). The morphometric data showed no severe segmental stenoses in the two groups. The mean lumen cross-sectional area (ie, lumen cross-sectional area averaged over vessels of the entire epicardial coronary artery tree) in patients with metabolic syndrome was 28% smaller than that in the control subjects. Given similar inlet cross-sectional areas, the decrease of mean lumen cross-sectional area in patients with metabolic syndrome was the result of a decrease of lumen cross-sectional area in distal coronary arteries. Moreover, the sum of intravascular volume of the entire epicardial coronary artery tree was reduced by 18%. The decrease of mean cross-sectional area and sum of intravascular volume reflected the extent of diffuse disease in the epicardial coronary artery tree of patients with metabolic syndrome.
Scaling Power Laws
We theoretically derived the length-volume and length-area scaling power laws in the stem-crown system of the epicardial coronary artery tree. The length-volume and length-area scaling power laws have theoretic exponents of 7/9 = 0.78 and 7/6 = 1.17, respectively. From the quantitative coronary arteriographic analysis of coronary artery trees, Seiler et al (7) showed an exponent of 1.22 for the length-area scaling power law, which is consistent with the theoretic prediction (4.5% difference from theoretic value). In a CT angiography analysis, Craiem et al (28) supported the length-volume scaling power law but showed an exponent of 2.28 (94.9% difference from theoretic value) for the length-area scaling power law in healthy patients. If a single terminal vessel was considered as a stem-crown unit (which occupies more than half of the total stem-crown numbers and predominates the exponent of the length-area scaling power law), then such a large exponent is expected. Unfortunately, this violates the concept of crown because the minimal crown is comprised of a bifurcation and a single terminal vessel is not a stem-crown unit. Moreover, most terminal vessels have an unknown truncated length and should not be considered in the analysis. When the correct stem-crown unit was adopted, we found a length-volume exponent of 0.77 ± 0.11 and length-area exponent of 1.05 ± 0.30 for subjects in the control group, which agree well with the theoretic predictions. Therefore, the results of CT angiography and quantitative coronary arteriography analysis support the theoretic predictions for the length-volume and length-area scaling power laws in the normal human epicardial coronary artery tree.
Scaling Diagnosis of Diffuse CAD
Patients with metabolic syndrome demonstrated a significant deviation of both exponents and coefficients in the two-parameter model from those of the control group for the length-volume and length-area scaling power laws. To eliminate the potential interaction of the exponent and coefficient in power law, we combined the two-parameter model into the one-parameter model and only determined KLV and KLA with the exponents equal to the corresponding theoretic values. There were significant differences of KLV and KLA between metabolic syndrome and control groups in the one-parameter model.
The least-square fit of CT data to the length-volume scaling power law showed a higher correlation coefficient (R2 = 0.91 ± 0.08 for the metabolic syndrome group and 0.92 ± 0.07 for the control group) and a lower coefficient of variation (33.3% for the metabolic syndrome group and 21.6% for the control group) compared with the fit to the length-area scaling power law. This can be explained by the integrated properties of both crown volume and crown length (ie, the sum of the intravascular volume or the length of each vessel segment in a crown). Hence, we selected the length-volume scaling power law in the one-parameter model as the index of diffuse CAD. Because the least-square fit of all the measurements to the one-parameter model for the length-volume scaling power law resulted in KLV values of 26.6 cm−4/3 (R2 = 0.85) and 19.9 cm−4/3 (R2 = 0.88) for metabolic syndrome and control groups, respectively, the mean value of 23 cm−4/3 (|[26.6 + 19.9]/2|) was selected as a demarcation value between patient groups. Moreover, results of frequency analysis showed that more than 65% of patients with metabolic syndrome had a KLV of 23 cm−4/3 or greater, whereas approximately 90% of control subjects had a KLV of less than 23 cm−4/3. Hence, KLV ≥ 23 cm−4/3 in Equation [1] is a good index for the diagnosis of diffuse CAD in patients.
To rule out the effect of number of patients who differed significantly between the two groups (89 patients with metabolic syndrome vs 31 control subjects), the same number of patients and control subjects was randomly selected to calculate KLV. The KLV values vary in the range of 25–31 in the one-parameter model. This further supports the diffuse CAD index of KLV ≥ 23 cm−4/3.
Study Limitations
Although it has been suggested that severe segmental stenosis does not affect the scaling power laws (28), the combined effect of segmental stenosis and diffuse CAD remains unknown. Future studies are needed to determine at what point the scaling power laws no longer hold during the progression of disease severity (segmental stenosis). Once severe stenosis is present, however, the diagnosis of diffuse CAD with coronary CT angiography may become less clinically relevant.
Coronary artery spasm can also lead to diffuse coronary narrowing (29). In contrast to invasive procedures (29), CT angiography seldom results in coronary artery spasm because the contrast material is injected via an intravenous line. Hence, the effect of diffuse coronary artery spasm on the scaling diagnosis of diffuse CAD is likely negligible. Furthermore, smaller intramyocardial arteries that are less accurately determined with CT angiography were not considered given their lack of atherosclerosis (30).
Although the results of this retrospective study showed that a significant decrease of mean lumen cross-sectional area and sum of intravascular volume implied the presence of diffuse disease in the epicardial coronary artery tree of patients with metabolic syndrome, future studies are necessary to validate diffuse disease with intravascular US. Furthermore, prospective studies should be carried out to investigate the relationship between the length-volume scaling power law and the progression of diffuse CAD. Herein, we only showed a proof of concept that a scaling power law analysis confirmed a greater probability of disease in a cohort of patients with a higher risk of diffuse CAD than in a normal cohort.
In conclusion, this study provided a clinical rationale for the noninvasive diagnosis of diffuse CAD and warrants future prospective clinical trials.
Advance in Knowledge.
• CT-determined morphometric parameters in patients with metabolic syndrome were significantly different from those in control subjects; CT-based scaling analysis showed that more than 65% of patients with metabolic syndrome had a coefficient of at least 23 for the coronary vascular length-volume scaling power law, whereas approximately 90% of the control subjects had a coefficient of less than 23.
Implication for Patient Care.
• The results of this retrospective study suggest that an increase of coefficient of the coronary vascular length-volume scaling power law (≥23) can be a CT-based diagnostic index of diffuse coronary artery disease.
Disclosures of Conflicts of Interest: Y.H. No relevant conflicts of interest to disclose. T.W. No relevant conflicts of interest to disclose. J.S.C. No relevant conflicts of interest to disclose. S.S. No relevant conflicts of interest to disclose. J.L.N. No relevant conflicts of interest to disclose. S.D.T. Financial activities related to the present article: none to disclose. Financial activities not related to the present article: owns stock/stock options in 3DR. Other relationships: none to disclose. D.L.B. Financial activities related to the present article: none to disclose. Financial activities not related to the present article: is on the advisory board for Medscape Cardiology; institution has grants or grants pending with Amarin, AstraZeneca, Bristol-Myers Squibb, Eisai, Ethicon, Medtronic, Sanofi Aventis, and The Medicines Company; receives payment for development of educational presentations from WebMD; is paid by Slack Publications to be chief medical editor. Other relationships: none to disclose. G.S.K. No relevant conflicts of interest to disclose.
Supplementary Material
Received September 17, 2012; revision requested November 23; revision received December 17; accepted January 7, 2013; final version accepted February 5.
Y.H. supported in part by American Heart Association Scientist Development Grant 0830181N.
Current address: Department of Cardiology, Sri Sathya Sai Institute of Higher Medical Sciences, Bangalore, India.
Funding: This research was supported by the National Institutes of Health (grant HL-092048).
Abbreviations:
- CAD
- coronary artery disease
- NCEP III
- National Cholesterol Education Program Adult Treatment Panel III
References
- 1.Hawranek M, Gasior M, Gierlotka M, et al. Progression of coronary artery atherosclerosis after acute myocardial infarction: an angiographic study. J Invasive Cardiol 2010;22(5):209–215 [PubMed] [Google Scholar]
- 2.Little WC, Constantinescu M, Applegate RJ, et al. Can coronary angiography predict the site of a subsequent myocardial infarction in patients with mild-to-moderate coronary artery disease? Circulation 1988;78(5 Pt 1):1157–1166 [DOI] [PubMed] [Google Scholar]
- 3.Yokoya K, Takatsu H, Suzuki T, et al. Process of progression of coronary artery lesions from mild or moderate stenosis to moderate or severe stenosis: a study based on four serial coronary arteriograms per year. Circulation 1999;100(9):903–909 [DOI] [PubMed] [Google Scholar]
- 4.Falk E, Shah PK, Fuster V. Coronary plaque disruption. Circulation 1995;92(3):657–671 [DOI] [PubMed] [Google Scholar]
- 5.Farb A, Tang AL, Burke AP, Sessums L, Liang Y, Virmani R. Sudden coronary death: frequency of active coronary lesions, inactive coronary lesions, and myocardial infarction. Circulation 1995;92(7):1701–1709 [DOI] [PubMed] [Google Scholar]
- 6.Libby P. Molecular bases of the acute coronary syndromes. Circulation 1995;91(11):2844–2850 [DOI] [PubMed] [Google Scholar]
- 7.Seiler C, Kirkeeide RL, Gould KL. Basic structure-function relations of the epicardial coronary vascular tree: basis of quantitative coronary arteriography for diffuse coronary artery disease. Circulation 1992;85(6):1987–2003 [DOI] [PubMed] [Google Scholar]
- 8.Nissen SE, Gurley JC, Grines CL, et al. Intravascular ultrasound assessment of lumen size and wall morphology in normal subjects and patients with coronary artery disease. Circulation 1991;84(3):1087–1099 [DOI] [PubMed] [Google Scholar]
- 9.Tobis JM, Mallery J, Mahon D, et al. Intravascular ultrasound imaging of human coronary arteries in vivo: analysis of tissue characterizations with comparison to in vitro histological specimens. Circulation 1991;83(3):913–926 [DOI] [PubMed] [Google Scholar]
- 10.Seiler C, Kirkeeide RL, Gould KL. Measurement from arteriograms of regional myocardial bed size distal to any point in the coronary vascular tree for assessing anatomic area at risk. J Am Coll Cardiol 1993;21(3):783–797 [DOI] [PubMed] [Google Scholar]
- 11.Wahle A, Wellnhofer E, Mugaragu I, Saner HU, Oswald H, Fleck E. Assessment of diffuse coronary artery disease by quantitative analysis of coronary morphology based upon 3-D reconstruction from biplane angiograms. IEEE Trans Med Imaging 1995;14(2):230–241 [DOI] [PubMed] [Google Scholar]
- 12.Huikuri HV, Jokinen V, Syvänne M, et al. Heart rate variability and progression of coronary atherosclerosis. Arterioscler Thromb Vasc Biol 1999;19(8):1979–1985 [DOI] [PubMed] [Google Scholar]
- 13.Koiwa Y, Bahn RC, Ritman EL. Regional myocardial volume perfused by the coronary artery branch: estimation in vivo. Circulation 1986;74(1):157–163 [DOI] [PubMed] [Google Scholar]
- 14.Lewis BS, Gotsman MS. Relation between coronary artery size and left ventricular wall mass. Br Heart J 1973;35(11):1150–1153 [DOI] [PMC free article] [PubMed] [Google Scholar]
- 15.O’Keefe JH, Jr, Owen RM, Bove AA. Influence of left ventricular mass on coronary artery cross-sectional area. Am J Cardiol 1987;59(15):1395–1397 [DOI] [PubMed] [Google Scholar]
- 16.Roberts CS, Roberts WC. Cross-sectional area of the proximal portions of the three major epicardial coronary arteries in 98 necropsy patients with different coronary events: relationship to heart weight, age and sex. Circulation 1980;62(5):953–959 [DOI] [PubMed] [Google Scholar]
- 17.Molloi S, Zhou Y, Kassab GS. Regional volumetric coronary blood flow measurement by digital angiography: in vivo validation. Acad Radiol 2004;11(7):757–766 [DOI] [PubMed] [Google Scholar]
- 18.Choy JS, Kassab GS. Scaling of myocardial mass to flow and morphometry of coronary arteries. J Appl Physiol 2008;104(5):1281–1286 [DOI] [PMC free article] [PubMed] [Google Scholar]
- 19.Page HL, Jr, Engel HJ. Angiographic estimation of relative coronary artery flow based on terminal branching patterns. Cathet Cardiovasc Diagn 1975;1(1):71–79 [DOI] [PubMed] [Google Scholar]
- 20.Huo Y, Kassab GS. A scaling law of vascular volume. Biophys J 2009;96(2):347–353 [DOI] [PMC free article] [PubMed] [Google Scholar]
- 21.Huo Y, Kassab GS. Intraspecific scaling laws of vascular trees. J R Soc Interface 2012;9(66):190–200 [DOI] [PMC free article] [PubMed] [Google Scholar]
- 22.Huo Y, Kassab GS. The scaling of blood flow resistance: from a single vessel to the entire distal tree. Biophys J 2009;96(2):339–346 [DOI] [PMC free article] [PubMed] [Google Scholar]
- 23.Expert Panel on Detection, Evaluation, and Treatment of High Blood Cholesterol in Adults. Executive summary of the third report of the National Cholesterol Education Program (NCEP) Expert Panel on Detection, Evaluation, and Treatment of High Blood Cholesterol In Adults (Adult Treatment Panel III). JAMA 2001;285(19):2486–2497 [DOI] [PubMed] [Google Scholar]
- 24.Wischgoll T, Choy JS, Ritman EL, Kassab GS. Validation of image-based method for extraction of coronary morphometry. Ann Biomed Eng 2008;36(3):356–368 [DOI] [PubMed] [Google Scholar]
- 25.Wischgoll T, Choy JS, Kassab GS. Extraction of morphometry and branching angles of porcine coronary arterial tree from CT images. Am J Physiol Heart Circ Physiol 2009;297(5):H1949–H1955 [DOI] [PMC free article] [PubMed] [Google Scholar]
- 26.Porter TR, Sears T, Xie F, et al. Intravascular ultrasound study of angiographically mildly diseased coronary arteries. J Am Coll Cardiol 1993;22(7):1858–1865 [DOI] [PubMed] [Google Scholar]
- 27.Yavuz B, Kabakci G, Aksoy H, et al. Determining the relationship between metabolic syndrome score and angiographic severity of coronary artery disease. Int J Clin Pract 2008;62(5):717–722 [DOI] [PubMed] [Google Scholar]
- 28.Craiem D, Casciaro ME, Graf S, Gurfinkel EP, Armentano RL. Non-invasive assessment of allometric scaling power-laws in the human coronary tree. Artery Res 2011;5(1):15–23 [Google Scholar]
- 29.Brott BC, Anayiotos AS, Chapman GD, Anderson PG, Hillegass WB. Severe, diffuse coronary artery spasm after drug-eluting stent placement. J Invasive Cardiol 2006;18(12):584–592 [PubMed] [Google Scholar]
- 30.Ross R. Atherosclerosis—an inflammatory disease. N Engl J Med 1999;340(2):115–126 [DOI] [PubMed] [Google Scholar]
Associated Data
This section collects any data citations, data availability statements, or supplementary materials included in this article.


