

Fractional kidney hypoxia correlated inversely with renal blood flow, cortical or medullary perfusion, and glomerular filtration rate in human subjects with essential hypertension and atherosclerotic renovascular disease; whether these estimates will allow the clinician to quantify the severity of vascular occlusive kidney disease and predict renal functional response (eg, beyond revascularization of atherosclerotic renal artery stenosis) merits further investigation.
Abstract
Purpose:
To test the hypothesis that fractional kidney hypoxia, measured by using blood oxygen level–dependent (BOLD) magnetic resonance (MR) imaging, correlates with renal blood flow (RBF), tissue perfusion, and glomerular filtration rate (GFR) in patients with atherosclerotic renal artery stenosis (RAS) better than regionally selected region of interest–based methods.
Materials and Methods:
The study was approved by the institutional review board according to a HIPAA-compliant protocol, with written informed consent. BOLD MR imaging was performed in 40 patients with atherosclerotic RAS (age range, 51–83 years; 22 men, 18 women) and 32 patients with essential hypertension (EH) (age range, 26–85 years; 19 men, 13 women) during sodium intake and renin-angiotensin blockade. Fractional kidney hypoxia (percentage of entire axial image section with R2* above 30 sec−1) and conventional regional estimates of cortical and medullary R2* levels were measured. Stenotic and nonstenotic contralateral kidneys were compared for volume, tissue perfusion, and blood flow measured with multidetector computed tomography. Statistical analysis was performed (paired and nonpaired t tests, linear regression analysis).
Results:
Stenotic RBF was reduced compared with RBF of contralateral kidneys (225.2 mL/min vs 348 mL/min, P = .0003). Medullary perfusion in atherosclerotic RAS patients was lower than in EH patients (1.07 mL/min per milliliter of tissue vs 1.3 mL/min per milliliter of tissue, P = .009). While observer-selected cortical R2* (18.9 sec−1 [stenosis] vs 18.5 sec−1 [EH], P = .07) did not differ, fractional kidney hypoxia was higher in stenotic kidneys compared with kidneys with EH (17.4% vs 9.6%, P < .0001) and contralateral kidneys (7.2%, P < .0001). Fractional hypoxia correlated inversely with blood flow (r = −0.34), perfusion (r = −0.3), and GFR (r = −0.32).
Conclusion:
Fractional tissue hypoxia rather than cortical or medullary R2* values used to assess renal BOLD MR imaging demonstrated a direct relationship to chronically reduced blood flow and GFR.
© RSNA, 2013
Supplemental material: http://radiology.rsna.org/lookup/suppl/doi:10.1148/radiol.13122234/-/DC1
Introduction
Developing functional imaging tools to evaluate the renal circulation has been daunting. The kidney normally is highly perfused, exhibits the highest rate of blood flow per weight, and has the smallest arteriovenous differences in oxygen saturation of any organ, consistent with limited overall net oxygen consumption (1,2). By these criteria, the kidney is abundantly oxygenated, as compared with other organs. An equally striking feature, however, is the nonuniformity of tissue oxygenation within the kidney. Under normal conditions, a large corticomedullary oxygen gradient develops within the renal parenchyma as a result of the substantial differences in both blood supply and oxygen consumption between the renal cortex and medulla (3,4).
Atherosclerotic renal artery stenosis (RAS) is common and often reduces perfusion pressure and blood flow to the affected kidney. The degree to which reduced blood flow to cortical or medullary segments in humans leads to a reduction in tissue oxygenation and/or increased overall oxygen consumption is not well understood, despite the convention of labeling this disorder ischemic nephropathy (5,6). Blood oxygen level–dependent (BOLD) magnetic resonance (MR) imaging can provide a means to monitor changes in intrarenal oxygenation in a noninvasive fashion (7). BOLD MR can depict changes in kidney oxygen consumption secondary to physiologic and pathophysiologic challenges without exposure to radiation or intravascular contrast agents. BOLD MR–derived assessment of renal oxygenation usually has been expressed by measurement of the relaxivity (R2*) of water protons within the kidney.
R2* describes the rate at which the phase coherence of magnetization in the transverse plane is lost following an initial radiofrequency pulse and is the inverse of the characteristic relaxation time T2*. In initial clinical studies (8–10), researchers established the convention of defining cortical and medullary R2* levels separately.
Despite the appeal of applying BOLD MR imaging to real-time evaluation of tissue oxygenation in human subjects, interpretation of BOLD MR data related to disease processes has been challenging. Investigators in few studies address directly how to most appropriately define and register tissue volumes and how to express the level of oxygenation in quantitative terms. Most often, images are sampled within a 5–8-mm-thick axial, sagittal, or coronal section. On the basis of the T2*-weighted images available, regions of interest (ROIs) within the cortex and medulla are defined and a single average R2* value for each region is determined, either from a single section or as the average of several samples and/or sections (9–13). All of these methods reflect a propensity to assign a single “best” or “mean” value for R2* that reflects either cortex or medulla. However, this paradigm may be overly simplistic for some applications, particularly within the medulla. The levels of R2* vary gradually along a gradient from the cortex to the medulla, finally reaching a “most hypoxic” zone, usually in the deepest sections of medullary pyramids (14). Hence, the precision and reproducibility of R2* values will be affected by the size and location of the ROI. Larger ROIs that include the entire medullary compartments may provide more representative and less variable mean values but often include multiple medullary and corticomedullary overlap zones with different hemodynamics (15). Small, selective ROIs are less vulnerable to volume averaging but may be skewed by fluctuations caused by spatial and temporal heterogeneity in oxygen distribution within the kidney, particularly in the medulla (14). The overall aim of this study was to assess a different analytic method with use of BOLD MR imaging to evaluate “fractional kidney hypoxia” that does not require selection of localized individual ROIs within each region or the assumption of a single R2* level over the entire medullary gradient. We sought to test the hypothesis that fractional kidney hypoxia, as determined with BOLD MR imaging, correlates with renal blood flow (RBF), tissue perfusion, and glomerular filtration rate (GFR) in patients with atherosclerotic RAS better than regionally selected ROI-based methods.
Materials and Methods
Patients
This prospective study was approved by the institutional review board utilizing a Health Insurance Portability and Accountability Act–compliant protocol. Informed, written consent was obtained. Patients identified with essential hypertension (EH) (n = 32, 19 men and 13 women; age range, 26–85 years) and atherosclerotic RAS (n = 40, 22 men and 18 women; age range, 51–83 years) from January 2008 to August 2012 participated in this study during a 3-day inpatient protocol in the clinical research unit, as previously described (15). Dietary intake was regulated at 150 mEq of sodium per day, with an isocaloric diet prepared on site. Patients with qualifying RAS with cross-sectional luminal occlusion of at least 60% were identified by using criteria similar to those stipulated for recruitment in the Cardiovascular Outcomes in Renal Atherosclerotic Lesions Trial (16). Severity of RAS was estimated by using Doppler ultrasonographic measurements in the affected artery and quantitative vascular imaging by using computed tomographic (CT) images. In the RAS group, two extremely atrophic kidneys were excluded. Three additional kidneys in the RAS group (contralateral kidneys) were removed from the BOLD MR analysis because of imaging artifacts due to air-filled colon loops or motion and respiratory artifacts, leaving 75 kidneys (RAS) available for BOLD MR analysis. In four cases, high grade-stenoses (more than 60% lumen occlusion) were present in both kidneys, leaving 44 stenotic and 31 contralateral kidneys. In the EH group, two kidneys were excluded, one because of multiple cysts and the other because of increased susceptibility artifacts, leaving 62 kidneys (EH) available for BOLD MR analysis. Patients continued previous medications, and all received agents blocking the renin-angiotensin system (angiotensin-converting enzyme inhibitors or angiotensin-receptor blockers).
The 1st day of the study included measurement of sodium excretion and of GFR by using iothalamate clearance (iothalamate meglumine, Conray; Mallinckrodt, St Louis, Mo) (17,18). Single-kidney GFR was determined by apportioning the measured iothalamate clearance by using percentage of blood flow for each kidney.
MR Imaging and BOLD Methods
On the 2nd day, BOLD MR imaging examinations were performed with a 3.0-T system (Twin Speed Signa Excite; GE Medical Systems, Waukesha, Wis) by using a 12-channel torso phased-array coil (15). Three-plane single-shot fast spin-echo localizer sequences were performed during suspended respiration followed by acquisition of additional scout images (single-shot fast spin-echo images) oriented parallel to the long axis of each kidney. These long-axis scout images were then used to prescribe transverse BOLD MR images in a plane orthogonal to the long axis. BOLD MR imaging consisted of a two-dimensional fast spoiled gradient-echo sequence with multiple echo times. Twelve echoes were obtained for each section location, with echo times ranging from 2.5 to 50.0 msec. Imaging parameters for the BOLD MR acquisition included the following: repetition time, 140 msec; flip angle, 45°; section thickness, 5 mm; imaging matrix, 224 × 160 to 192; and field of view, 32 to 40 cm, with a 0.7–1.0 partial-phase field of view. Image matrix and repetition time were adjusted in patients with limited breath-hold capacity, and the field of view and partial field of view were adjusted according to patient size. BOLD MR images were prescribed transverse to the long axis of the kidney by using the long-axis localizer images and were acquired during suspended respiration through the midpole hilar region of each kidney. Parametric images of R2* were then generated by fitting signal intensity–versus–echo time data to an exponential function on a voxel-by-voxel basis and solving for R2* (19). After the first BOLD MR acquisition, 20 mg of furosemide (Lasix; Sanofi-Aventis, Bridgewater, NJ) was administered intravenously and flushed with 20 mL of saline. BOLD MR measurements for each kidney were repeated 15 minutes later. Gadolinium-enhanced MR angiograms were obtained after BOLD MR imaging to confirm the presence or absence of large-vessel renal arterial disease.
MR Imaging Data Analysis
Analysis of BOLD MR data from axial images was performed by drawing parenchymal ROIs on two to four sections through the midpole hilar region of each kidney on representative T2*-weighted images and then transferring the ROIs to the corresponding R2* parametric image by one author (J.C., a research associate with 10 years of experience in BOLD MR imaging analysis). Two ROIs were traced: In one, the renal cortex (large segment) was selected, and in the other, the entire kidney section, including both cortex and medulla while excluding the renal collecting system and any incidental renal cysts (Fig 1), was selected. For comparative analysis using the “conventional method” (observer-selected ROIs for cortical and medullary regions), individual anterior, lateral, and posterior ROIs of approximately 60 mm were also traced in a different session in the cortex and medulla manually on the 7-msec echo time image or any other T2*-weighted image, yielding optimal contrast between cortex and medulla and then were copied to the parametric R2* image to determine average values of R2* within the ROI by another author (A.S. with 1 year of experience) (15). Four transverse axial sections were obtained that included the renal hilum. Special care was taken to ensure that each ROI was within identifiable deep medullary and cortical sections that remained within the segment at repeat imaging after furosemide administration. The mean values of R2* were calculated for three cortical ROIs and three medullary ROIs (15). BOLD MR data were processed by using software (Matlab 7.10; MathWorks, Natick, Mass). The fractional tissue hypoxia was determined by measuring the percentage of voxels from the whole-kidney ROI with R2* values above 30 sec−1, taking the average of all available sections. Researchers in previous studies indicate that this value is well above the 95% confidence interval for R2* levels obtained in cortical (nonhypoxic) areas in subjects with either EH or nonischemic renovascular disease (20). The change in R2* after furosemide administration was defined as the difference between values obtained before and values obtained after furosemide administration.
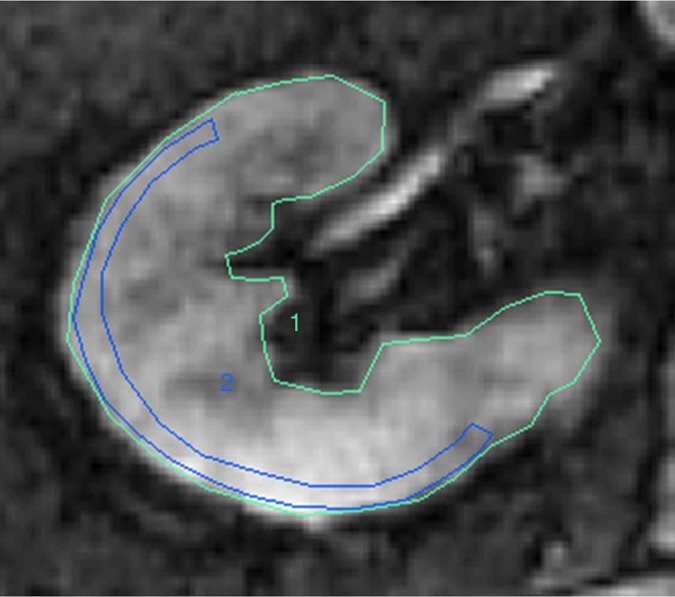
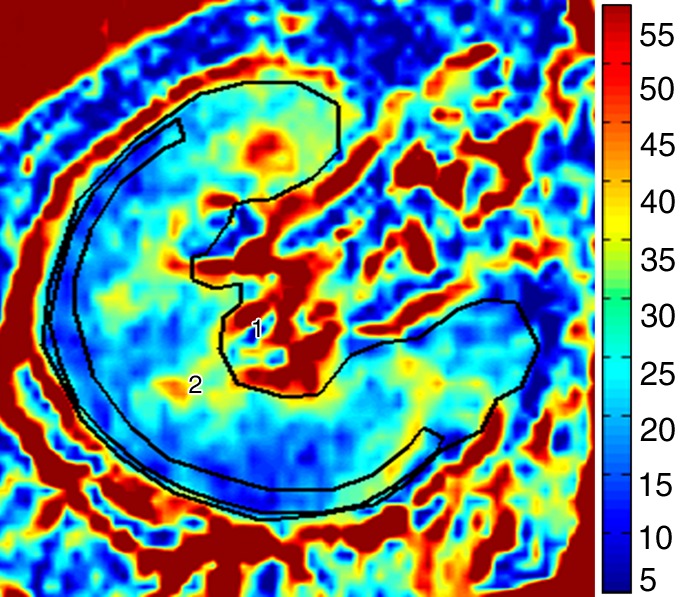
Figure 1a:
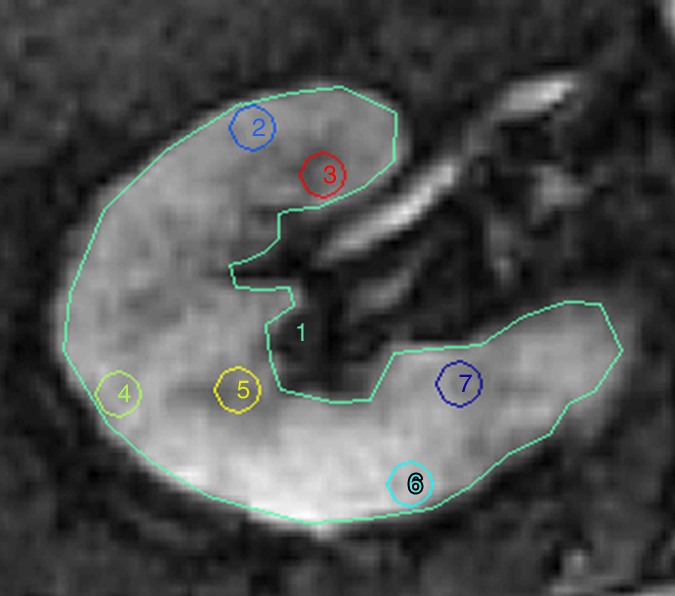
Methods for ROI selection on axial images. (a) T2-weighted image shows observer-selected ROIs (1–7) for multiple zones in cortex (ROIs 2, 4, and 6) and medulla (ROIs 3, 5, and 7) conventionally applied for BOLD MR data measurement. (b) Image depicts determination of fractional tissue hypoxia by outlining of the entire axial kidney section located within parenchyma. An additional ROI was placed to outline “wide segment” cortical area excluding the renal collecting system, incidental cysts, and the hilar vessels. ROIs = 1 and 2 (also on c). (c) R2* parametric map for the selected axial section, reflecting widely variable R2* levels and deoxyhemoglobin at different sites within the kidney, particularly in medullary zones.
Figure 1b:
Methods for ROI selection on axial images. (a) T2-weighted image shows observer-selected ROIs (1–7) for multiple zones in cortex (ROIs 2, 4, and 6) and medulla (ROIs 3, 5, and 7) conventionally applied for BOLD MR data measurement. (b) Image depicts determination of fractional tissue hypoxia by outlining of the entire axial kidney section located within parenchyma. An additional ROI was placed to outline “wide segment” cortical area excluding the renal collecting system, incidental cysts, and the hilar vessels. ROIs = 1 and 2 (also on c). (c) R2* parametric map for the selected axial section, reflecting widely variable R2* levels and deoxyhemoglobin at different sites within the kidney, particularly in medullary zones.
Figure 1c:
Methods for ROI selection on axial images. (a) T2-weighted image shows observer-selected ROIs (1–7) for multiple zones in cortex (ROIs 2, 4, and 6) and medulla (ROIs 3, 5, and 7) conventionally applied for BOLD MR data measurement. (b) Image depicts determination of fractional tissue hypoxia by outlining of the entire axial kidney section located within parenchyma. An additional ROI was placed to outline “wide segment” cortical area excluding the renal collecting system, incidental cysts, and the hilar vessels. ROIs = 1 and 2 (also on c). (c) R2* parametric map for the selected axial section, reflecting widely variable R2* levels and deoxyhemoglobin at different sites within the kidney, particularly in medullary zones.
Multidetector CT
On the 3rd day, RBF, regional perfusion, and cortical and medullary volumes were measured by using multidetector CT (21,22) (Appendix E1 [online]).
Statistical Analysis
Results were expressed by using mean values and standard deviations. Comparisons between EH and atherosclerotic RAS groups were performed by using analysis of variance, as appropriate. Comparisons between stenotic and contralateral kidneys within the same individuals were performed by using paired and nonpaired t tests, as appropriate.
Interobserver variability was evaluated by using the Bland and Altman method, which defined bias and variation by calculating the mean difference between the observers, the standard deviation of the differences, and the 95% limits of agreement (23).
The R2* values were estimated in different sessions by the two independent operators (J.C. and H.F., a research associate with 2 years of experience in BOLD MR imaging analysis) for every kidney in a group of 12 randomly selected patients from the EH and RAS groups. Results are reported as bias (the mean of differences) ± interobserver variation (the standard deviation of ΔR2* distribution). The paired t test between the two operators’ values was also calculated. Intraobserver variability was measured by calculating the ΔR2*, which is the difference in R2* values for every kidney in the group tested, estimated by the same operator in two separate analyses. The variability among the axial sections was assessed by the coefficient of variation. The coefficient of variation (as a percentage) was calculated from the ratio of the standard deviation and mean. Linear regression analysis was used to determine correlations between basal fractional hypoxia and RBF, tissue perfusion, and GFR.
Results
Demographic Comparison between Atherosclerotic RAS Patients and EH Patients
Complete demographic data were available for 40 patients in the atherosclerotic RAS group and 32 patients from the EH group. Patient age and serum creatinine level were higher in the atherosclerotic RAS group than in the EH group (Table 1). The relative proportion of male to female patients, age, body mass index, and biochemical values did not differ between groups.
Table 1.
Demographics and Clinical Features
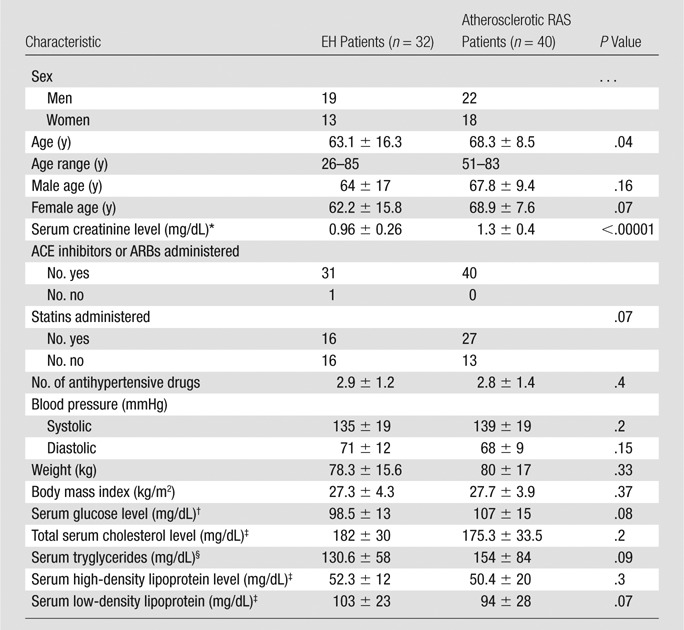
Note.—Data are means ± standard deviations, except where otherwise indicated. ACE = angiotensin-converting enzyme, ARB = angiotensin-receptor blockers.
To convert to Système International units in micromoles per liter, multiply by 88.4.
To convert to Système International units in millimoles per liter, multiply by 0.0555.
To convert to Système International units in millimoles per liter, multiply by 0.0259.
To convert to Système International units in millimoles per liter, multiply by 0.0113.
Renal Blood Flow
The total volume of the kidneys beyond the stenosis on multidetector CT images was reduced, primarily because of reduction in cortical volume, as compared with contralateral kidneys (P < .0001) and kidneys with EH (P = .02) (Table 2). Both cortical and medullary perfusion (in milliliters per minute per milliliter of tissue volume) were reduced in the stenotic kidneys compared with kidneys in EH subjects (P < .0001). Cortical perfusion was reduced in stenotic kidneys compared with contralateral kidneys (P = .02). Whole-kidney blood flow was reduced in the stenotic kidneys, as compared with both contralateral kidneys and kidneys with EH. Single-kidney GFR (milliliters per minute per kidney) in stenotic kidneys was lower than the GFR in either contralateral kidneys or kidneys with EH.
Table 2.
Multidetector CT Measurements of Individual Kidney Volume, Tissue Perfusion, Blood Flow, and Filtration
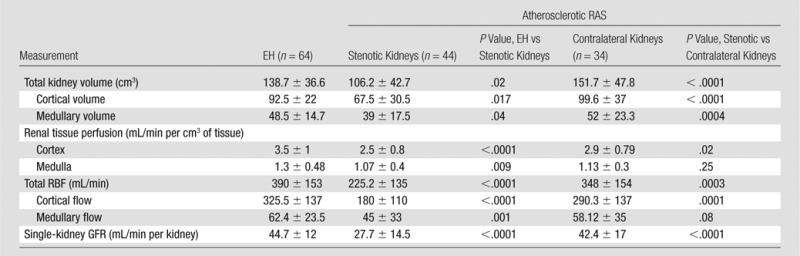
Note.—Data are means ± standard deviations. Multidetector CT data were obtained in 78 kidneys from patients with atherosclerotic RAS. In four cases, high-grade stenoses (more than 60% lumen occlusion) were present in both kidneys.
Fractional Kidney Hypoxia and ROI-determined Medullary R2*
With use of the conventional method (observer selected ROIs for cortical and medullary regions), medullary R2* levels at baseline and after furosemide administration were higher than cortical values for all subjects, although they did not differ between atherosclerotic RAS and EH subjects (Table 3). In contrast, basal fractional hypoxia levels and levels after furosemide administration were higher in stenotic kidneys than in either contralateral kidneys or kidneys with EH (Fig 2). Both medullary R2* and fractional tissue hypoxia decreased after furosemide administration. The magnitude of furosemide-induced changes (difference between values before and after furosemide administration combined divided by values before furosemide administration) in the ROI-determined medullary R2* did not differ measurably between stenotic kidneys, as compared with contralateral kidneys and kidneys with EH (15%, 18%, and 20%, respectively). In contrast, the furosemide-induced changes in fractional hypoxia were blunted in the stenotic kidneys (32%), as compared with the contralateral kidneys and kidneys with EH (53% and 60%, respectively [P = .001 for stenotic vs contralateral kidneys and P = .0002 for stenotic kidneys vs kidneys with EH]).
Table 3.
BOLD MR for EH and Atherosclerotic RAS Kidneys in Relation to Furosemide Administration by Using Fractional Tissue Hypoxia and Observer-selected ROI Measurements
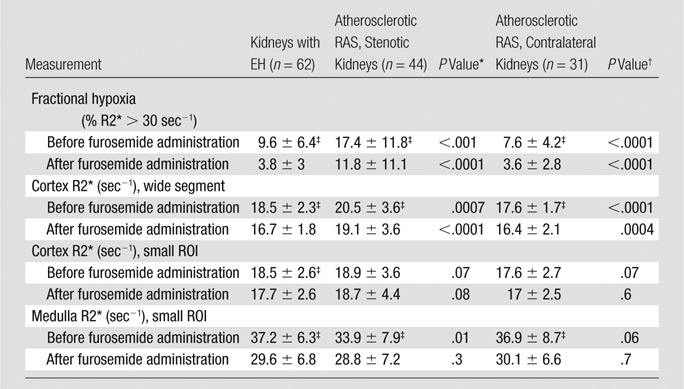
Note.—Data are means ± standard deviations.
EH versus atherosclerotic RAS (stenotic kidneys).
Stenotic kidneys versus contralateral kidneys.
P < .0001 for before furosemide administration versus after furosemide administration.
Figure 2:
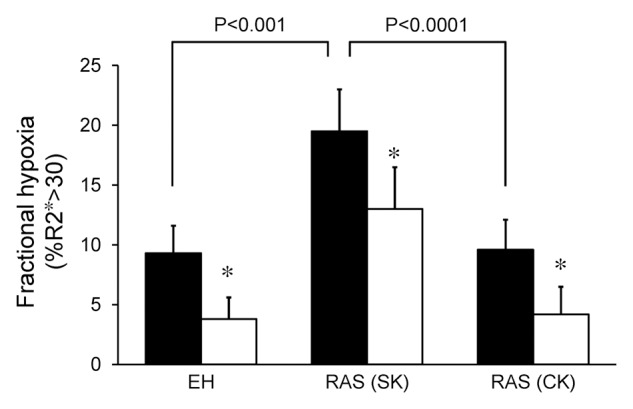
Graph shows fractional tissue hypoxia (R2* > 30 sec−1) in EH, RAS beyond the stenosis (RAS [SK]) and RAS in contralateral kidneys (RAS [CK]); before (solid bars) and after (open bars) administration of furosemide. Basal fractional hypoxia was higher in stenotic kidneys than in contralateral kidneys and kidneys with EH (P < .0001 and P < .001, respectively). Note that fractional hypoxia decreased after furosemide administration in all groups (* = P < .0001).
Fractional kidney hypoxia (baseline) for all kidneys correlated inversely with RBF (r = −0.34), tissue perfusion (r = −0.3), and GFR (r = −0.32). The medullary and cortical R2* determined by using the small-ROI technique at baseline did not show this correlation (Figs 3, E1 [online], E2 [online]).
Figure 3a:
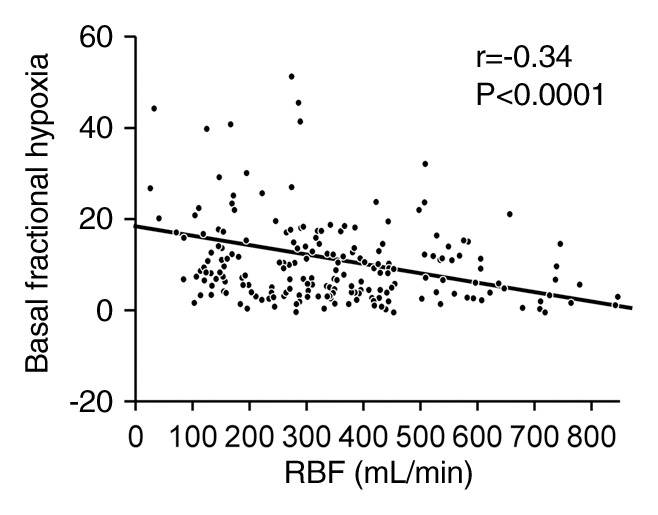
(a) Graph shows relationship between fractional kidney hypoxia (basal) of all kidneys and RBF (r = −0.34). (b) Graph shows relationship between fractional kidney hypoxia (basal) of all kidneys and single-kidney GFR (in milliliters per minute per kidney) (r = −0.32).
Figure 3b:
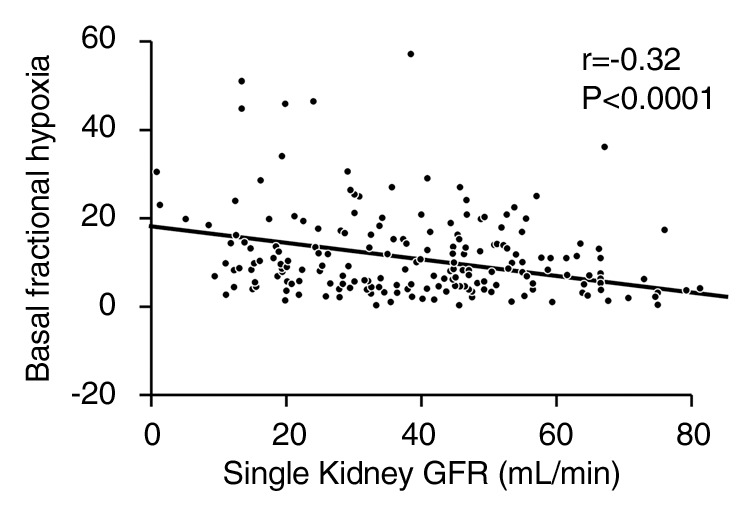
(a) Graph shows relationship between fractional kidney hypoxia (basal) of all kidneys and RBF (r = −0.34). (b) Graph shows relationship between fractional kidney hypoxia (basal) of all kidneys and single-kidney GFR (in milliliters per minute per kidney) (r = −0.32).
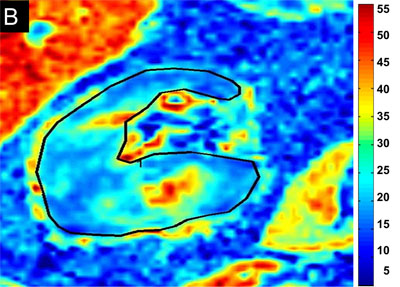
Examples of R2* parametric maps and fractional hypoxia in kidneys with EH and stenotic kidneys are illustrated in (Figs 4, E3 [online]). Cortical and medullary levels did not differ between the patients in Figure 4 (22 vs 22.4 sec−1 and 32 vs 32.6 sec−1, respectively), despite that fractional hypoxia was greater in the kidney with atherosclerotic RAS, as compared with the kidney with EH (28.5%, as compared with 11.3%).
Figure 4a:
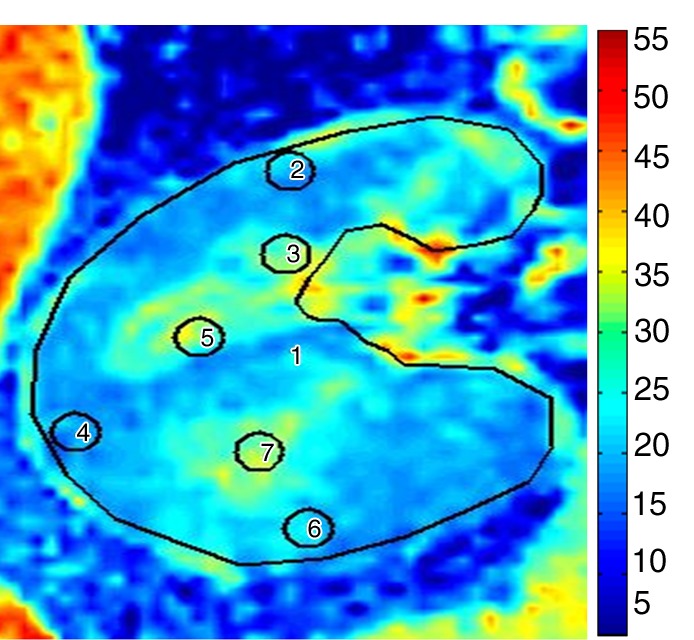
R2* parametric maps in 61-year-old man with EH (a) and 74-year-old man with atherosclerotic RAS (b) obtained by using the same color scale for R2*. Cortical R2* (ROIs 2, 4, and 6) and medullary R2* (ROIs 3, 5, and 7) obtained by using the observer-selected ROIs were similar in both kidneys (mean for EH cortex was 22 sec−1 vs 22.4 sec−1 for atherosclerotic RAS and mean for medulla was 32 sec−1 vs 32.6 sec−1, respectively); however, the fractional hypoxia in atherosclerotic RAS was far greater than that in EH (28.5% vs 11.3%). ROIs = 1–7.
Figure 4b:
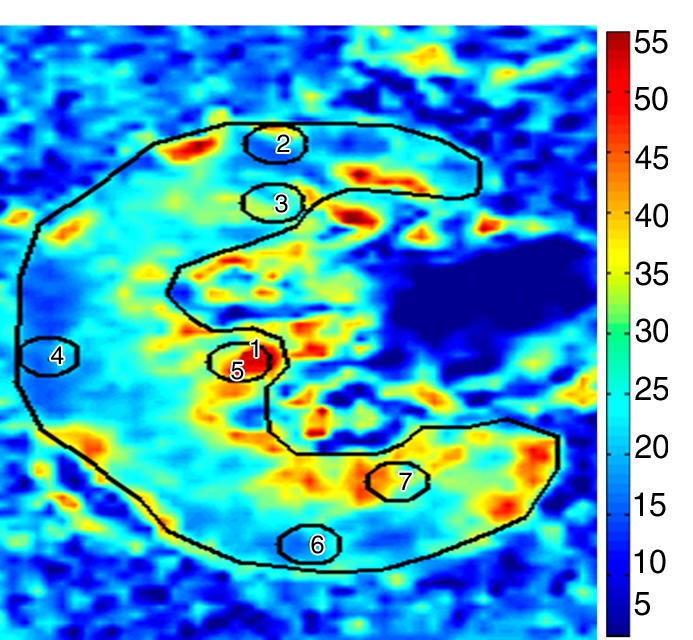
R2* parametric maps in 61-year-old man with EH (a) and 74-year-old man with atherosclerotic RAS (b) obtained by using the same color scale for R2*. Cortical R2* (ROIs 2, 4, and 6) and medullary R2* (ROIs 3, 5, and 7) obtained by using the observer-selected ROIs were similar in both kidneys (mean for EH cortex was 22 sec−1 vs 22.4 sec−1 for atherosclerotic RAS and mean for medulla was 32 sec−1 vs 32.6 sec−1, respectively); however, the fractional hypoxia in atherosclerotic RAS was far greater than that in EH (28.5% vs 11.3%). ROIs = 1–7.
Figure E3 (online) depicts four sections from a single kidney at baseline that highlight the variability in cortical R2* and fractional hypoxia. Estimates for fractional hypoxia among the four axial sections varied as follows: 31%, 19%, 15%, and 41%. The coefficient of variation for fractional tissue hypoxia was 40%. Cortical values for R2* were highly reproducible; the coefficient of variation was less than 7%.
Intraobserver variability was measured in a group of 12 patients, and the average differences in basal mean cortical R2* and fractional hypoxia between two separate analyses were small (0.4 and 0.7, respectively; P = .2), implying good agreement between the two analyses. Interobserver variability was assessed by using the Bland-Altman method in a group of 12 patients identified with small average differences (bias) in mean basal cortical R2* and fractional hypoxia values (0.1 and 0.5, respectively; P = .45) and minor variations between the two independent operators (0.7 and 1.5) (Table 4; Fig E4 [online]; Appendix E1 [online]).
Table 4.
Cortical R2* and Fractional Hypoxia Interobserver Bias and Variations in 12 Patients
Note.—Data are bias (the mean of differences) ± interobserver variation (standard deviations of ΔR2* distribution).
Discussion
Our results demonstrate practical advantages of the estimation of fractional tissue hypoxia for assessment of renal BOLD MR data. This method increased sensitivity to identify reduced tissue oxygenation for human subjects as a result of reduced RBF from atherosclerotic renovascular disease. This analytic method for BOLD MR imaging with the use of whole-kidney sections allowed reduction of the operator dependence for selection of small ROIs and avoidance of the depiction of medullary R2* as a homogeneous zone. By using this method, we identified similar levels of cortical oxygenation and compared them with levels obtained with small ROI methods but were able to detect larger differences of medullary oxygenation in the kidneys beyond the stenosis, both as compared with nonstenotic contralateral kidneys and kidneys from EH subjects.
Fractional kidney hypoxia was higher in stenotic kidneys than in contralateral kidneys or kidneys from patients with EH. Rather than assigning single values for R2* that vary over a wide gradient, this method utilized analytic software to provide an estimate of whole-section hypoxia that correlated inversely with RBF and perfusion in stenotic kidneys. Our results extend the observations of Warner et al (24), demonstrating that graded acute RAS is associated with decreased medullary Po2 measured by using electrodes in a swine model. Differences in renal hypoxia with use of data obtained from conventional small ROIs were less apparent and were not identifiable as a function of severity of vascular stenosis. With small ROIs, we failed to reliably differentiate kidneys with reduced perfusion.
It should be emphasized that there is no standard widely accepted method for analyzing renal BOLD MR data. By convention, ROIs are placed over local regions of cortex and medulla, as defined by the T2*-weighted images, and then are transferred to the parametric images for measurement of cortical and medullary R2* (9,25). These ROIs vary in size and almost certainly lead to volume averaging and potential overlap between cortex and medulla included in the same ROI, which could lead to underestimation of R2* values in the medulla or overestimation of cortical R2* values (9,10,15). Ebrahimi et al (26) showed that the R2* population in cortex and medulla can be modeled to follow two distinct distributions. With use of this assumption, these authors separated the R2* values into two renal compartments by fitting the histogram of the R2* data acquired from a single large ROI encompassing both cortex and medulla to the corresponding distribution functions. This method also assumes a single numerical value for R2* in the medulla, despite its wide heterogeneity.
In a recent publication, Michaely et al (27) could not identify an evident correlation between R2* (defined by ROI selection) values and renal function in patients with different stages of chronic kidney disease as defined by estimated GFR in a large cohort with a variety of kidney disease. For these studies, BOLD imaging was added to MR studies undertaken for a broad range of indications without regard to sodium intake, medications (including those that alter oxygen delivery and/or consumption, such as angiotensin-converting enzyme inhibitors, angiotensin-receptor blockers, or diuretics), or the specific cause of the underlying kidney disease. The authors concluded that gross measures of cortical and medullary oxygenation do not depend directly on the level of estimated GFR. Our studies were limited specifically to nondiabetic subjects with large-vessel occlusive disease and hypertension examined under the conditions of fixed sodium intake and standardized medication regimens without other identified causes of kidney disease. In our cohort, reduction in cortical perfusion, blood flow, and GFR were, in fact, generally related to the fractional tissue level of hypoxia, although not directly related to localized measures of R2* in cortex or medulla.
We included administration of furosemide as part of BOLD MR imaging to evaluate the role of tubular solute transport in determining tissue oxygenation. The response to furosemide in medullary R2* and fractional hypoxia in the stenotic kidneys was blunted, compared with the contralateral kidneys and kidneys with EH, although this result was more evident with the reduction in fractional hypoxia. We interpret these data to suggest that oxygen consumption in the stenotic kidneys was reduced as a function of reduced solute filtration and transport because of the decrease in GFR and RBF observed in stenotic kidneys compared with either contralateral kidneys or kidneys with EH. These observations extend the results of Gomez et al (28), who reported reduced furosemide-suppressible oxygen consumption in the kidneys beyond the stenosis with reduced GFR in a swine model.
In this study, we further compared BOLD MR images obtained from multiple axial sections from the same kidneys. We analyzed the variability in cortical R2* and fractional hypoxia in two to four sections both at baseline and after furosemide administration. Estimates for fractional hypoxia among the axial sections varied considerably, although cortical values did not. We believe this level of variability reflects true differences between functional zones with different deep medullary representation, particularly in diseased kidneys.
This study had limitations. Our control group comprised EH subjects, rather than truly healthy individuals. The EH group did include some healthy individuals with normal kidney hemodynamics and function. Individuals with RAS were somewhat older and had a lower GFR, although most had relatively preserved function because of the protocol requirement for serum creatinine level below 1.7 mg/dL (150.3 μmol/L). Our choice of 30 sec−1 to be the threshold of hypoxia was arbitrary and was based on data in previous studies (8,20) using 3-T MR. It is likely that this number will change with different magnet strength and different diseases.
Taken together, our results support an approach to analyzing BOLD MR imaging on the basis of whole-section measurements of levels of regional hypoxia that does not require assuming two populations of R2* in the cortex and medulla. In summary, fractional kidney hypoxia correlated inversely with RBF, cortical and medullary perfusion, and GFR under the conditions of our study in human subjects with EH and atherosclerotic renovascular disease. Whether these estimates will allow the clinician to quantify the severity of vascular occlusive kidney disease and predict renal functional response (eg, after revascularization of atherosclerotic RAS) merits further investigation.
Advances in Knowledge.
• Tissue oxygenation in the kidney beyond a renal artery stenotic lesion was measured using “fractional tissue hypoxia,” defined as the percentage of R2* values above 30 sec−1 on axial sections rather than selected cortical and medullary sites.
• Renal hypoxia using fractional tissue hypoxia aided identification of whole-kidney hypoxia associated with reduced blood flow (17.4% ± 11.8 [standard deviation] in stenotic kidneys vs 9.6% ± 6.4 in kidneys with essential hypertension, P < .0001), whereas local cortical and medullary R2* values did not.
• Values from this method of blood oxygen level–dependent MR analysis correlated inversely with renal blood flow, tissue perfusion, and glomerular filtration rate (r = −0.34, −0.3, and −0.32, respectively).
Implications for Patient Care.
• The method introduced in this study may assist radiologists and clinicians to quantify the degree of tissue hypoxia associated with vascular occlusive disease in the kidney.
• The method may help identify patients for whom renal revascularization has the potential to reverse tissue hypoxia.
Disclosures of Conflicts of Interest: A.S. No relevant conflicts of interest to disclose. J.C. No relevant conflicts of interest to disclose. J.F.G. No relevant conflicts of interest to disclose. S.M.S.H. No relevant conflicts of interest to disclose. H.F. No relevant conflicts of interest to disclose. B.E. No relevant conflicts of interest to disclose. L.O.L. Financial activities related to the present article: none to disclose. Financial activities not related to the present article: institution received research grant from Stealth Peptides and postdoctoral fellowship support to fellow from AHA, institution has patents pending for Bendavia, humanin (peptides not related to imaging), author received payment for travel accommodations at scientific meetings, international meetings with other academic institutions. Other relationships: none to disclose. S.C.T. No relevant conflicts of interest to disclose.
Supplementary Material
Received October 4, 2012; revision requested December 4; final revision received December 28; accepted January 30, 2013; final version accepted February 26.
The content of this article is solely the responsibility of the authors and does not necessarily represent the official views of the National Heart, Lung, and Blood Institute or the National Institutes of Health.
Funding: This research was supported by the National Heart, Lung, and Blood Institute (grant PO1HL85307) and the National Institutes of Health/National Center for Research Resources Clinical and Translational Science Award (UL1 RR024150).
See also the editorial by Zhang et al in this issue.
Abbreviations:
- BOLD
- blood oxygen level–dependent
- EH
- essential hypertension
- GFR
- glomerular filtration rate
- RAS
- renal artery stenosis
- RBF
- renal blood flow
- ROI
- region of interest
References
- 1.O’Connor PM. Renal oxygen delivery: matching delivery to metabolic demand. Clin Exp Pharmacol Physiol 2006;33(10):961–967 [DOI] [PubMed] [Google Scholar]
- 2.Evans RG, Gardiner BS, Smith DW, O’Connor PM. Intrarenal oxygenation: unique challenges and the biophysical basis of homeostasis. Am J Physiol Renal Physiol 2008;295(5):F1259–F1270 [DOI] [PubMed] [Google Scholar]
- 3.Brezis M, Heyman SN, Epstein FH. Determinants of intrarenal oxygenation. II. Hemodynamic effects. Am J Physiol 1994;267(6 pt 2):F1063–F1068 [DOI] [PubMed] [Google Scholar]
- 4.Brezis M, Rosen S. Hypoxia of the renal medulla: its implications for disease. N Engl J Med 1995;332(10):647–655 [DOI] [PubMed] [Google Scholar]
- 5.Textor SC. Ischemic nephropathy: where are we now? J Am Soc Nephrol 2004;15(8):1974–1982 [DOI] [PubMed] [Google Scholar]
- 6.Garovic VD, Textor SC. Renovascular hypertension and ischemic nephropathy. Circulation 2005;112(9):1362–1374 [DOI] [PubMed] [Google Scholar]
- 7.Prasad PV, Edelman RR, Epstein FH. Noninvasive evaluation of intrarenal oxygenation with BOLD MRI. Circulation 1996;94(12):3271–3275 [DOI] [PubMed] [Google Scholar]
- 8.Gloviczki ML, Glockner JF, Lerman LO, et al. Preserved oxygenation despite reduced blood flow in poststenotic kidneys in human atherosclerotic renal artery stenosis. Hypertension 2010;55(4):961–966 [DOI] [PMC free article] [PubMed] [Google Scholar]
- 9.Alford SK, Sadowski EA, Unal O, et al. Detection of acute renal ischemia in swine using blood oxygen level-dependent magnetic resonance imaging. J Magn Reson Imaging 2005;22(3):347–353 [DOI] [PubMed] [Google Scholar]
- 10.Sadowski EA, Fain SB, Alford SK, et al. Assessment of acute renal transplant rejection with blood oxygen level-dependent MR imaging: initial experience. Radiology 2005;236(3):911–919 [DOI] [PubMed] [Google Scholar]
- 11.Warner L, Glockner JF, Woollard J, Textor SC, Romero JC, Lerman LO. Determinations of renal cortical and medullary oxygenation using blood oxygen level-dependent magnetic resonance imaging and selective diuretics. Invest Radiol 2011;46(1):41–47 [DOI] [PMC free article] [PubMed] [Google Scholar]
- 12.Djamali A, Sadowski EA, Muehrer RJ, et al. BOLD-MRI assessment of intrarenal oxygenation and oxidative stress in patients with chronic kidney allograft dysfunction. Am J Physiol Renal Physiol 2007;292(2):F513–F522 [DOI] [PubMed] [Google Scholar]
- 13.Chrysochou C, Mendichovszky IA, Buckley DL, Cheung CM, Jackson A, Kalra PA. BOLD imaging: a potential predictive biomarker of renal functional outcome following revascularization in atheromatous renovascular disease. Nephrol Dial Transplant 2012;27(3):1013–1019 [DOI] [PubMed] [Google Scholar]
- 14.Lübbers DW, Baumgärtl H. Heterogeneities and profiles of oxygen pressure in brain and kidney as examples of the pO2 distribution in the living tissue. Kidney Int 1997;51(2):372–380 [DOI] [PubMed] [Google Scholar]
- 15.Gloviczki ML, Glockner J, Gomez SI, et al. Comparison of 1.5 and 3 T BOLD MR to study oxygenation of kidney cortex and medulla in human renovascular disease. Invest Radiol 2009;44(9):566–571 [DOI] [PMC free article] [PubMed] [Google Scholar]
- 16.Murphy TP, Cooper CJ, Dworkin LD, et al. The Cardiovascular Outcomes with Renal Atherosclerotic Lesions (CORAL) study: rationale and methods. J Vasc Interv Radiol 2005;16(10):1295–1300 [DOI] [PubMed] [Google Scholar]
- 17.Textor SC, Turner ST. Renal vascular response to sodium loading in sons of hypertensive parents. Hypertension 1991;17(6 pt 2):982–988 [DOI] [PubMed] [Google Scholar]
- 18.Wilson DM, Bergert JH, Larson TS, Liedtke RR. GFR determined by nonradiolabeled iothalamate using capillary electrophoresis. Am J Kidney Dis 1997;30(5):646–652 [DOI] [PubMed] [Google Scholar]
- 19.Textor SC, Glockner JF, Lerman LO, et al. The use of magnetic resonance to evaluate tissue oxygenation in renal artery stenosis. J Am Soc Nephrol 2008;19(4):780–788 [DOI] [PMC free article] [PubMed] [Google Scholar]
- 20.Gloviczki ML, Lerman LO, Textor SC. Blood oxygen level-dependent (BOLD) MRI in renovascular hypertension. Curr Hypertens Rep 2011;13(5):370–377 [DOI] [PMC free article] [PubMed] [Google Scholar]
- 21.Lerman LO, Taler SJ, Textor SC, Sheedy PF, 2nd, Stanson AW, Romero JC. Computed tomography-derived intrarenal blood flow in renovascular and essential hypertension. Kidney Int 1996;49(3):846–854 [DOI] [PubMed] [Google Scholar]
- 22.Daghini E, Primak AN, Chade AR, et al. Assessment of renal hemodynamics and function in pigs with 64-section multidetector CT: comparison with electron-beam CT. Radiology 2007;243(2):405–412 [DOI] [PubMed] [Google Scholar]
- 23.Bland JM, Altman DG. Statistical methods for assessing agreement between two methods of clinical measurement. Lancet 1986;1(8476):307–310 [PubMed] [Google Scholar]
- 24.Warner L, Gomez SI, Bolterman R, et al. Regional decreases in renal oxygenation during graded acute renal arterial stenosis: a case for renal ischemia. Am J Physiol Regul Integr Comp Physiol 2009;296(1):R67–R71 [DOI] [PMC free article] [PubMed] [Google Scholar]
- 25.Yin WJ, Liu F, Li XM, et al. Noninvasive evaluation of renal oxygenation in diabetic nephropathy by BOLD-MRI. Eur J Radiol 2012;81(7):1426–1431 [DOI] [PubMed] [Google Scholar]
- 26.Ebrahimi B, Gloviczki M, Woollard JR, Crane JA, Textor SC, Lerman LO. Compartmental analysis of renal BOLD MRI data: introduction and validation. Invest Radiol 2012;47(3):175–182 [DOI] [PMC free article] [PubMed] [Google Scholar]
- 27.Michaely HJ, Metzger L, Haneder S, Hansmann J, Schoenberg SO, Attenberger UI. Renal BOLD-MRI does not reflect renal function in chronic kidney disease. Kidney Int 2012;81(7):684–689 [DOI] [PubMed] [Google Scholar]
- 28.Gomez SI, Warner L, Haas JA, et al. Increased hypoxia and reduced renal tubular response to furosemide detected by BOLD magnetic resonance imaging in swine renovascular hypertension. Am J Physiol Renal Physiol 2009;297(4):F981–F986 [DOI] [PMC free article] [PubMed] [Google Scholar]
Associated Data
This section collects any data citations, data availability statements, or supplementary materials included in this article.