

Summary
The decision to engage in one behavior often precludes the selection of others, suggesting cross-inhibition between incompatible behaviors. For example, the likelihood to initiate feeding might be influenced by an animal’s commitment to other behaviors. Here, we examine the modulation of feeding behavior in the fruit fly, Drosophila melanogaster, and identify a pair of interneurons in the ventral nerve cord that is activated by stimulation of mechanosensory neurons and inhibits feeding initiation, suggesting that these neurons suppress feeding while the fly is walking. Conversely, inhibiting activity in these neurons promotes feeding initiation and inhibits locomotion. These studies demonstrate the mutual exclusivity between locomotion and feeding initiation in the fly, isolate interneurons that influence this behavioral choice, and provide a framework for studying the neural basis for behavioral exclusivity in Drosophila.
Introduction
Sensory stimuli promoting different behaviors are often present simultaneously in the environment. An animal must evaluate these cues in the context of internal physiological state and prior experience to select one behavior and exclude others. How animals assess their environment to generate behavioral decisions and allow for behavioral exclusivity is not well understood.
Studies of decision-making in invertebrates argue that behavioral choice is in part guided by the ability of one behavior to suppress the initiation of others. In the sea slug, Pleurobranchaea californica, and in the medicinal leech, Hirudo verbena, behaviors are ranked in a hierarchy and the selection of one behavior inhibits others (Kristan and Gillette, 2007). In a few cases, this inhibition occurs by interactions between command neurons for different behaviors. For example, in Pleurobranchaea, swimming is dominant over feeding and interactions between command neurons for swimming and feeding generate behavioral selection (Jing and Gillette, 1995, 1999). More commonly, behavioral selection occurs in distributed networks. Swimming and crawling are mutually exclusive behaviors in the leech that are executed by reconfiguration of partially shared circuitry (Briggman et al., 2005; Briggman and Kristan, 2006). In addition, the multiple pathways that inhibit swimming while the leech is feeding provide evidence for distributed decisions, with ingestion altering the response of sensory neurons to mechanosensory stimuli (Gaudry and Kristan, 2009) and gut distension inhibiting swimming downstream of sensory neurons (Gaudry and Kristan, 2010). These studies suggest that behavioral exclusivity can be achieved by distributed networks, but the generality of these findings remains to be explored.
Feeding decisions in the vinegar fly, Drosophila melanogaster, afford an excellent opportunity to examine the hierarchy of behavioral decisions in a genetically tractable model. The relative simplicity of the fly brain with 100,000 neurons, as well as the molecular genetic approaches available in the fly to selectively manipulate identified neurons and examine the effect on animal behavior, provides a powerful platform to study the neural basis of behavioral exclusivity. In Drosophila, feeding behavior begins with detection of taste compounds on the legs or proboscis, resulting in proboscis extension and feeding initiation (Edgecomb et al., 1994). The probability that an animal performs the proboscis extension response (PER) is influenced by the palatability of the taste compound, the energy requirements of the animal and previous associations (Dethier, 1976; Inagaki et al., 2012; Marella et al., 2012; Masek and Scott, 2010).
The neural circuits for proboscis extension and feeding are just beginning to be elucidated. Chemosensory neurons on the legs, proboscis and mouthparts are modality-selective, detecting sugars, bitter compounds, water, or pheromones (Cameron et al., 2010; Chen et al., 2010; Lu et al., 2012; Marella et al., 2006; Thistle et al., 2012; Thorne et al., 2004; Toda et al., 2012; Wang et al., 2004). Sensory neurons from the legs project to the ventral nerve cord (VNC) and subesophageal ganglion (SOG) of the fly brain whereas those from the proboscis and mouthparts project to the SOG (Stocker, 1994; Wang et al., 2004). Motor neurons that drive proboscis extension as well as modulatory neurons that influence proboscis extension are also found in the SOG (Gordon and Scott, 2009; Manzo et al., 2012; Marella et al., 2012; Rajashekhar and Singh, 1994b), suggesting that the SOG contains local circuits that process gustatory cues from detection to behavior. Whether the circuits that control proboscis extension are influenced by other behaviors or influence the probability of other behaviors has not been examined.
Here, we describe a pair of interneurons in Drosophila that is activated upon stimulation of mechanosensory neurons and inhibits feeding initiation, suggesting that these neurons suppress feeding while the animal is walking. Conversely, when the neurons are inhibited, the animal continuously engages in feeding initiation at the expense of locomotion. Thus, our studies suggest that feeding initiation and locomotion are mutually exclusive behaviors and identify neurons that participate in the coordination of this behavioral choice.
Results
Neurons in the E564-Gal4 line inhibit proboscis extension
We previously performed a behavioral screen that identified Gal4 lines with proboscis extension defects (Gordon and Scott, 2009). In this study, we examined the proboscis extension phenotype associated with the Gal4 line, E564-Gal4, and its neural basis. E564 neurons were chronically silenced in the adult fly by expressing the inward-rectifying potassium channel Kir2.1 under the control of the E564-Gal4 driver (Baines et al., 2001). The temperature-sensitive Gal4 repressor Gal80ts was utilized to restrict Kir2.1 expression to the adult stage upon a temperature shift (McGuire et al., 2004). Nearly 100% of flies with chronically silenced E564 neurons exhibited constitutive proboscis extension (Figure 1AB). This phenotype was completely absent in genetically identical flies without Kir2.1 induction and E564-Gal4 controls and nearly absent in UAS-Kir2.1, tub-Gal80ts controls (Figure 1B). Acute silencing of E564 neurons, using a temperature-sensitive shibirets (Shits) (Kitamoto, 2001) that acts on the timescale of minutes to prevent synaptic vesicle reuptake at elevated temperature, promoted spontaneous proboscis extensions and retractions rather than constitutive extension and greatly enhanced sucrose-induced responses (Figure 1BC). These experiments demonstrate that inhibiting activity in E564 neurons promotes proboscis extension in the absence of sensory stimuli as well as in response to taste compounds.
Figure 1. Inducible inactivation and activation of E564-Gal4 neurons alters the threshold for proboscis extension.

A. Example images of E564-Gal4; UAS- Kir2.1, tub-Gal80ts flies without (left) and with (right) induction of Kir2.1.
B. Chronically silencing neurons in E564-Gal4; UAS-Kir, tub-Gal80ts (left) produced constitutive proboscis extension in nearly 100% of animals, a phenotype almost never observed in control (UAS-Kir2.1, tub-Gal80ts or E564-Gal4 flies) and non-induced flies (E564-Gal4; UAS-Kir, tub-Gal80ts, 22°C). Kir2.1 was induced by placing the flies at 30°C for two days prior to experimentation at 22°C. 0 indicates that no flies showed proboscis extension. n=55–60 flies, mean ± 95%CI, Fisher’s exact test, *** P<0.001. Acutely silencing neurons in E564-Gal4; UAS-Shits flies (right) increased spontaneous proboscis extensions more than five-fold at restrictive temperature (32°C, red bars) compared to permissive temperature (22°C, black bars). n=25–36 flies, mean ± SEM, student’s t-test, *P<0.05.
C. Proboscis extension response to sucrose (10–1000mM) in E564-Gal4, UAS-Shits (left) and control E564-Gal4 or UAS-Shits flies (right) at permissive (black, gray) and restrictive temperatures (red, rose). n=54–67 flies, mean±95% CI, Fisher’s exact test, ***P<0.001, *P<0.05.
D. Proboscis extension response to tarsal (top) or proboscis (bottom) stimulation in E564-Gal4, UAS-dTRPA1 (left) and UAS-dTRPA1 control flies (right) at 22°C (black) and 32°C (green). n=31–44 flies/condition, mean ± 95% CI, Fisher’s exact test, ***P<0.001, *P<0.05. See also Figure S1, showing that silencing E564 neurons did not affect sucrose consumption.
To determine whether these neurons influenced feeding as well as proboscis extension, we measured intake of sucrose solutions in freely feeding flies, as well as the time spent consuming sucrose applied directly to the proboscis. E564 flies expressing Kir2.1 consumed the same amount of sucrose as control flies in both consumption assays (Figure S1), indicating that the neurons influence feeding initiation but not consumption.
To assess whether increased activity in E564 neurons inhibits proboscis extension, we expressed the heat-activated cation channel dTRPA1 (Hamada et al., 2008) in E564 neurons and monitored proboscis extension to sugar at temperatures that activate the channel. Activating E564 neurons using dTRPA1 suppressed the proboscis extension response (PER) over a range of sucrose concentrations (50–1000mM). Interestingly, suppression occurred upon leg stimulation but not upon proboscis stimulation, showing that E564 neurons selectively inhibit responses to gustatory stimuli detected on the legs (Figure 1D). The activation and inactivation experiments demonstrate that E564 neurons modulate the threshold of PER, with high activity suppressing and low activity promoting proboscis extension.
Inactivation of a single pair of neurons produces constitutive proboscis extension
The E564-Gal4 line is expressed in 10–12 neurons in the central nervous system of the fly, including the ventral nerve cord (VNC) and central brain (Figure 2AB; Figure S2). To determine the neurons causal for the constitutive proboscis extension phenotype, Kir2.1 was expressed in E564 neural subsets using a genetic mosaic approach. A ubiquitously expressed Gal80 flanked by FRT recombination sites was stochastically excised using an inducible Flp recombinase, allowing the Gal4-dependent expression of Kir2.1 and mCD8-GFP in a subset of E564 neurons (Gordon and Scott, 2009). Adult flies were then assayed for constitutive extension, and the frequency distributions of cell-types in extenders and non-extenders were compared (Figure 2C). Cell-type #1 was highly enriched in extenders and rarely labeled in non-extenders, whereas the other cells were present at similar frequencies in extenders and non-extenders. Additionally, in five animals that displayed constitutive proboscis extension, cell-type #1 was exclusively labeled, demonstrating that silencing of these neurons produces the aberrant behavior.
Figure 2. Mosaic analysis identifies a single cell-type responsible for constitutive proboscis extension.

A-B. Expression of UAS-mCD8-GFP in E564-Gal4 neurons in VNC (A) and central brain (B). The six neural types in mosaics are labeled (arrows). See Figure S2 for single-cell clones of the six different neural types.
C. Flies expressing Kir2.1 and CD8-GFP in subsets of E564 neurons were assayed for constitutive proboscis extension (extension, red bars, n=98), or normal proboscis posture (no extension, black bars, n=116) (genotype: tub>Gal80>; E564-Gal4,UAS-mCD8::GFP/UAS-Kir2.1; MKRS, hs-FLP flies). The frequency of the 6 cell-types identified in A and B is shown in extenders and non-extenders. All cell-types except for cell-type #1 showed similar distribution in both groups. mean±95% CI, Fisher’s exact test, *** P<0.001.
D. A clone of cell-type #1 (PERin) expressing mCD8-GFP, showing cell bodies in the first thoracic segment and projections to the SOG.
E-F. Detailed image of PERin clone from D in first thoracic segment (E) and SOG (F).
G. Schematic of PERin showing processes in the VNC and SOG.
H-I. E564-Gal4 line expressing the presynaptic marker UAS-Syt-GFP and the postsynaptic marker UAS-DenMark. Images are the same regions shown in E, F (PERin), indicating mixed pre-and postsynaptic fibers in the first thoracic segment (H), and presynaptic fibers in the SOG (I). The edges of the VNC (H) and SOG (I) are shown with dotted lines. Scale bars are 50μm. See Figure S2 and Videos S1 and S2 for anatomical studies showing that PERin does not come into proximity of gustatory sensory dendrites or proboscis motor axons.
The neurons that inhibit proboscis extension (which we name PERin) have cell bodies and processes in the first leg neuromeres of the VNC and projections to the subesophageal ganglion (SOG), the brain region that contains gustatory sensory axons and proboscis motor neuron dendrites (Figure 2D-G). Labeling with the presynaptic synaptotagmin-GFP marker (Zhang et al., 2002) and the postsynaptic DenMark marker (Nicolai et al., 2010) indicated that the dendrites of PERin neurons are restricted to the first leg neuromeres, whereas axons are found in both the SOG and the first leg neuromeres (Figure 2HI). The anatomy of these neurons suggests that they convey information from the leg neuromeres to a region of the fly brain involved in gustatory processing and proboscis extension. Anatomical studies examining the proximity of PERin fibers to gustatory sensory dendrites or proboscis motor axons revealed that PERin neurons do not come into close contact with known neurons that regulate proboscis extension (Figure S2; Videos S1 and S2).
PERin neurons are not modulated by satiety state or gustatory cues
There are several different contexts in which PERin neurons might modulate feeding initiation. PERin activity might reflect the satiety state of the animal, such that high activity inhibits feeding initiation when the animal is fed and low activity promotes feeding when the animal is food-deprived. Alternatively, PERin neurons might directly process gustatory sensory cues, increasing activity in response to bitter compounds to suppress proboscis extension or decreasing activity upon sucrose stimulation to promote extension. A third possibility is that they regulate proboscis extension in response to other cues, such as mechanosensory or somatosensory cues, to inhibit proboscis extension while the animal is engaged in other behaviors.
To test whether PERin neurons influence extension probability based on satiety state, we performed cell-attached electrophysiological recordings to monitor the basal firing rate of PERin neurons under fed and food-deprived conditions (Marella et al., 2012). In both conditions, PERin neurons exhibited constant basal activity of ~14 Hz, indicating that tonic activity in these neurons is not altered by satiety state (Figure 3AB).
Figure 3. PERin neurons are not modulated by satiety or taste stimulation.

A. Raster plots of 5 seconds of recording from PERin in 10 different animals, satiated (0H starvation) or food-deprived (24H starvation).
B. Mean firing rate over a 30 second period is not significantly different in satiated (n=6) and food-deprived (n=5) flies by student’s t-test. Individual data points as well as mean ± SEM are shown.
C. Firing rates of PERin neurons before (pre-stimulus) and during stimulation (stimulus) with either 350mM sucrose (left two panels) or 10mM quinine (right two panels) in satiated (0H) and food-deprived (24H) conditions. Pre-stimulus firing rate was averaged over 15 seconds prior to stimulus. Stimlulus duration was 1 second. n=5 flies for each condition, paired t-test. ns.
To evaluate whether PERin neurons respond to taste stimuli, legs were stimulated with a sugar (350mM sucrose) or a bitter substance (10mM quinine) and activity of PERin was measured by electrophysiology. Taste stimulation had no effect on the firing rate of PERin neurons in either fed or food-deprived animals (Figure 3C). These studies argue that PERin neurons are not modulated by satiety state or gustatory cues.
PERin neurons are activated by mechanosensory input to the VNC
Because the dendrites of PERin neurons reside in the first leg neuromere, we wondered whether inputs into the first leg neuromere would activate PERin neurons. We therefore stimulated the major nerves of the ventral nerve cord and monitored responses of PERin by G-CaMP calcium imaging (Tian et al., 2009), using a dissected brain plus ventral nerve cord preparation and electrical nerve stimulation (10V). PERin dendrites responded to stimulation of nerves of the first leg neuromere and were also excited by the stimulation of nerves from all legs, wings and halteres, but not the abdominal nerve (Figure 4A-C). Of these nerves, the posterior dorsal nerve in segment 2 (PDN2), and the dorsal nerve in segment 3 (DN3) do not contain any gustatory neurons (Demerec, 1950), consistent with the notion that non-gustatory input activates PERin.
Figure 4. PERin neurons receive input from multiple nerves in the VNC and respond to mechanosensory stimulation.

A. Schematic of the major nerves of the VNC. VN=ventral nerve, DN=dorsal nerve, AbN=abdominal nerve, A and P indicate anterior and posterior, respectively, subscripted numbers indicate thoracic segment corresponding to each nerve. TG1, TG2, TG3=Thoracic ganglia 1, 2, 3; AbG=Abdominal ganglion. PERin dendritic region is shown in green in the first segment.
B. Summary of nerve stimulation data. Stimulation (10V) of all nerves except the abdominal nerve resulted in calcium responses in PERin dendrites when compared to sham stimulation (10V applied with no nerve in the suction electrode). n=6–8 flies/condition, mean ± SEM, ANOVA with Tukey post-hoc test, *P<0.05, **P<0.01.
C. The same data as in B is shown as representative heat maps and traces of ΔF/F values (0–200%) in PERin dendrites in E564-Gal4; UAS-GCaMP3 flies for each of the nerves stimulated as well as a sham stimulation. Red arrows indicate stimulation time. Black line is mean ΔF/F value, with gray areas representing ± SEM. Scale bar is 50μm.
D. Heat map and ΔF/F trace as in C but upon NompC-QF; QUAS-ChR2 stimulation. Blue bar indicates light stimulation. Scale bar is 50μM. Black line is mean ΔF/F value, with gray areas representing ± SEM. Scale bar is 50μM. n=6 flies/condition.
E. Summary of NompC-Q; QUAS-ChR2 data. Only flies expressing ChR2 under the control of NompC-Q showed activation in PERin dendrites upon blue light stimulation. n=6–8 files/condition, mean ± SEM, ANOVA with Tukey post-hoc test, *P<0.05. See Figure S3, showing that activation of sugar, bitter or water gustatory projections did not activate PERin nor did air puff nor heat stimulation.
Because mechanosensory neurons are a major sensory input carried by all nerves into the VNC, we tested whether PERin was activated by stimulation of mechanosensory neurons. The blue light-activated ion channel, channelrhodopsin-2 (ChR2), was expressed in mechanosensory neurons under the control of the nompC promoter using the QF/QUAS transgenic system (Nagel et al., 2003; Petersen and Stowers, 2011; Potter et al., 2010) and G-CaMP3 was expressed in PERin using the Gal4/UAS system. Light-induced activation of mechanosensory neurons in the legs produced robust calcium increases in PERin neurons (Figure 4DE). Activating sugar, bitter or water gustatory inputs with ChR2 did not elicit responses in PERin (Figure S3). These results argue that PERin selectively responds to activation of mechanosensory neurons.
In the adult, nompC-Gal4 drives expression in mechanosensory neurons in external sensory bristles and chordotonal organs (Cheng et al., 2010; Petersen and Stowers, 2011). In larvae, NompC-positive neurons respond to touch, whereas different neurons detect noxious heat and harsh mechanosensory stimuli (Cheng et al., 2010; Tracey et al., 2003; Yan et al., 2013). As the repertoire of stimuli that activate NompC neurons in the adult has not been rigorously examined, we tested whether heat or mechanosensory cues would activate PERin similar to optogenetic stimulation of NompC neurons. Neither temperature increases nor an airpuff to a single leg activated PERin (Figure S3). To test whether more rigorous movement would activate PERin, we monitored G-CaMP changes in PERin axons in animals that could freely move their legs (Figure 5). Bouts of PERin activity were highly correlated with bouts of leg movement (Figure 5AC). When legs of the same animals were the immobilized with wax, PERin activity changes were abolished (Figure 5A). Control experiments expressing GFP rather than G-CaMP in PERin neurons showed no fluorescent changes upon movement, showing that responses are not motion artifacts (Figure 5B). Taken together, these experiments argue that PERin is activated upon movement, likely by mechanosensory inputs from multiple legs.
Figure 5. PERin activity correlates wth leg movements.
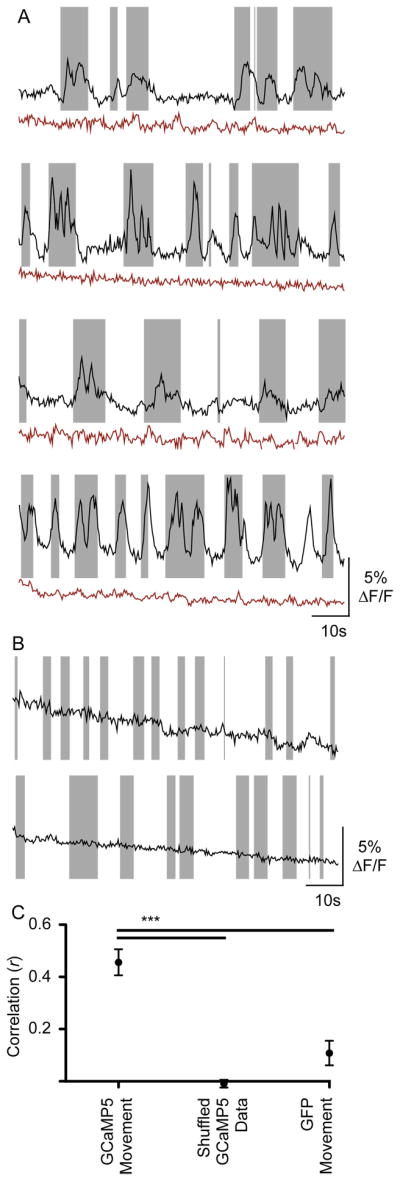
A. ΔF/F traces from PERin axons of E564-Gal4/UAS-GCaMP5; UAS-GCaMP5 for 4 individual flies (black lines), with leg movement indicated by shaded rectangles. ΔF/F traces of the same flies with immobilized legs are shown below (red lines). Calcium transients seen in moving animals are correlated with movement and are abolished in immobilized flies.
B. ΔF/F traces from PERin axons of E564-Gal4, UAS-mCD8::GFP fliesfor 2 individual flies (black lines), with leg movement indicated by shaded rectangles.
C. Correlation values between movement and ΔF/F values in freely moving E564-Gal4/UAS-GCaMP5; UAS-GCaMP5 flies (n=10), shuffled data (n=90), and freely moving E564-Gal4, UAS-mCD8::GFP flies (n=4). Data is mean ± SEM, two-sided t-test, ***P<0.001.
If movement of the legs activates PERin to inhibit proboscis extension, then one prediction would be that removing leg inhibition would promote extension and that this would require PERin. Flies whose legs were either removed (stumps) or immobilized with wax (wax) showed increased spontaneous proboscis extension, demonstrating that leg inputs inhibit extension (Figure 6AB). Extensions were further enhanced in E564-Gal4, UAS-Shits flies, suggesting that tonic activity in PERin or non-leg inputs may also inhibit extension. Importantly, activation of PERin neurons with dTRPA1 in flies with stumps or immobilized legs prevented the increased spontaneous proboscis extension, suggesting that PERin neurons act downstream of leg inputs to inhibit extension (Figure 6CD). These studies suggest that PERin neurons function to inhibit extension while the animal is participating in other behaviors, such as locomotion.
Figure 6. Leg removal or immobilization promotes proboscis extension.

A. Control E564-Gal4 or UAS-Shits flies and E564-Gal4; UAS-Shitsflies with or without legs (legs vs. stumps) at permissive (22°C, black bars) and restrictive (32°C, red bars) temperatures. Removal of legs in control flies caused an increase in spontaneous proboscis extensions, which was similar at both temperatures. Removal of legs in E564-Gal4, UAS-Shits flies also increased spontaneous extensions, and was greatly enhanced at restrictive temperature. n=16–20 flies/condition.
B. Fly legs were immobilized with wax and proboscis extensions were examined at permissive (black bars) and restrictive (red bars) temperatures. n=26–29 flies/condition.
C. UAS-dTRPA1 controls and E564-Gal4; UAS-dTRPA1 flies with or without legs (legs vs. stumps) at 22°C (black) and 32°C (green). Removal of legs in control flies caused an increase in spontaneous proboscis extensions, which was similar at both temperatures. Removal of legs in E564-Gal4, UAS-dTRPA1 flies caused spontaneous extensions, but this effect was abolished at 32°C upon dTRPA1 activation. n=20–21 flies/condition.
D. Activating E564 neurons abolished the increase in spontaneous proboscis extensions caused by leg immobilization. n=19–21 flies/condition. All data for Figure 6 is mean ± SEM, ANOVA with Tukey post-hoc test, *P<0.05, **P<0.01, ***P<0.001.
Engagement in proboscis extension inhibits locomotion
As PERin promotes behavioral exclusivity by altering the threshold for feeding initiation in response to mechanosensory-driven behaviors, we hypothesized that commitment to one behavior might more generally prevent other behaviors. Since E564-Gal4; UAS-Kir2.1, tub-Gal80ts flies display constitutive proboscis extension, we wondered whether engagement in this behavior might alter the probability of other behaviors. To test this, we monitored the activity of E564-Gal4; UAS-Kir2.1, tub-Gal80ts flies in a closed arena. Control flies, as well as E564-Gal4; UAS-Kir2.1, tub-Gal80ts flies not expressing Kir2.1, showed robust walking activity, whereas flies expressing Kir2.1 in E564 neurons had greatly reduced activity, with some flies not taking a single step in the 60 seconds assayed (Figure 7AB). All flies were able to move when presented with a startle stimulus.
Figure 7. Silencing PERin neurons reduces locomotion.

A. Sample walking traces of control, heterozygous E564-Gal4; UAS-Kir2.1, tub-Gal80ts and homozygous E564-Gal4; UAS-Kir2.1, tub-Gal80ts flies (3 flies/genotype) without (22 °C) or with Kir2.1 (30°C) induction (top 6 traces). The bottom two traces show mosaic E564 flies selected for either a retracted or extended proboscis. As with the full E564-Gal4 line, flies with extended proboscises moved significantly less. Different colors mark movement paths of different flies for one minute. Scale bar is 10mm.
B. E564-Gal4; UAS-Kir2.1, tub-Gal80ts flies showed severely reduced movement when compared to controls. This phenotype was also observed in mosaic flies exhibiting constitutive PER, but not in mosaic flies that did not exhibit PER. n=12–15 flies/condition for non-mosaic animals, n=25–30 for mosaics, mean ± SEM, two-way ANOVA for E564-Gal4; UAS-Kir2.1, tub-Gal80ts heterozygotes versus controls; students t-test for E564-Gal4; UAS-Kir2.1, tub-Gal80ts homozygotes and mosaics, ***P<0.001.
C. Analysis of mosaic animals selected for high movement (<250mm/minute) or low movement (>200mm/minute). Only cell-type 1 (PERin) neurons were enriched in flies with low locomotion (cell-types numbered in Figure 2 and S2). n=25–30 flies/condition, mean±SEM, Fisher’s exacttest, ***P<0.001. See Figure S4 for behavioral analyses of a second Gal4 line that contains PERin.
D. Waxing the proboscis in an extended state, but not in a retracted state, impaired locomotion in wild-type flies. Waxing the proboscis in a retracted state partially rescued the locomotion defects seen upon neural inactivation of E564-Gal4; UAS-Kir2.1, tub-Gal80ts heterozygous flies. n=12–22 flies/condition for non-mosaic animals, n=23–26 for mosaics, mean ± SEM, two-way ANOVA for E564-Gal4; UAS-Kir2.1, tub-Gal80ts heterozygous flies versus controls, students t-test for wild-type waxed proboscis,***P<0.001, *P<0.05. See Figure S4, showing that a second Gal4 line, E605-Gal4, containing PERin shows similar activation and inactivation behavioral phenotypes.
To test whether the movement impairment was a consequence of silencing PERin, we generated mosaic animals in which Kir2.1 and mCD8-GFP were expressed in subsets of E564 neurons, screened for constitutive proboscis extension and assayed the extenders and non-extenders for movement (Figure 7AB). Flies with extended proboscises displayed impaired locomotion. To ensure that the locomotion defect was a result of inactivating PERin, we screened mosaic animals for locomotor defects and determined the frequency distribution of neural classes in flies with normal locomotion (>250mm/min traveled) or impaired locomotion (<200mm/min traveled). PERin was enriched in flies with locomotor defects and no other cell-type correlated with locomotor defects (Figure 7C). These experiments show that silencing PERin both promotes proboscis extension and inhibits movement. A second Gal4 line, E605-Gal4, contains PERin and displays the same behavioral phenotypes upon neural inactivation or activation (Figure S4). These data suggest that there is a reciprocal balance between feeding initiation and locomotion mediated by PERin activity.
To test whether the act of proboscis extension sufficed to inhibit locomotion, we immobilized the proboscis in an extended or retracted position with wax. Wild-type flies with extended proboscises moved significantly less (Figure 7D), arguing that motor activity or proprioceptive feedback from the proboscis inhibits locomotion. Consistent with this, immobilizing the proboscis in a retracted state partially rescued the locomotor defect of flies with inactivated PERin neurons (Figure 7D). Thus, proboscis extension feeds back onto circuits to inhibit locomotion, allowing for mutually exclusive behaviors.
Discussion
Many behaviors are mutually exclusive, with the decision to commit to one behavior excluding the selection of others. Here, we show that feeding initiation and locomotion are mutually exclusive behaviors and that activity in a single pair of interneurons influences this behavioral choice. PERin neurons are activated by stimulation of mechanosensory neurons and activation of PERin inhibits proboscis extension, suggesting that they inhibit feeding while the animal is walking. Consistent with this, leg removal or immobilization enhances proboscis extension probability and this is inhibited by increased PERin activity. The opposite behavior is elicited upon inhibiting activity in PERin neurons: animals show constitutive proboscis extension at the expense of locomotion. This work shows that activity in a single pair of interneurons dramatically influences the choice between feeding initiation and movement.
The precise mechanism of activation of PERin neurons remains to be determined. PERin dendrites reside in the first leg neuromere, suggesting that they process information from the legs. Stimulation of leg chemosensory bristles with sucrose or quinine or activation of sugar, bitter or water neurons using optogenetic approaches did not activate PERin neurons, nor did satiety state change tonic activity. Stimulation of sensory nerves into the ventral nerve cord and stimulation of mechanosensory neurons, using a nompC driver, activated PERin. In addition, by monitoring activity of PERin while flies moved their legs, we demonstrated that activity was coincident with movement. These studies argue that PERin is activated by non-gustatory cues in response to movement, likely upon detection of mechanosensory cues. Additional cues may also activate PERin.
Studies of behavioral exclusivity in other invertebrate species suggest two mechanisms by which one behavior suppresses others (Kristan and Gillette, 2007). One strategy is by competition between command neurons that activate dedicated circuits for different behaviors. More common is a strategy in which decision-making occurs by distributed activity changes across neural populations. While our studies are a starting point to begin to examine these models in Drosophila, the circuits for proboscis extension and locomotion drive different motor neurons, muscles and behaviors, suggesting that they may be connected by a few links rather than largely overlapping circuitry. PERin is likely to inhibit feeding initiation while the animal is moving and is one critical link. The observation that simply gluing the proboscis in an extended state, but not in a retracted state, inhibits locomotion suggests that motor activity or proprioceptive feedback from the proboscis acts as a reciprocal link to locomotor circuits.
Neurons act over different time scales and in response to different sensory cues to influence behavior. The powerful molecular genetic approaches available in Drosophila enable the precise manipulation of individual neurons and allow for the examination of their function in awake, behaving animals. Modulatory neurons such as PERin are difficult to identify by calcium imaging or electrophysiological approaches because they influence gustatory-driven behavior but are not activated by gustatory stimulation. The ability to probe the function of neurons in unbiased behavioral screens facilitates the identification of neurons that act as critical nodes to influence behavior. The identification and characterization of PERin as a significant modulator of feeding initiation provides a foundation for future studies determining how PERin influences proboscis extension circuits to alter behavioral probability and how mechanosensory inputs activate PERin. In addition, examining how proboscis extension suppresses locomotion will provide important insight into the links between different behaviors.
Neural circuits for a given behavior do not work in isolation. Information from multiple sensory cues, physiological state and experience must be integrated to guide behavioral decisions. Our work uncovers a pair of interneurons that influences the choice between feeding initiation and locomotion. The discovery of the PERin neurons will aid in examining the neural basis of innate behaviors and the decision-making processes that produce them.
Experimental Procedures
Fly strains
w Berlin flies were used as control wild type flies. The following fly lines were used: E564-Gal4 (from the Gal4 collection kindly proved by Ulrike Heberlein), hs-flp, MKRS (Bloomington stock collection), UAS-Kir2.1 (Baines et al., 2001), tub-Gal80ts (McGuire et al., 2004), ptub-FRT-Gal80-FRT, Gr5a-LexA, UAS- CD4::spGFP1-10, LexAop-CD4::spGFP11,E49-Gal4 (Gordon and Scott, 2009), UAS-mCD8::GFP (Lee and Luo, 1999), UAS-dTRPA1 (Hamada et al., 2008), UAS-GCamP3 (Tian et al., 2009), UAS-DenMark; UAS-Syt::GFP (Nicolai et al., 2010), UAS-Shits (Kitamoto, 2001), LexAop- dTRPA1 (vectors described in (Pfeiffer et al., 2010) a gift from Barret Pfeiffer, Rubin lab), NompC-QF and QUAS-ChR2 (Petersen and Stowers, 2011), ppk28-LexA and Gr66a-LexA (Thistle et al., 2012), UAS-mCD8:: dsRed (Ye et al., 2007), E605-Gal4 (Gohl et al., 2011), UAS-C3PA (Ruta et al., 2010), UAS-GCaMP5 (Akerboom et al., 2012). Flies were grown on standard fly food.
Transgenic flies
LexAop-ChR2 flies were generated by PCR amplification of the ChR2 sequence from UAS-ChR2 flies (a gift from Steve Stowers) and cloning into the pLOT vector. Primers for amplification were from pUAST (5′ AGAACTCTGAATAGGGAATTGGG and 3′AAATCTCTGTAGGTAGTTTGTCCA). The functionality of LexAop-ChR2 was validated by behavioral experiments showing that Gr5a-LexA, LexAop-ChR2 flies extended the proboscis to light (not shown).
Behavioral Experiments
Proboscis extension
PER was performed as previously described (Marella et al., 2012), except that each individual stimulation of each animal was treated as an independent data point. For the UAS-Kir2.1, tub-Gal80ts experiments, Kir2.1 was induced by a 2-day temperature shift to 30°C then returned to 22°C for one day prior to testing. Uninduced flies remained at 22°C. For the Shibirets inducible silencing experiments and the dTRPA1 inducible activation experiments, flies were transferred to a heating block at 32°C for 5 minutes and then assayed for behavior. The Shibirets flies were raised at 19°C. All UAS control flies were crossed to w Berlin in order to produce animals isogenic to experimental flies. Constitutive extension was determined as a complete extension of the proboscis (with both the rostrum and haustellum fully extended) maintained over several seconds in the absence of stimulus. The number of spontaneous extensions and retractions were measured in individual flies over a 30 second window.
Walking assay
Flies were gently aspirated into a circular chamber 4cm in diameter. Freely moving flies were videotaped for 1 minute at 12fps using a Sony DCR-HC38 camera. Video was subsequently analyzed using the ctrax software suite version 0.3.9 (Branson et al., 2009). The total distance walked was computed and subsequently used to generate a mean distance traveled for each genotype assayed. Flies were shifted to 30°C for 48 hours to inactivate Gal80ts, then placed at room temperature for 24 hours before assaying. w Berlin flies crossed to UAS-Kir, Gal80ts were used as isogenic controls. All flies assayed were females 5–8 days old. Manual proboscis manipulations were performed by melting wax over the sides of the proboscises of CO2-anethetised flies in either the extended or retracted position. Flies were allowed 2 hours of recovery in food vials before assaying movement. Wild type flies used were w Berlin.
Feeding assay
Flies were put into vials containing 300μl of 200mM sucrose mixed with blue dye (Erioglaucine, Sigma, 0.25mg/ml) on a piece of Whatman filter paper (2.5cm circular paper, grade 1). 25–50 flies were allowed to feed for 30 minutes, after which they were put on ice. Flies were scored in the following manner: Flies with no blue dye visible in their abdomen were scored as 0, flies with blue dye in less than half of their abdomen were scored as 1, and those with blue dye in more than half of their abdomen were scored as 2. Starved flies were put on wet kimwipes for 24 hours prior to experimentation.
For the temporal consumption assay, flies were starved for 24 hours on wet kimwipes and then mounted on glass slides using nail polish. After 2 hours of recovery in a humidified chamber, the time spent consuming 1M sucrose was measured for each fly. Flies were considered non-responsive if they failed to consume sucrose upon 10 consecutive stimulations.
Inducible activation
For channelrhodopsin-2 experiments, flies were prepared as previously described (Gordon and Scott, 2009), except that flies were not starved prior to experimentation. Flies were prepared such that all 6 tarsi remained intact, and the stimulating laser was positioned underneath the fly such that the tarsi and ventral side of the thorax could be simultaniously stimulated. For stimulation, 10ms light pulses were applied at 30Hz for a total of 3 seconds using a 50mW 473nm diode pumped solid state laser (Shanghai Dream Lasers).
Genetic mosaics
Genetic mosaics were generated as previously described (Gordon and Scott, 2009), except that flies were of the genotype tub>Gal80>; E564-Gal4,UAS-mCD8::GFP/UAS-Kir2.1; MKRS, hs-FLP. Flies were heat-shocked at 37.5°C for 55 minutes during late larval to pupal stages.
Immunohistochemistry
Antibody staining and imaging was carried out as previously described (Wang et al., 2004). The following antibodies were used: rabbit anti-GFP (Invitrogen, 1:1,000), mouse anti-GFP (Invitrogen, 1:1000), mouse anti-nc82 (Hybridoma bank, 1:500), rabbit anti-dsRed (Biovision, 1:1000). Brightness or contrast of single channels was adjusted for the entire image using ImageJ software.
Electrophysiology
Experiments were performed as previously described (Marella et al., 2012), except that flies were immobilized ventral side up, with cover glass separating the front tarsi and head of the fly from the recording chamber. E564 neurons were labeled with GFP and PERin neurons identified for recordings based on their fluorescence and anatomical position. For taste stimulations, tastants were delivered to the ipsilateral tarsus using a glass capillary. A stimulus artifact in the recording indicated when stimulation occurred. Data was band-passed filtered between 10 and 300Hz using a butterworth-type filter. Pre-stimulus spike rates were calculated using 15s of recording prior to stimulation; stimulus spike rates were calculated using 1s of recording after stimulation.
Nerve stimulation
Whole nervous systems (brain and ventral nerve cord) were carefully dissected in cold adult hemolymph-like solution (AHL) lacking calcium and magnesium, then transferred to a room temperature dish with AHL containing calcium and magnesium, and gently pinned with the dorsal surface facing up (Wang et al., 2003). Nerves were then individually inserted into a stimulating suction electrode (~100kΩ). Stimulus was 10V, 300μs delivered at 100Hz for 100ms (ten stimulations).
G-CaMP Imaging
G-CaMP3 responses were monitored as previously described (Marella et al., 2006), except that flies were immobilized on Scotch tape, dorsal side up. The dorsal surface of the thorax was partially dissected to expose the VNC. During nerve stimulations and heat stimulations, PERin dendrites were imaged at 1.1 Hz (9 1μm Z-sections at 100ms/μm) on a 3i spinning disk confocal system, using a 20x water objective and 2x optical zoom. For the heat stimulus, a custom heat probe was placed directly under the fly, and temperature was ramped to 36°C while imaging. For channelrhodopsin-2 experiments, PERin dendrites were imaged on a Zeiss PASCAL microscope with a 20x water objective and digital zoom factor of 3, at a rate of ~4Hz (56.6 μm thick optical section).Heat maps were generated using ImageJ. The mean of 4 frames prior to stimulus were used as the baseline fluorescence value.
G-CaMP imaging while monitoring movement
PERin axons were imaged during movement by immobilizing the fly in a manner similar to that previously described for electrophysiology (Marella et al., 2012). The distal segments of the forelegs were removed to prevent them from contacting the bath solution, but otherwise the fly’s legs were allowed to move freely during imaging. Calcium responses were monitored using a 40x water objective and a 3x optical zoom at 3.3Hz (17.7μm thick optical section). PERin axons in the SOG were monitored because leg movement rendered imaging in the ventral nerve cord problematic. Movement of the legs was monitored using a 1800USBPS Penscope (1800endoscope.com). Only movement involving all 6 fly legs was scored as movement. Video was scored for movement using LifesongX 0.8 (Neumann et al., 1992) and resampled at 3.33Hz (to match the calcium imaging rate) using zeros and ones to indicate periods of no movement and movement, respectively. This signal was used to generate correlations (r) between movement and ΔF/F values. All analyses and statistics were performed in Matlab. The correlation coefficient (r) between the ΔF/F signal and the movement array showed high r values (mean=0.4559, std=0.182). With the exception of one animal, all correlations were highly significant (p<0.0002). To test if significant r values are an artifact of correlating two highly time-varying signals, we shuffled the data and computed the correlation coefficients for all possible movement array and ΔF/F combinations. The distributions of the r values for congruent correlations (n = 10) and shuffled data (n = 10^2 – 10 = 90) were compared with a two-sided t-test.
Statistical Methods
Students t-test was used to analyze single comparisons in normally distributed data. Paired t-test was used for comparison of spiking responses in the same neuron pre-stimulus and during stimulation. Fishers exact test was used to analyze binomial data. ANOVA was used to analyze multiple comparisons in normally distributed data. Two-way ANOVA was used when there was more than one variable (genotype, temperature or genotype, wax).
Supplementary Material
Acknowledgments
The Scott lab and Liming Wang provided helpful comments on the experiments and manuscript. Heesoo Kim and Chris Rodgers provided crucial assistance in the analysis of electrophysiology and calcium imaging data. Ulrike Heberlein generated and generously provided access to a Gal4 collection and Daryl M. Gohl, Marion Silies and Tom Clandinin generated and generously provided access to the InSite collection. Brendan Mullaney developed the blue-dye feeding assay used in this study. Priscilla Kong generated the lexAop-ChR2 flies. This research was supported by a grant from the NIDCD 1R01DC006252 to K.S. K.S. is an Early Career Scientist of the Howard Hughes Medical Institute.
Footnotes
Author contributions
K.M. initiated the project, performed the majority of experiments and co-wrote the manuscript. M.D.G. carried out the initial behavioral screen that isolated the proboscis extension phenotype of E564-Gal4. K.S. supervised the project and co-wrote the manuscript.
Publisher's Disclaimer: This is a PDF file of an unedited manuscript that has been accepted for publication. As a service to our customers we are providing this early version of the manuscript. The manuscript will undergo copyediting, typesetting, and review of the resulting proof before it is published in its final citable form. Please note that during the production process errors may be discovered which could affect the content, and all legal disclaimers that apply to the journal pertain.
References
- Akerboom, et al. Optimization of a GCaMP calcium indicator for neural activity imaging. J Neurosci. 2012;32:13819–13840. doi: 10.1523/JNEUROSCI.2601-12.2012. [DOI] [PMC free article] [PubMed] [Google Scholar]
- Baines, et al. Altered electrical properties in Drosophila neurons developing without synaptic transmission. J Neurosci. 2001;21:1523–1531. doi: 10.1523/JNEUROSCI.21-05-01523.2001. [DOI] [PMC free article] [PubMed] [Google Scholar]
- Branson, et al. High-throughput ethomics in large groups of Drosophila. Nature methods. 2009;6:451–457. doi: 10.1038/nmeth.1328. [DOI] [PMC free article] [PubMed] [Google Scholar]
- Briggman, et al. Optical imaging of neuronal populations during decision-making. Science (New York, NY. 2005;307:896–901. doi: 10.1126/science.1103736. [DOI] [PubMed] [Google Scholar]
- Briggman, Kristan Imaging dedicated and multifunctional neural circuits generating distinct behaviors. J Neurosci. 2006;26:10925–10933. doi: 10.1523/JNEUROSCI.3265-06.2006. [DOI] [PMC free article] [PubMed] [Google Scholar]
- Cameron, et al. The molecular basis for water taste in Drosophila. Nature. 2010;465:91–95. doi: 10.1038/nature09011. [DOI] [PMC free article] [PubMed] [Google Scholar]
- Chen, et al. The amiloride-sensitive epithelial Na+ channel PPK28 is essential for Drosophila gustatory water reception. J Neurosci. 2010;30:6247–6252. doi: 10.1523/JNEUROSCI.0627-10.2010. [DOI] [PMC free article] [PubMed] [Google Scholar]
- Cheng, et al. The role of the TRP channel NompC in Drosophila larval and adult locomotion. Neuron. 2010;67:373–380. doi: 10.1016/j.neuron.2010.07.004. [DOI] [PMC free article] [PubMed] [Google Scholar]
- Demerec. Biology of Drosophila. New York: John Wiley & Sons, Inc; 1950. [Google Scholar]
- Dethier . The Hungry Fly. Cambridge, MA: Harvard University Press; 1976. [Google Scholar]
- Edgecomb, et al. Regulation of feeding behavior in adult Drosophila melanogaster varies with feeding regime and nutritional state. The Journal of experimental biology. 1994;197:215–235. doi: 10.1242/jeb.197.1.215. [DOI] [PubMed] [Google Scholar]
- Gaudry, Kristan Behavioral choice by presynaptic inhibition of tactile sensory terminals. Nature neuroscience. 2009;12:1450–1457. doi: 10.1038/nn.2400. [DOI] [PubMed] [Google Scholar]
- Gaudry, Kristan Feeding-mediated distention inhibits swimming in the medicinal leech. J Neurosci. 2010;30:9753–9761. doi: 10.1523/JNEUROSCI.1487-10.2010. [DOI] [PMC free article] [PubMed] [Google Scholar]
- Gohl, et al. A versatile in vivo system for directed dissection of gene expression patterns. Nature methods. 2011;8:231–237. doi: 10.1038/nmeth.1561. [DOI] [PMC free article] [PubMed] [Google Scholar]
- Gordon, Scott Motor control in a Drosophila taste circuit. Neuron. 2009;61:373–384. doi: 10.1016/j.neuron.2008.12.033. [DOI] [PMC free article] [PubMed] [Google Scholar]
- Hamada, et al. An internal thermal sensor controlling temperature preference in Drosophila. Nature. 2008;454:217–220. doi: 10.1038/nature07001. [DOI] [PMC free article] [PubMed] [Google Scholar]
- Inagaki, et al. Visualizing neuromodulation in vivo: TANGO-mapping of dopamine signaling reveals appetite control of sugar sensing. Cell. 2012;148:583–595. doi: 10.1016/j.cell.2011.12.022. [DOI] [PMC free article] [PubMed] [Google Scholar]
- Jing, Gillette Neuronal elements that mediate escape swimming and suppress feeding behavior in the predatory sea slug Pleurobranchaea. Journal of neurophysiology. 1995;74:1900–1910. doi: 10.1152/jn.1995.74.5.1900. [DOI] [PubMed] [Google Scholar]
- Jing, Gillette Central pattern generator for escape swimming in the notaspid sea slug Pleurobranchaea californica. Journal of neurophysiology. 1999;81:654–667. doi: 10.1152/jn.1999.81.2.654. [DOI] [PubMed] [Google Scholar]
- Kitamoto Conditional modification of behavior in Drosophila by targeted expression of a temperature-sensitive shibire allele in defined neurons. Journal of neurobiology. 2001;47:81–92. doi: 10.1002/neu.1018. [DOI] [PubMed] [Google Scholar]
- Kristan, Gillette . Invertebrate Neurobiology. Cold Spring Harbor: Cold Spring Harbor Laboratory Press; 2007. Behavioral Choice; pp. 533–553. [Google Scholar]
- Lee, Luo Mosaic analysis with a repressible neurotechnique cell marker for studies of gene function in neuronal morphogenesis. Neuron. 1999;22:451–461. doi: 10.1016/s0896-6273(00)80701-1. [DOI] [PubMed] [Google Scholar]
- Lu, et al. ppk23-Dependent chemosensory functions contribute to courtship behavior in Drosophila melanogaster. PLoS genetics. 2012;8:e1002587. doi: 10.1371/journal.pgen.1002587. [DOI] [PMC free article] [PubMed] [Google Scholar]
- Manzo, et al. Motor neurons controlling fluid ingestion in Drosophila. Proceedings of the National Academy of Sciences of the United States of America. 2012;109:6307–6312. doi: 10.1073/pnas.1120305109. [DOI] [PMC free article] [PubMed] [Google Scholar]
- Marella, et al. Imaging taste responses in the fly brain reveals a functional map of taste category and behavior. Neuron. 2006;49:285–295. doi: 10.1016/j.neuron.2005.11.037. [DOI] [PubMed] [Google Scholar]
- Marella, et al. Dopaminergic modulation of sucrose acceptance behavior in Drosophila. Neuron. 2012;73:941–950. doi: 10.1016/j.neuron.2011.12.032. [DOI] [PMC free article] [PubMed] [Google Scholar]
- Masek, Scott Limited taste discrimination in Drosophila. Proceedings of the National Academy of Sciences of the United States of America. 2010;107:14833–14838. doi: 10.1073/pnas.1009318107. [DOI] [PMC free article] [PubMed] [Google Scholar]
- McGuire, et al. Spatiotemporal gene expression targeting with the TARGET and gene-switch systems in Drosophila. Sci STKE2004. 2004:pl6. doi: 10.1126/stke.2202004pl6. [DOI] [PubMed] [Google Scholar]
- Nagel, et al. Channelrhodopsin-2, a directly light-gated cation-selective membrane channel. Proceedings of the National Academy of Sciences of the United States of America. 2003;100:13940–13945. doi: 10.1073/pnas.1936192100. [DOI] [PMC free article] [PubMed] [Google Scholar]
- Neumann, et al. Artificial neural network classification of Drosophila courtship song mutants. Biological cybernetics. 1992;66:485–496. doi: 10.1007/BF00204113. [DOI] [PubMed] [Google Scholar]
- Nicolai, et al. Genetically encoded dendritic marker sheds light on neuronal connectivity in Drosophila. Proceedings of the National Academy of Sciences of the United States of America. 2010;107:20553–20558. doi: 10.1073/pnas.1010198107. [DOI] [PMC free article] [PubMed] [Google Scholar]
- Petersen, Stowers A Gateway MultiSite recombination cloning toolkit. PloS one. 2011;6:e24531. doi: 10.1371/journal.pone.0024531. [DOI] [PMC free article] [PubMed] [Google Scholar]
- Pfeiffer, et al. Refinement of tools for targeted gene expression in Drosophila. Genetics. 2010;186:735–755. doi: 10.1534/genetics.110.119917. [DOI] [PMC free article] [PubMed] [Google Scholar]
- Potter, et al. The Q system: a repressible binary system for transgene expression, lineage tracing, and mosaic analysis. Cell. 2010;141:536–548. doi: 10.1016/j.cell.2010.02.025. [DOI] [PMC free article] [PubMed] [Google Scholar]
- Rajashekhar, Singh Organization of motor neurons innervating the proboscis musculature in Drosophila melanogaster meigen (Diptera:Drosophilidae) International Journal of Insect Morphology and Embryology. 1994b;23:225–242. [Google Scholar]
- Ruta, et al. A dimorphic pheromone circuit in Drosophila from sensory input to descending output. Nature. 2010;468:686–690. doi: 10.1038/nature09554. [DOI] [PubMed] [Google Scholar]
- Stocker The organization of the chemosensory system in Drosophila melanogaster: a review. Cell Tissue Res. 1994;275:3–26. doi: 10.1007/BF00305372. [DOI] [PubMed] [Google Scholar]
- Thistle, et al. Contact chemoreceptors mediate male-male repulsion and male-female attraction during Drosophila courtship. Cell. 2012;149:1140–1151. doi: 10.1016/j.cell.2012.03.045. [DOI] [PMC free article] [PubMed] [Google Scholar]
- Thorne, et al. Taste perception and coding in Drosophila. Curr Biol. 2004;14:1065–1079. doi: 10.1016/j.cub.2004.05.019. [DOI] [PubMed] [Google Scholar]
- Tian, et al. Imaging neural activity in worms, flies and mice with improved GCaMP calcium indicators. Nature methods. 2009;6:875–881. doi: 10.1038/nmeth.1398. [DOI] [PMC free article] [PubMed] [Google Scholar]
- Toda, et al. The Drosophila Female Aphrodisiac Pheromone Activates ppk23+ Sensory Neurons to Elicit Male Courtship Behavior. Cell Reports. 2012;1:599–607. doi: 10.1016/j.celrep.2012.05.007. [DOI] [PubMed] [Google Scholar]
- Tracey, et al. painless, a Drosophila gene essential for nociception. Cell. 2003;113:261–273. doi: 10.1016/s0092-8674(03)00272-1. [DOI] [PubMed] [Google Scholar]
- Wang, et al. Taste representations in the Drosophila brain. Cell. 2004;117:981–991. doi: 10.1016/j.cell.2004.06.011. [DOI] [PubMed] [Google Scholar]
- Wang, et al. Two-photon calcium imaging reveals an odor-evoked map of activity in the fly brain. Cell. 2003;112:271–282. doi: 10.1016/s0092-8674(03)00004-7. [DOI] [PubMed] [Google Scholar]
- Yan, et al. Drosophila NOMPC is a mechanotransduction channel subunit for gentle-touch sensation. Nature. 2013;493:221–225. doi: 10.1038/nature11685. [DOI] [PMC free article] [PubMed] [Google Scholar]
- Ye, et al. Growing dendrites and axons differ in their reliance on the secretory pathway. Cell. 2007;130:717–729. doi: 10.1016/j.cell.2007.06.032. [DOI] [PMC free article] [PubMed] [Google Scholar]
- Zhang, et al. Living synaptic vesicle marker: synaptotagmin-GFP. Genesis. 2002;34:142–145. doi: 10.1002/gene.10144. [DOI] [PubMed] [Google Scholar]
Associated Data
This section collects any data citations, data availability statements, or supplementary materials included in this article.