

Abstract
Understanding of the mechanisms driving our daily face-to-face encounters is still limited; the field lacks large-scale datasets describing both individual behaviors and their collective interactions. However, here, with the help of travel smart card data, we uncover such encounter mechanisms and structures by constructing a time-resolved in-vehicle social encounter network on public buses in a city (about 5 million residents). Using a population scale dataset, we find physical encounters display reproducible temporal patterns, indicating that repeated encounters are regular and identical. On an individual scale, we find that collective regularities dominate distinct encounters’ bounded nature. An individual’s encounter capability is rooted in his/her daily behavioral regularity, explaining the emergence of “familiar strangers” in daily life. Strikingly, we find individuals with repeated encounters are not grouped into small communities, but become strongly connected over time, resulting in a large, but imperceptible, small-world contact network or “structure of co-presence” across the whole metropolitan area. Revealing the encounter pattern and identifying this large-scale contact network are crucial to understanding the dynamics in patterns of social acquaintances, collective human behaviors, and—particularly—disclosing the impact of human behavior on various diffusion/spreading processes.
Keywords: human mobility, behavioral rhythms, social networks, social sciences
Highlighting their importance in various temporal spreading processes (1–3), recent studies of human contact networks demonstrate an increasing interest in physical encounters (4–9). Contrary to nonphysical social contacts initiated by mobile phone calls, e-mails, and online social networks (10–14), human subjects’ physical encounters take place with heterogeneous prior knowledge of each other, from acquaintances to unknowns, linking two individuals by their copresence in both spatial and temporal dimensions (15). On the other hand, with increasing human interactions, communities may also emerge from social contagion enabled by physical proximity: from not noticing each other, to unintentionally interacting, to intentional communicating, to mutual trust (9). We are tracing—for a large population—in this case for all of Singapore’s bus users, how these encounters are structured by both individual behavior and institutional structures. Bus use is a small slice of urban life, but one where “familiar strangers” will emerge (16, 17)—strangers who have been encountered frequently in daily life, but might never have been addressed. This context is one of many, which, in their totality, give residents the social background against which they construct their more intense relationships. We believe the joint encounter pattern is influenced by individual regularity (18, 19). A previous study based on the dispersal of bank notes suggested that human trajectories follow continuous-time random walks (20); however, considering the inherent regularity in individual behaviors, recent analyses of large-scale trajectories from mobile phone data and travel diaries indicate, on the contrary, that individual mobility patterns display significant regularity and remarkable predictability (18, 19, 21).
With the help of sensors and online networks, data describing close proximity in real-world situations sheds light on encounter patterns and spreading dynamics in contact networks other than diary-based surveys (4). However, these data collection systems are generally embedded in limited samples in spatially small-scale settings such as schools (6), conferences and exhibitions (5, 7), and even in prostitution (8). On a large scale, we still lack empirical data describing examples of both individual regularity and joint encounter patterns (other than simulating mobility and behavior patterns individually, relying on computational and agent-based models) (22–24). Thus, given data limitations, studies on individual mobility regularity and collective interactions are traditionally conducted separately: the mechanisms driving our daily encounters remain unclear.
Therefore, with the increasing quantity and range of human mobility, a central task is to explore social interaction patterns along with mobility regularity. However, previous data collection techniques fail to offer high-resolution information on collective interactions on a large scale (across the population). In this context, individual-based passive data collections embedded in our daily life, such as credit cards and smart cards transactions, can be advantageous. At present, transit use might be the best proxy to capture the patterns of both individual mobility and collective interactions in an urban environment (25). Here, we use public transit transaction records to uncover encounter patterns (see SI Appendix, section I for a detailed description). This dataset consists of more than 20 million bus trips from 2,895,750 anonymous users over 1 wk (Fig. 1A) (about 55% of the resident population) in Singapore. The high spatial-temporal resolution of this dataset allows us to extract time-resolved in-vehicle encounters, defined as two individuals occupying the same vehicle simultaneously (Fig. 1B). Using these, a city-scale empirical temporal contact network is created.
Fig. 1.

Characteristics of transit behaviors. (A) Departure rate of city bus trips. Demand shows similar shapes from Monday to Friday. Two prominent peaks can be identified every day, indicating collective commuting behavior. (B) Time-resolved encounter network on one vehicle service (214 passengers) created using transaction records. Size of each node indicates number of encountered people; color and thickness of each edge indicate start time and duration, respectively, of each encounter activity. This figure explains use of smart card data to create an empirical encounter network in city-scale. (C) Probability density function  of trip frequency f and number of encountered people n of all individuals. Symmetric pear-shaped pattern suggests linear relationship of
 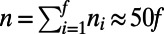 . (D) Probability density function
  of trip frequency f and interevent interval τ between consecutive bus trips. Although diversity of individual transit use obscures the distribution, a remarkable area with
  can be identified through similarity in regular commuters’ transit behavior.
Results
Use of transit service in general, and buses in particular, is differentiated by ethnicity, sex, age, and income, meaning that daily transit use might exhibit social segregation as well. To address dependency and segregation of bus use on social demographic attributes, we incorporated two additional datasets aside from smart card transactions: population census and national household interview travel survey (HITS). For our case, although transit use in Singapore shows dependency on age and income, public transit is still the most important transport means for daily commuting trips across all Singaporeans (SI Appendix, section II). By studying transit use, we found that both trip duration and trip frequency can be accurately characterized by exponentially decaying tails, showing that people’s transit activities are limited in number and duration during 1 wk (SI Appendix, sections III.2 and IV.1). To understand individuals’ transit use patterns, we first measured the number of encountered people n against trip frequencies f for each individual. We find that the joint distribution  has a symmetric pattern against
  , indicating the substantial number of people encountered in each trip (Fig. 1C). We then measured the interevent time τ between consecutive bus trips for the population, finding that
  shows clear temporal patterns with prominent peaks (SI Appendix, section IV.3), which is contrary to the non-Poissonian nature of
 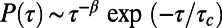 in communication activities observed from digital networks (10–14), suggesting the periodicity of transit use on the population scale. To explore the pattern of τ at the individual level, we grouped people according to their trip frequencies. In Fig. 1D, we added f to each τ as an attribute and measured the joint probability distribution
  . Observing the heterogeneity rooted in individual behaviors helps us distinguish regular travelers from other passengers. Therefore, given the transit use variation (and the analysis in SI Appendix, sections III and IV), we suggest that transit use is a good example for capturing both individual mobility patterns and collective encounter patterns, certainly for our case study.
As mentioned, an important phenomenon triggered by collective regularities is the familiar stranger, which is also crucial in explaining how likely it is that the same persons will be encountered again (Fig. 2A). To explore the pattern of repeated encounters on the population scale, we created an aggregated encounter network over weekdays and measured the interevent time  between consecutive encounters of paired individuals, capturing 27,892,055 intervals from 18,724,388 pairs. We found that the distribution
  is characterized by prominent peaks at 24 h, 48 h, 72 h, and 96 h, displaying a strong tendency of periodic encounters covering about 75% of all cases, suggesting that the joint regularity also displays significant temporal periodicity (Fig. 2B). We also observed a decreasing pattern of
  , as the observed numbers decrease when interval
  is longer. To avoid bias, we extracted and grouped the timings of current and the next encounters
  over all pairs, so that for one pair with three encounters, two records are created [
 and
and  ]. We then measured the joint distribution
  (Fig. 2C). Strikingly, we found that the joint distribution presents reproducible patterns on the same diagonal with
  , respectively, where
  and
and  represent the days of
  and
and  , respectively, suggesting the homogeneity of daily encounters. To measure reproducibility, we summed the probability for each day-of-the-week pair, excluding the diagonal cases with
  , obtaining the density matrix:
 |
Considering the values in  , we found that repeated encounters over the population can be modeled well as a Bernoulli process with probability of success
  , which is another factor behind the decrease of
  .
.
Fig. 2.

Temporal patterns of repeated encounters. (A) A typical temporal contact network of one individual with his/her familiar strangers (encountered more than once). Edge colors indicate start timings during the week. As observed, neighbors are also highly connected over time, suggesting network’s strong social connection and small-world property. (B) Probability density function  of interevent time between two consecutive encounters of paired individuals. The prominent peaks suggest that paired individuals tend to meet each other daily. A general decreasing trend is observed as well. On average, pairs of individuals with repeated encounters can meet each other about
  times during the week. (C) Joint probability density
  of timings of two consecutive encounters. (Inset) Zoom-in of one density square. (D) Distribution
  of encounter time for four groups with
  , respectively. Inset of figures shows the distribution
  of intervals between rescaled timing of paired encounters
  . The prominent peak at
  suggests most repeated encounters happen at the same time.
To reveal the homogeneity of day-to-day encounters, we further studied  . As the Inset of Fig. 2C shows, we found a strong diagonal on
  , which covers 85% of the cases, suggesting that most recurring encounters happen at about the same time of day. Despite this, we also observed two areas representing cross-period encounters, such as the first in the afternoon and the following in the morning on the next day. To compare the distributions of different day-of-the-week pairs
  , we grouped the pairs according to
  , respectively, and rescaled both
  and
and  to time of day
  and
and  . Then, we measured the probability density
  of encounter time by merging
  and
and  (Fig. 2D) and the distribution of interevent intervals
  (Fig. 2D, Inset). Taken together, we found both
  and
and  for different groups share indistinguishable shapes, indicating that the daily encounters can be characterized by a general temporal pattern. Furthermore, although afternoon peaks are longer and higher than morning peaks in daily transit use (Fig. 1A and SI Appendix, Fig. S6B), we confirmed that repeated encounters tend to happen more often in the morning, suggesting that collective regularity is more pronounced in the morning than in the afternoon (21). In this contact network, it is also implied that spreading via repeated interactions is more likely in the morning than afternoon. In addition, the prominent peaks at
  indicate that the most probable time for a recurring encounter is the same as the previous one.
Still, until now, the field lacked analyses to uncover mechanisms that drive encounters on an individual level. Therefore, we began to measure the encounter frequency of paired individuals, finding that the distribution  of encounter frequencies can be well characterized by a heavy-tailed distribution, even though the network is very dense, explaining the emergence of familiar strangers (SI Appendix, section VI.3). Although
  is a good approximation of connection strength, it fails to capture the actual overlapping of collective behaviors when considering other external factors such as transfers. To avoid misinterpreting the data, we used total encounter duration
  to better quantify the connection strength of individual pairs
  , where
  is the duration of their kth encounter. In Fig. 3A, we show the distributions
  (for all individual pairs) and
  (over all trips) in both log–log scale and semilog scale. We found that
  can be well captured by an exponentially decaying tail, whereas
  displays a power-law tail
  with exponent
  . The significant degree of heterogeneity indicates that collective d has overtaken the exponential bounded
  . To summarize the observation of pairs of travelers, collective regularities do occur, suggesting that encounter patterns are influenced by paired individuals’ behavior patterns.
Fig. 3.

Individual’s impact on collective encounters. (A) Probability density functions  of sum of durations of repeated encounters and
  of duration of individual encounters on weekdays; the same distributions are shown in semilog scale as Inset. Solid line shows power-law with exponent
  , suggesting that although distinct encounters exhibit exponentially bounded nature, paired total encounter duration presents scale-free property. Maximum values of d and
  are
are  (25.6 h) and
  (2.2 h), respectively. (B) Distributions
  of personal weight and
  of number of familiar strangers (Inset) of 1,626,040 individuals with
  . Solid lines show power-laws and dashed curve shows distribution
  of number of total encounters
  as guides. (C) Probability density function
  of absolute trip difference m for grouped individuals with different r (colored lines). (Inset) Mean value of
  for people with certain r, suggesting a direct correlation: the higher one’s encounter capability, the more stable one’s behavior. (D) Evolution of time-aggregated network of 783,247 individuals with personal weight
  . (Top) The fraction of presented nodes and size of largest component. We found these two curves indistinguishable, suggesting high network connectivity. (Middle) Evolutions of average number of encounters
  and average number of encountered people
  . (Bottom) Evolution of average clustering coefficient c during the week, suggesting small-world property of this aggregated network.
Next, on an individual level (see SI Appendix, section VII for modeling details), we propose a personal weight  of individual i proportional to their paired encounter frequency:
 |
where  is the set of encountered people and
  is the frequency of encounters between individual i and j observed. Thus,
  captures the likelihood of encountering familiar strangers. In Fig. 3B, we chose individuals who had recurring encounters
  and plotted the probability density functions
  of personal weight and
  of the number of familiar strangers, respectively. We find that both distributions can be approximated well by power-laws with high cutoffs, with the same exponent
  . It is important to note the great variation in person weights—that is, encounter likelihoods—suggesting that encounter patterns might be influenced by individual behavior patterns.
To explore how individual behavioral regularity impacts collective encounter patterns, we tried to quantify both individual encounter capability and transit use. First, to better measure individual encounter likelihood beyond travel time influence, we rescaled  to
to  for each individual, where
  is the total travel time in hours. Inspired by the k-means clustering method—for individual i—we used the absolute difference
  of morning and evening trips to quantify behavioral regularity:
 |
where  is the mean of start and end times of the jth
 trip and
  is the mean of
  . Therefore,
  captures the time variation of daily transit use (the lower
  is, the more repetitive the individual will be; SI Appendix, section VII.2). To reveal the relation between behavioral regularity and encounter likelihood, we grouped the individuals according to
  and measured the distribution
  for each group. As Fig. 3C shows, individuals with higher
  tend to have less skewed
  , whereas those with low
  display a more skewed distribution. In addition, we took the average of
  over people with certain r, where
  is the 95th percentile of their m, finding that the average absolute difference reaches about 50 min for
  , whereas for those with
  , the value decreases to less than 15 min, significantly shorter considering that the expected headway (i.e., service interval) of public buses is around 10 min (Fig. 3C, Inset). In summary, we found that a larger encounter likelihood of an individual is strongly rooted in his/her behavioral regularity.
With these common daily physical interactions, the resulting regularity-rooted encounter network plays an important role in various urban environment dynamics like epidemic spreading. Given that most contact-network–based spreading models still focus on network topology (26, 27) or small-scale contact processes (5–8), identifying this real-world physical contact network is potentially important in studying encounter patterns and diffusion/spreading dynamics in large populations. To model the dynamical evolution of this contact network, we extracted time-aggregated networks of people with  . At the top of Fig. 3D, we plotted the fraction of those individuals over the population, finding a rapid increase from 0% to about 90% on Monday, followed by slower growth afterward. We next checked the variation of average number of encounters
  and average number of encountered people
  , finding linear increases of both
  and
and  without saturation, indicating that the people one may encounter differ from day to day, result in weak and random connections compared with social relations (Fig. 3D, Middle). However, we note that
  increases faster than
  , suggesting that “stronger” connections with familiar strangers are formed gradually through random encounters. At the bottom of the figure, we plotted the evolution of average clustering coefficient c, finding that the encounter network displays strong small-world property network with characteristic path length
  and
and  (28) (
 ,
,  and diameter
  ;
;  and
and  ). Viewed as a whole, the empirical encounter network we illustrate here is a well-connected small-world graph, in which individuals are no longer confined to local encounters in one vehicle, but interact strongly with increasing number of people across the whole city from day to day.
Discussion
It has been assumed that human behavior and social interaction/contagion were connected for a long time; however, it is difficult to identify the link between them in observational studies (29, 30). Taking advantage of the availability of metropolitan data collection offered by smart cards in Singapore (this exercise could be very useful for other cities around the world), we tie together thinking on individual mobility with collective interaction patterns. Although the specific results are certainly embedded within the social profile and data of our study, questions remain: how can smart card data give such insight on social interactions, and how much do these patterns vary from context to context? As a result of various preferences and constraints on individual behavior, spatial-temporal patterns and collective regularity can be found in daily life, such as morning/evening peaks in transportation, degree of crowding in shopping malls and supermarkets at weekends and in restaurants during dining hours, and so forth. Transit use is only one of these social activities with a limited time allocation and specific locations. This study scrutinized only one of a whole spectrum of metropolitan patterns, although it is a critical one. We took transit users as our subjects and the definition of encounter in our study is limited to physical proximity or copresence, which is characterized by individuals occupying the same vehicle simultaneously. Considering vehicle configuration and loading profile (SI Appendix, section I), physical proximity does not necessarily indicate a more intense social contact, such as talking to each other, but does imply diverse interactions, from not noticing each other, to fleeting eye contact and close observation. As a core of social psychology, social contagion deals with thoughts and behaviors of others by innovation adoption, rumor spreading, and decision making. Although the similarity between social contagion and epidemic spreading was recognized a long time ago (31), in the context of physical proximity, social contagion depends more on familiarity than epidemic spreading. Thus, future questions are raised: how to measure the familiarity in the passive familiar strangers networks, and how to define the threshold of familiarity on social diffusion processes. Nevertheless, we know that social communities emerge from the increasing familiarity of individuals into collective forms: from unintentional and passive interactions to intentional and active communication, from mere physical proximity to mutual trust (9). We have shown the existence of city-wide structures of copresence in Singapore; the extent to which the bus users are aware of these structures has yet to be determined.
Unlike other social networks, where people interact within a circle of friends and acquaintances, we show an often-ignored type of social link: weak, passive, and indirectly enabled by daily encounters. Moreover, the structuring of physical encounters is demonstrated on a metropolitan scale. As a result of deep-rooted individual behavior patterns, our results also present the collective regularity of people with their recurring encounters as evidence, explaining the familiar strangers phenomenon in daily life. With the rapid development of information and communication technologies, richer data will be generated throughout our daily life (32). Although the role of such data is limited by an inherent tradeoff, it does not portray everything in detail. However, the emergence of such data provides us with considerable opportunities to enhance our understanding of the social world and its processes. Our work should serve as a base to better understand collective human behaviors, dynamical evolution of social networks (33, 34), and especially the impact of collective regularity on various diffusion/spreading processes (4, 35, 36).
Supplementary Material
Acknowledgments
We thank Peng Gong and Song Liang for discussion and comments on the manuscript, Karen Ettlin for copyediting the paper, Margaret Grieco for giving us important comments on the text, and Singapore's Land Transport Authority for providing the smart card data. This study was supported by the National Research Foundation of Singapore, the funding authority of the Future Cities Laboratory.
Footnotes
The authors declare no conflict of interest.
This article is a PNAS Direct Submission.
This article contains supporting information online at www.pnas.org/lookup/suppl/doi:10.1073/pnas.1306440110/-/DCSupplemental.
References
- 1.Holme P, Saramäki J. Temporal networks. Phys Rep. 2012;519(3):97–125. [Google Scholar]
- 2.Perra N, Gonçalves B, Pastor-Satorras R, Vespignani A. Activity driven modeling of time varying networks. Sci Rep. 2012;2:469. doi: 10.1038/srep00469. [DOI] [PMC free article] [PubMed] [Google Scholar]
- 3.Krings G, Karsai M, Bernhardsson S, Blondel VD, Saramäki J. Effects of time window size and placement on the structure of an aggregated communication network. EPJ Data Sci. 2012;1(1):1–16. [Google Scholar]
- 4.Read JM, Eames KTD, Edmunds WJ. Dynamic social networks and the implications for the spread of infectious disease. J R Soc Interface. 2008;5(26):1001–1007. doi: 10.1098/rsif.2008.0013. [DOI] [PMC free article] [PubMed] [Google Scholar]
- 5.Stehlé J, et al. Simulation of an SEIR infectious disease model on the dynamic contact network of conference attendees. BMC Med. 2011;9(1):87. doi: 10.1186/1741-7015-9-87. [DOI] [PMC free article] [PubMed] [Google Scholar]
- 6.Salathé M, et al. A high-resolution human contact network for infectious disease transmission. Proc Natl Acad Sci USA. 2010;107(51):22020–22025. doi: 10.1073/pnas.1009094108. [DOI] [PMC free article] [PubMed] [Google Scholar]
- 7.Isella L, et al. What’s in a crowd? Analysis of face-to-face behavioral networks. J Theor Biol. 2011;271(1):166–180. doi: 10.1016/j.jtbi.2010.11.033. [DOI] [PubMed] [Google Scholar]
- 8.Rocha LEC, Liljeros F, Holme P. Simulated epidemics in an empirical spatiotemporal network of 50,185 sexual contacts. PLOS Comput Biol. 2011;7(3):e1001109. doi: 10.1371/journal.pcbi.1001109. [DOI] [PMC free article] [PubMed] [Google Scholar]
- 9.Grannis R. From the Ground Up: Translating Geography into Community Through Neighbor Networks. Princeton, NJ: Princeton Univ Press; 2009. [Google Scholar]
- 10.Eckmann JP, Moses E, Sergi D. Entropy of dialogues creates coherent structures in e-mail traffic. Proc Natl Acad Sci USA. 2004;101(40):14333–14337. doi: 10.1073/pnas.0405728101. [DOI] [PMC free article] [PubMed] [Google Scholar]
- 11.Barabási A-L. The origin of bursts and heavy tails in human dynamics. Nature. 2005;435(7039):207–211. doi: 10.1038/nature03459. [DOI] [PubMed] [Google Scholar]
- 12.Onnela JP, et al. Structure and tie strengths in mobile communication networks. Proc Natl Acad Sci USA. 2007;104(18):7332–7336. doi: 10.1073/pnas.0610245104. [DOI] [PMC free article] [PubMed] [Google Scholar]
- 13.Golder SA, Macy MW. Diurnal and seasonal mood vary with work, sleep, and daylength across diverse cultures. Science. 2011;333(6051):1878–1881. doi: 10.1126/science.1202775. [DOI] [PubMed] [Google Scholar]
- 14.Rybski D, Buldyrev SV, Havlin S, Liljeros F, Makse HA. Communication activity in a social network: Relation between long-term correlations and inter-event clustering. Sci Rep. 2012;2:560. doi: 10.1038/srep00560. [DOI] [PMC free article] [PubMed] [Google Scholar]
- 15.Crandall DJ, et al. Inferring social ties from geographic coincidences. Proc Natl Acad Sci USA. 2010;107(52):22436–22441. doi: 10.1073/pnas.1006155107. [DOI] [PMC free article] [PubMed] [Google Scholar]
- 16.Milgram S. The frozen world of the familiar stranger. Psychol Today. 1974;17:70–80. [Google Scholar]
- 17.Paulos E, Goodman E. CHI Conf Proc. New York: ACM Press; 2004. The familiar stranger: Anxiety, comfort, and play in public places; pp. 223–230. [Google Scholar]
- 18.González MC, Hidalgo CA, Barabási A-L. Understanding individual human mobility patterns. Nature. 2008;453(7196):779–782. doi: 10.1038/nature06958. [DOI] [PubMed] [Google Scholar]
- 19.Song C, Qu Z, Blumm N, Barabási A-L. Limits of predictability in human mobility. Science. 2010;327(5968):1018–1021. doi: 10.1126/science.1177170. [DOI] [PubMed] [Google Scholar]
- 20.Brockmann D, Hufnagel L, Geisel T. The scaling laws of human travel. Nature. 2006;439(7075):462–465. doi: 10.1038/nature04292. [DOI] [PubMed] [Google Scholar]
- 21. Schönfelder S, Axhausen KW (2010) Urban Rhythms and Travel Behaviour: Spatial and Temporal Phenomena of Daily Travel (Ashgate, Farnham, UK)
- 22.Eubank S, et al. Modelling disease outbreaks in realistic urban social networks. Nature. 2004;429(6988):180–184. doi: 10.1038/nature02541. [DOI] [PubMed] [Google Scholar]
- 23.Wang P, González MC, Hidalgo CA, Barabási A-L. Understanding the spreading patterns of mobile phone viruses. Science. 2009;324(5930):1071–1076. doi: 10.1126/science.1167053. [DOI] [PubMed] [Google Scholar]
- 24.Smieszek T, et al. Reconstructing the 2003/2004 H3N2 influenza epidemic in Switzerland with a spatially explicit, individual-based model. BMC Infect Dis. 2011;11:115. doi: 10.1186/1471-2334-11-115. [DOI] [PMC free article] [PubMed] [Google Scholar]
- 25.Pelletier MP, Trépanier M, Morency C. Smart card data use in public transit: A literature review. Transp Res, Part C Emerg Technol. 2011;19:557–568. [Google Scholar]
- 26.Rohani P, Zhong X, King AA. Contact network structure explains the changing epidemiology of pertussis. Science. 2010;330(6006):982–985. doi: 10.1126/science.1194134. [DOI] [PubMed] [Google Scholar]
- 27.Pastor-Satorras R, Vespignani A. Epidemic spreading in scale-free networks. Phys Rev Lett. 2001;86(14):3200–3203. doi: 10.1103/PhysRevLett.86.3200. [DOI] [PubMed] [Google Scholar]
- 28.Watts DJ, Strogatz SH. Collective dynamics of ‘small-world’ networks. Nature. 1998;393(6684):440–442. doi: 10.1038/30918. [DOI] [PubMed] [Google Scholar]
- 29.Christakis NA, Fowler JH. Social contagion theory: Examining dynamic social networks and human behavior. Stat Med. 2013;32(4):556–577. doi: 10.1002/sim.5408. [DOI] [PMC free article] [PubMed] [Google Scholar]
- 30.Aral S, Muchnik L, Sundararajan A. Distinguishing influence-based contagion from homophily-driven diffusion in dynamic networks. Proc Natl Acad Sci USA. 2009;106(51):21544–21549. doi: 10.1073/pnas.0908800106. [DOI] [PMC free article] [PubMed] [Google Scholar]
- 31.Goffman W. Mathematical approach to the spread of scientific ideas—The history of mast cell research. Nature. 1966;212(5061):449–452. doi: 10.1038/212449a0. [DOI] [PubMed] [Google Scholar]
- 32.Vespignani A. Predicting the behavior of techno-social systems. Science. 2009;325(5939):425–428. doi: 10.1126/science.1171990. [DOI] [PubMed] [Google Scholar]
- 33.Nowak MA. Five rules for the evolution of cooperation. Science. 2006;314(5805):1560–1563. doi: 10.1126/science.1133755. [DOI] [PMC free article] [PubMed] [Google Scholar]
- 34.Palla G, Barabási A-L, Vicsek T. Quantifying social group evolution. Nature. 2007;446(7136):664–667. doi: 10.1038/nature05670. [DOI] [PubMed] [Google Scholar]
- 35.Ancel Meyers L, Newman MEJ, Martin M, Schrag S. Applying network theory to epidemics: Control measures for Mycoplasma pneumoniae outbreaks. Emerg Infect Dis. 2003;9(2):204–210. doi: 10.3201/eid0902.020188. [DOI] [PMC free article] [PubMed] [Google Scholar]
- 36.Christakis NA, Fowler JH. The spread of obesity in a large social network over 32 years. N Engl J Med. 2007;357(4):370–379. doi: 10.1056/NEJMsa066082. [DOI] [PubMed] [Google Scholar]
Associated Data
This section collects any data citations, data availability statements, or supplementary materials included in this article.