Abstract
Gaussian factor models have proven widely useful for parsimoniously characterizing dependence in multivariate data. There is a rich literature on their extension to mixed categorical and continuous variables, using latent Gaussian variables or through generalized latent trait models acommodating measurements in the exponential family. However, when generalizing to non-Gaussian measured variables the latent variables typically influence both the dependence structure and the form of the marginal distributions, complicating interpretation and introducing artifacts. To address this problem we propose a novel class of Bayesian Gaussian copula factor models which decouple the latent factors from the marginal distributions. A semiparametric specification for the marginals based on the extended rank likelihood yields straightforward implementation and substantial computational gains. We provide new theoretical and empirical justifications for using this likelihood in Bayesian inference. We propose new default priors for the factor loadings and develop efficient parameter-expanded Gibbs sampling for posterior computation. The methods are evaluated through simulations and applied to a dataset in political science. The models in this paper are implemented in the R package bfa.1
Keywords: Factor analysis, Latent variables, Semiparametric, Extended rank likelihood, Parameter expansion, High dimensional
1 Introduction
Factor analysis and its generalizations are powerful tools for analyzing and exploring multivariate data, routinely used in applications as diverse as social science, genomics and finance. The typical Gaussian factor model is given by
| (1.1) |
where yi is a p × 1 vector of observed variables, Λ is a p × k matrix of factor loadings (k < p), ηi ~ N(0, I) is a k × 1 vector of latent variables or factor scores, and εi ~ N(0, Σ) are idiosyncratic noise with . Marginalizing out the latent variables, yi ~ N(0, ΛΛ′ + Σ), so that the covariance in yi is explained by the (lower-dimensional) latent factors. The model in (1.1) may be generalized to incorporate covariates at the level of the observed or latent variables, or to allow dependence between the latent factors. For exposition we focus on this simple case.
This model has been extended to data with mixed measurement scales, often by linking observed categorical variables to underlying Gaussian variables which follow a latent factor model (e.g. Muthén (1983)). An alternative is to include shared latent factors in separate generalized linear models for each observed variable (Dunson, 2000, 2003; Moustaki and Knott, 2000; Sammel et al., 1997). Unlike in the Gaussian factor model the latent variables typically impact both dependence and the form of the marginal distributions. For example, suppose yi = (yi1, yi2)′ are bivariate counts assigned Poisson log-linear models: log E(yij | ηi) = μj + ληi. Then λ governs both the dependence between yi1, yi2 and the overdispersion in each marginal distribution. This confounding can lead to substantial artifacts and misleading inferences. Additionally, computation in such models is difficult and requiring marginal distributions in the exponential family can be restrictive.
There is a growing literature on semiparametric latent factor models to address the latter problem. A number of authors have proposed mixtures of factor models (Chen et al., 2010; Ghahramani and Beal, 2000). Song et al. (2010) instead allow flexible error distributions in Eq. (1.1). Yang and Dunson (2010) proposed a broad class of semiparametric structural equation models which allow an unknown distribution for ηi. When building such flexible mixture models there is a sacrifice to be made in terms of interpretation, parsimony and computation, and subtle confounding effects remain. It would be appealing to retain the simplicity, interpretability and computational scalability of Gaussian factor models while allowing the marginal distributions to be unknown and free of the dependence structure.
To accomplish these ambitious goals we propose a semiparametric Bayesian Gaussian copula model utilizing the extended rank likelihood of Hoff (2007) for the marginal distributions. This approximation avoids a full model specification and is in some sense not fully Bayesian, but in practice we expect that this rank-based likelihood discards only a mild amount of information while providing robust inference. An additional contribution of this paper is to provide new theoretical and empirical justification for this approach.
We proceed as follows: In Section 2, we propose the Gaussian copula factor model for mixed scale data and discuss its relationship to existing models. In Section 3 we develop a Bayesian approach to inference, specifying prior distributions and outlining a straightforward and efficient Gibbs sampler for posterior computation. Section 4 contains a simulation study, and Section 5 illustrates the utility of our method in a political science application. Section 6 concludes with a discussion.
2 The Gaussian copula factor model
A p-dimensional copula is a distribution function on [0, 1]p where each univariate marginal distribution is uniform on [0, 1]. Any joint distribution F can be completely specified by its marginal distributions and a copula; that is, there exists a copula such that
| (2.1) |
where Fj are the univariate marginal distributions of F (Sklar, 1959). If all Fj are continuous then is unique, otherwise it is uniquely determined on Ran(F1) × ⋯ × Ran(Fp) where Ran(Fj) is the range of Fj. The copula of a multivariate distribution encodes its dependence structure, and is invariant to strictly increasing transformations of its univariate margins. Here we consider the Gaussian copula:
| (2.2) |
where Φp(·|C) is the p-dimensional Gaussian cdf with correlation matrix C and Φ is the univariate standard normal cdf. Combining (2.1) and (2.2) we have
| (2.3) |
From (2.3) a number of properties are clear: The joint marginal distribution of any subset of y has a Gaussian copula with correlation matrix given by the appropriate submatrix of C, and yj ⫫ yj′ if and only if cjj′ = 0. When Fj, Fj′ are continuous, cj j′ = Corr(Φ−1(Fj(yj), Φ−1(Fj′ (yj′)) which is an upper bound on Corr(yj, yj′) (attained when the margins are Gaussian) (Klaassen and Wellner,1997). The rank correlation coefficients Kendall’s tau and Spearman’s rho are monotonic functions of cjj′ (Hult and Lindskog, 2002). For variables taking finitely many values cjj′ gives the polychoric correlation coefficient (Muthén, 1983).
If the margins are all continuous then zeros in R = C−1 imply conditional independence, as in the multivariate Gaussian distribution. However this is generally not the case when some variables are discrete. Even in the simple case where p = 3, Y3 is discrete and c13c23 ≠ 0, if r12 = 0 then Y1 and Y2 are in fact dependent conditional on Y3 (a similar result holds when conditioning on several continuous variables and a discrete variable as well - details available in supplementary materials). Results like these suggest that sparsity priors for R in Gaussian copula models (e.g. Dobra and Lenkoski (2011); Pitt et al. (2006)) are perhaps not always well-motivated when discrete variables are present, and should be interpreted only with great care.
A Gaussian copula model can be expressed in terms of latent Gaussian variables be the usual pseudo-inverse of Fj and suppose Ω is a covariance matrix with C as its correlation matrix. If z ~ N(0, Ω) and for 1 ≤ j ≤ p then F(y) has a Gaussian copula with correlation matrix C and univariate marginals Fj. We utilize this representation to generalize the Gaussian factor model to Gaussian copula factor models by assigning z a latent factor model:
| (2.4) |
Inference takes place on the scaled loadings
| (2.5) |
so that . Rescaling is important as the factor loadings are not otherwise comparable across the different variables - even though Λ is technically identified it is not easily interpreted. We also consider the uniqueness of variable j, given by
| (2.6) |
In the Gaussian factor model uj is , the proportion of variance unexplained by the latent factors. In the Gaussian copula factor model this exact interpretation does not hold, but uj still represents a measure of dependence on common factors.
2.1 Relationship to existing factor models
The Gaussian factor model and probit factor models are both special cases of the Gaussian copula factor model. Probit factor models for binary or ordered categorical data parameterize each margin by a collection of “cutpoints” γj0, … γjcj (taking γj0 = −∞ and γjcj = ∞ without loss of generality) so that . Then Fj has the pseudoinverse
Plugging this into (2.4) and simplifying gives where zi ~ N(0, ΛΛ′+I), the data augmented representation of an ordinal probit factor model. Naturally the connection extends to mixed Gaussian/probit margins as well.
Other factor models which have Gaussian/probit models as special cases include semiparametric factor models, which assume non-Gaussian latent variables ηi or errors εi, retaining the linear model formulation (1.1) so that marginally Cov(yi) = ΛCov(ηi)Λ′ + Σ. But F(yi) no longer has a Gaussian copula, and since the joint distribution is no longer elliptically symmetric the covariance matrix is unlikely to be an adequate measure of dependence. Further, the dependence and marginal distributions are confounded since the implied correlation matrix will depend on the parameters of the marginal distributions.
Our model overcomes these shortcomings. In the Gaussian copula factor model governs the dependence separately from the marginal distributions, representing a factor-analytic decomposition for the scale-free copula parameter C rather than Cov(yi). The Gaussian copula model is also invariant to strictly monotone transformations of univariate margins. Therefore it is consistent with the common assumption that there exist monotonic functions h1, … , hp such that (h1(y1), … hp(yp))′ follows a Gaussian factor model, while existing semiparametric approaches are not. Researchers using our method are not required to consider numerous univariate transformations to achieve “approximate normality”.
2.2 Marginal Distributions
One way to deal with marginal distributions in a copula model is to specify a parametric family for each margin and infer the parameters simultaneously with C (see e.g. Pitt et al. (2006) for a Bayesian approach). This is computationally expensive for even moderate p, and there is often no obvious choice of parametric family for every margin. Since our goal is not to learn the whole joint distribution but rather to characterize its dependence structure we would prefer to treat the marginal distributions as nuisance parameters.
When the data are all continuous a popular semiparametric method is a two-stage approach in which an estimator is used to compute “pseudodata” , which are treated as fixed to infer the copula parameters. A natural candidate is , the (scaled) empirical marginal cdf. Klaassen and Wellner (1997) considered such estimators in the Gaussian copula and Genest et al. (1995) developed them in the general case. However, this method cannot handle discrete margins. To accommodate mixed discrete and continuous data Hoff (2007) proposed an approximation to the full likelihood called the extended rank likelihood, derived as follows: Since the transformation is nondecreasing, when we observe yj = (y1j, … , ynj) we also observe a partial ordering on zj = (z1j, … znj). To be precise we have that
| (2.7) |
The set D(yj) is just the set of possible zj = (z1j, … , znj) which are consistent with the ordering of the observed data on the jth variable. Let . Then we have
| (2.8) |
where (2.8) holds because given C the event Z ∈ D(Y) does not depend on the marginal distributions. Hoff (2007) proposes dropping the second term in (2.8) and using P(Z ∈ D(Y)|C) as the likelihood. Intuitively we would expect the first term to include most of the information about C. Simulations in Section 4 provide further evidence of this. Hoff (2007) shows that when the margins are all continuous the marginal ranks satisfy certain relaxed notions of sufficiency for C, although these fail when some margins are discrete. Unfortunately theoretical results for applications involving mixed data have been lacking.
To address this we give a new proof of strong posterior consistency for C under the extended rank likelihood with nearly any mixture of discrete and continuous margins (barring pathological cases which preclude identification of C). Posterior consistency will generally fail under Gaussian/probit models when any margin is misspecified. A similar result for continuous data and a univariate rank likelihood was obtained by Gu and Ghosal (2009). We replace Y with Y(n) for notational clarity below.
Theorem 1. Let Π be a prior distribution on the space of all positive semidefinite correlation matrices with corresponding density π(C) with respect to a measure ν. Suppose π(C) > 0 almost everywhere with respect to ν and that F1, … , Fp, are the true marginal cdfs. Then for C0 a.e. [ν] and any neighborhood of C0 we have that
| (2.9) |
where is the distribution of under C0, F1, … Fp.
The proof is in Appendix A. We assumed a prior π(C) having full support on . Under factor-analytic priors fixing k < p restricts the support of π, and posterior consistency will only hold if C0 has a factor analytic decomposition in k or fewer factors. But by setting k large (or inferring it) it is straightforward to define factor-analytic priors which have full-support on (further discussion in Section 6). In practice, many correlation matrices which do not exactly have a k-factor decomposition are still well-approximated by a k-factor model. Finally, the result also applies to posterior consistency for if k is chosen correctly, given compatible identifying restrictions.
The efficiency of semiparametric estimators such as ours is also an important issue. Hoff et al. (2011) give some preliminary results which suggest that pseudo-MLE’s based on the rank likelihood for continuous margins may be asymptotically relatively efficient. However, it is unclear whether even these results apply to the case of mixed continuous and discrete margins, which is our primary focus. Simulations of the efficiency of posterior means under the extended rank likelihood versus correctly specified parametric models appear in Section 4.1. These results give an indication of the worst-case scenario in terms of efficiency lost in using the likelihood approximation, and are quite favorable in general.
3 Prior Specification and Posterior Inference
3.1 Prior Specification
Since the factor model is invariant under rotation or scaling of the loadings and scores we assume that sufficient identifying conditions are imposed (by introducing sign constraints and fixed zeros in Λ), or that inference is on C which does not suffer from this indeterminacy. For brevity we also assume here that k is known and fixed. Suggestions for incorporating uncertainty in k are in the Discussion.
A common prior for the unrestricted factor loadings in Gaussian, probit or mixed factor models is λjh ~ N(0, 1/b). However, these priors have some troubling properties outside the Gaussian factor model: When σj ≡ 1 as in probit or mixed Gaussian/probit factor models – or in our copula model – the implied prior on uj is
| (3.1) |
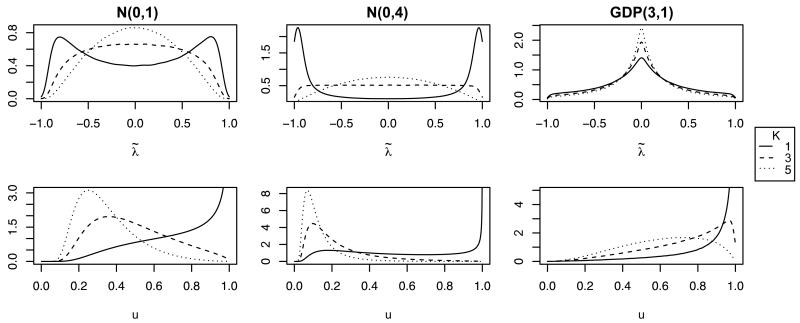
Figure 1 shows that these priors are quite informative on the uniquenesses, especially as k increases. When k is small they are particularly informative on the scaled loadings, shrinking toward large values, rather than toward zero. This effect becomes worse as the prior variance increases. The problem is that the normal prior puts insufficient mass near zero. Coupled with the normalization this results in a “smearing” of mass across the columns of , deflating uj, inducing spurious correlations, and giving inappropriately high probability to values of the scaled loadings near ±1. Therefore the normal prior is a very poor default choice in these models.
Figure 1.
Induced priors on the scaled factor loadings (top row) and uniquenesses (bottom row) implied by different priors as K varies
To address these shortcomings we consider shrinkage priors on λjh which place significant mass at or near zero. Such parsimony is also desirable for more interpretable results. Shrinkage priors have been thoroughly explored in the regression context (see e.g. Polson and Scott (2010) and references therein). In that context heavy-tailed distributions are desirable. While somewhat heavy tails are appealing here (so that decays slowly to zero as ), extremely heavy tails are inappropriate. Very heavy tails imply that with significant probability a single unscaled loading (say λjm) in a row j will be much larger than the others so that for 1 ≤ h ≤ k. The resulting joint prior on will assign undesirably high probability to vectors with one entry near ±1 and the rest near 0, yielding correlations which are approximately 0 or ±1. Applying these priors in this new setting requires extra care.
As a default choice we recommend the generalized double Pareto (GDP) prior of (Armagan and Dunson, 2011) which has the density
| (3.2) |
which we will refer to as λjh ~ GDP(α, β). The GDP is a flexible generalization of the Laplace distribution with a sharper peak at zero and heavier tails. It has the following scale-mixture representation: and ξjh ~ Ga(α, β) which leads to conditional conjugacy and a simple Gibbs sampler. The GDP’s tail behavior is determined by α, and β is a scale parameter. Armagan and Dunson (2011) handle the hyperparameters by either fixing them both at 1 or assigning them a hyperprior. Here taking α = 3, β = 1 is a good default choice: The GDP(3, 1) distribution has mean 0 and variance 1, and Pr(|λjh| < 2) ≈ 0.96. Critically, taking α = 3 leads to tails of π(λjh) light enough to induce a sensible prior on .
Figure 1 shows draws from the implied prior on uj and under the GDP(3, 1) prior, which are much more reasonable than the current default Normal priors. Note that as K increases, the prior puts increasing mass near zero without changing a great deal in the tails. This is reasonable since we expect each variable to load highly on only a few factors, and is difficult to mimic with the light-tailed normal priors. The prior on the uniquenesses remains relatively flat under the GDP prior, while the normal prior increasingly favors lower values and less parsimony.
3.2 Parameter-Expanded Gibbs Sampling
For efficient MCMC inference we introduce a parameter-expanded (PX) version of our original model. The PX approach (Liu and Wu, 1999; Meng and Van Dyk, 1999) adds redundant (non-identified) parameters to reduce serial dependence in MCMC and improve convergence and mixing behavior. Naive Gibbs sampling in our model suffers from high autocorrelation due to strong dependence between Z and Λ. We modify (2.4) by adding scale parameters to weaken this dependence:
| (3.3) |
Since wij/vj and zij are equal in distribution (3.3) is observationally equivalent to the original model. We assume that V is independent of the inferential parameters a priori so that π(Λ, H, V|Y) = π(Λ, H|Y)π(V) (where H′ is the n × k matrix with entries ηik) and the marginal posterior distribution of the inferential parameters is unchanged.
We choose the conjugate PX prior (independently). The greatest benefits from PX are realized when the PX prior is most diffuse, which would imply sending n0 → 0 and an improper PX prior. The resulting posterior for (Λ, H, V) is also improper, but we can prove that the samples of (Λ, H) from the corresponding Gibbs sampler still have the desired stationary distribution π(Λ, H|Y) (Appendix B). The PX Gibbs sampler is implemented as follows:
PX parameters
Draw where and
Factor Loadings
We assume a lower triangular loadings matrix with a positive diagonal; the extension to other constraints is straightforward. Let kj = max(k, j) and be the n × kj matrix with entries ηik for 1 ≤ k ≤ kj and 1 ≤ i ≤ n. Update nonzero elements in row j of Λ as where and λjj is restricted to be positive if j ≤ k.
Hyperparameters
Update and (ξjh|−) ~ Ga(α + 1, β + |λjh|) where InvGauss(a, b) is the inverse-Gaussian distribution with mean a and scale b.
Factor scores
Draw ηi from
Augmented Data
Update Z elementwise from
| (3.4) |
where T N(m, v, a, b) denotes the univariate normal distribution with mean m and variance v truncated to (a, b), and . If yij is missing then . Note that (3.4) doesn’t require a matrix inversion since (zij ⫫ zij′ | Λ, ηi, Y) for j ≠ j′, a unique property of our factor analytic representation and a significant computational benefit as p grows.
The PX-Gibbs sampler has mixing behavior at least as good as Gibbs sampling under the original model (which fixes V = I) (Liu and Wu, 1999; Meng and Van Dyk, 1999), and the additional computation is negligible. The PX-Gibbs sampler often increases the smallest effective sample size (associated with the largest loadings) by an order of magnitude or more in both real and synthetic data. The improved mixing is also vital for the multimodal posteriors sometimes induced by shrinkage priors. To our knowledge this is the first application of PX to factor analysis of mixed data, but PX has previously been applied to Gibbs sampling in Gaussian factor models by Ghosh and Dunson (2009) who introduce scale parameters for ηi to reduce dependence between H and Λ. Since MCMC in our model suffers primarily from dependence between Z and Λ our approach is more appropriate. Hoff (2007) and Dobra and Lenkoski (2011) also use priors on unidentified covariance matrices to induce a prior on correlation matrices in Gaussian copula models. But the motivation there is simply to derive tractable MCMC updates and dependence between the priors on C and V precludes our strategy of choosing an optimal PX prior, limiting the benefits of PX.
3.3 Posterior Inference
Given MCMC samples we can address a number of inferential problems. The posterior distribution of the factor scores ηi provide a measure of the latent variables for each data point, describing a projection of the observed data into the latent factor space, and the factors themselves are characterized by the variables which load highly on them. Even if the factors are not directly interpretable this is a very useful exploratory technique for mixed data which is robust to outliers and handles missing data automatically (unlike common alternatives such as principal component analysis).
We can also do inference on conditional or marginal dependence relationships in yi. Here there is no need for identifying constraints in Λ which simplifies model specification. Tests of independence like H0 : cjj′ ≤ ε versus H1 : cjj′ > ε are simple to construct from MCMC output. When the variables are continuous the conditional dependence relationships are encoded in R = C−1 which we can compute as
| (3.5) |
Eq. (3.5) requires calculating only k-dimensional inverses, rather than p-dimensional inverses, a significant benefit of our factor-analytic representation.
As discussed in Section 2 the presence of discrete variables complicates inference on conditional dependence. Additionally, two discrete variables may be effectively marginally independent even if |cjj′ | > 0 simply by virtue of their levels of discretization. For these reasons, and for more readily interpretable results, it can be valuable to consider aspects of the posterior predictive distribution π(y*|Y). Under our semiparametric model this distribution is somewhat ill-defined, but we can sample from an approximation to π(y*|Y) by drawing via the PX-Gibbs sampler, drawing and setting where are estimators of each marginal distribution. This disregards some uncertainty when making predictions; Hoff (2007) provides an alternative based on the values of , from (3.4) but (in keeping with his observations) we find both approaches to perform similarly.
Posterior predictive sampling of conditional distributions is detailed in Section 2 of the supplement. Importantly, the factor-analytic representation of C allows us to directly sample any conditional distributions of interest (rather than using rejection sampling from the joint posterior predictive) by reducing the problem of sampling a truncated multivariate normal distribution to that of sampling independent truncated univariate normals.
4 Simulation Study
When fitting models in the following simulations we used the GDP(3, 1) prior for λjk and take 1/σ2 ~ Gamma(2, 2) for the Gaussian factor model and uniform priors on the cutpoints in the probit model. The cutpoints in the probit model were updated using independence Metropolis-Hastings steps with a proposal derived from the empirical cdfs. All models were fit using our R package.
4.1 Relative efficiency
First we examine finite-sample relative efficiency of the extended rank likelihood in the “worst-casse scenario” (for our method). We compare the posterior mean correlation matrix under the Gaussian copula factor model with the extended rank likelihood to that under 1) a Gaussian factor model, when the factor model is true and 2) a probit factor model, when the probit model is true. Both are special cases of the Gaussian copula factor model so we can directly compare the parameters.
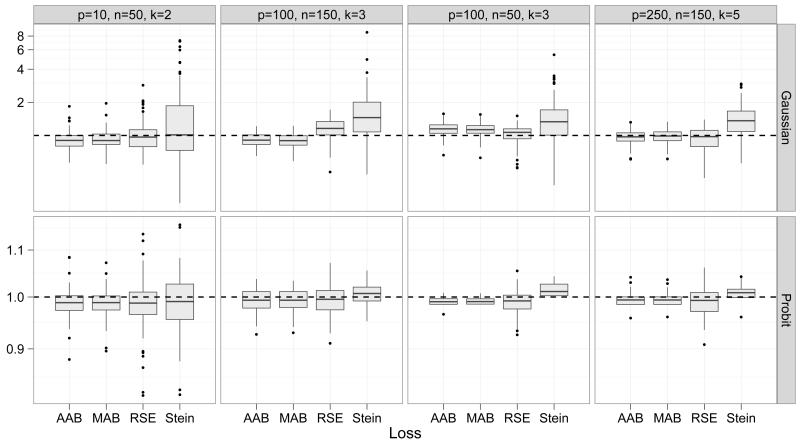
The true (unscaled) factor loadings were sampled iid GDP(3, 1). For the probit case each margin had five levels with probabilities sampled Dirichlet(1/2, … , 1/2). We fix k at the truth; additional simulations suggest that the relative performance is similar under misspecified k. We performed 100 replicates for various p/k/n combinations in Fig. 2. Each model was fit using 100,000 MCMC iterations after a 10,000 burn-in, keeping every 20th sample. MCMC diagnostics for a sample of the fitted models indicated no convergence issues. We assess the performance of each method by computing a range of loss functions: Average and maximum absolute bias ( and respectively), root squared error: and Stein’s loss: . Stein’s loss is (up to a constant) the KL divergence from the Gaussian copula density with correlation matrix C to the Gaussian copula density with correlation matrix Ĉ and is therefore natural to consider here.
Figure 2.
Efficiency (ratio of the loss under our model to that under the Gaussian/probit model) of the posterior mean under a range of loss functions
Figure 2 shows that the two methods are more or less indistinguishable in the probit case. Our method slightly outperforms the probit model in many cases because we do not have to specify a prior for the cutpoints. There are also some computational benefits here since in the copula model we avoid Metropolis-Hastings steps for the marginal distributions. In the continuous case our model also does well, although the Gaussian model is somtimes substantially more efficient under Stein’s loss. But as p grows our model is increasingly competitive.
4.2 Misspecification Bias and Consistency
The previous simulations suggest that the loss in efficiency in worst-case scenarios is quite often minimal. To illustrate the practical benefit of our model (and the impact of our consistency result) in a realistic scenario we simulated data from a one-factor Gaussian copula factor model using the marginal distributions from Section 5 (Fig. 4). For simplicity we take and consider and 0.8 (although we did not constrain the loadings to be equal when fitting models to the simulated data). Results in Section 5 suggest that these are plausible values.
Figure 4.
Distributions of 4 variables from the political risk dataset in Quinn (2004). The fifth, Ind.Jud, is binary with 34/62 ones.
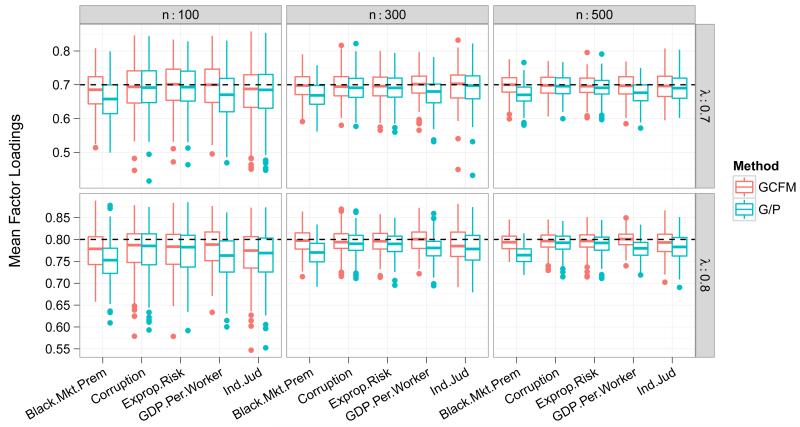
Figure 3 shows that factor loadings for the two continuous variables (Black.Mkt.Premium and GDP.Per.Worker) are underestimated by the Gaussian/probit model. When all the variables are dependent there is a “ripple” effect so that even factor loadings for discrete variables are subject to some bias. We should expect this behavior in general – the copula correlations bound the observed Pearson correlations from above (in absolute value), with the bounds obtained only under Gaussian margins. The difference between the Pearson and copula correlation parameters, and hence the asymptotic bias, depends entirely on the form of the marginal distributions. This makes proper choices of transformations critical in the parametric model. Our model relieves this concern entirely. Although the magnitude of these effects is relatively mild here there is little reason to suspect this is true in general, especially in more complex models with multiple factors and a larger number of observed variables.
Figure 3.
Posterior mean factor loadings using 100 simulated datasets generated with the margins in Section 5 using our model (GCFM) versus a mixed Gaussian/probit model (G/P).
5 Application: Political-Economic Risk
Quinn (2004) considers measuring political-economic risk, a latent quantity, using five proxy variables and a Gaussian/probit factor model. The author defines political-economic risk as the risk of a state “manipulat[ing] economic rules to the advantage of itself and its constituents” following (North and Weingast, 1989, pp. 808). The dataset includes five indicators recorded for 62 countries: independent judiciary, black market premium, lack of appropriation risk, corruption, and gross domestic product per worker (GDPW) (Fig. 4). Additional background on political-economic risk and on the variables in this dataset is provided by Quinn (2004), and the data are available in the R package MCMCpack. Quinn (2004) transforms the positive continuous variables GDPW and black market premium by log(x) and log(x+0.001) (resp.). The disproportionate number of zeros in black market premium (14/62 observations) leaves a large spike in the left tail and the normality assumption is obviously invalid. Since Quinn (2004) has already implicitly assumed a Gaussian copula, our model is a natural alternative to the misspecified Gaussian/probit model used there.
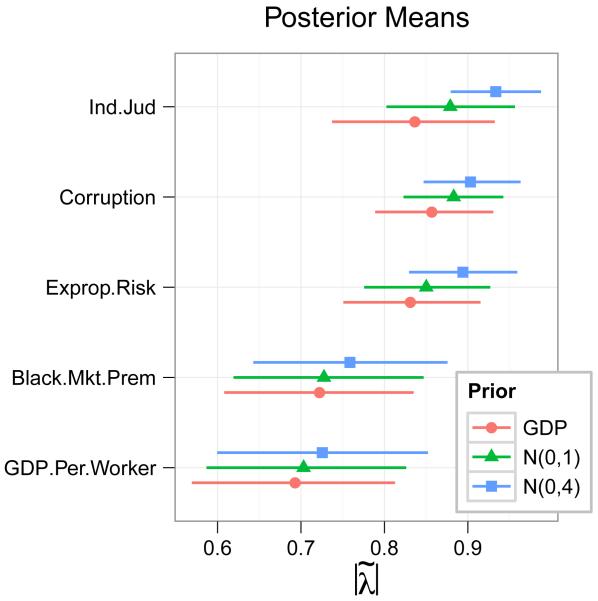
To explore sensitivity to prior distributions we fit the copula model under several priors: GDP(3, 1), N(0, 1) and the N(0, 4) priors used by Quinn (2004). We use 100,000 MCMC iterations and save every 10th sample after a burn-in of 10,000 iterations. Standard MCMC diagnostics gave no indication of lack of convergence. Figure 5 shows posterior means and credible intervals for the scaled loadings under each prior. Note that the N(0, 4) prior, intended to be noninformative, is actually very informative on the scaled loadings (Fig 1). It pulls the scaled loadings toward ±1, with most pronounced influence on the binary variable Ind.Jud and the other categorical variables. The GDP prior instead shrinks toward zero as we would expect.
Figure 5.
Posterior means/90% HPD intervals for scaled factor loadings under the different priors. Differences due to priors are larger for discrete variables, and largest for Ind.Jud (which is binary)
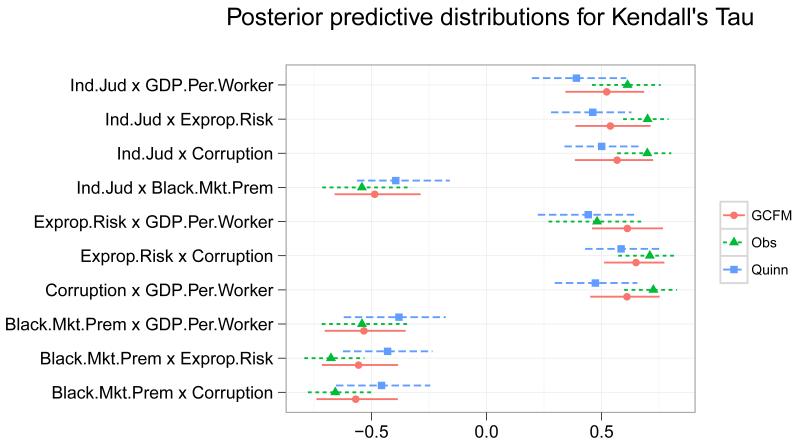
We also compare our model to the Gaussian/probit model in Quinn (2004), but using the GDP(3, 1) prior in both cases. Figure 6 shows posterior predictive means and credible intervals for Kendall’s tau, as well as the observed values and bootstrapped confidence intervals. Our model fits well, considering the limited sample size, and fits almost uniformly better than the Gaussian-probit model. Other posterior predictive checks on rank correlation measures and in subsets of the data show similar results.
Figure 6.
Posterior predictive mean and 95% HPD intervals of Kendall’s τ under our model (Cop) and the Gaussian-probit model (Mix) as well as the observed values and bootstrapped 95% confidence intervals.
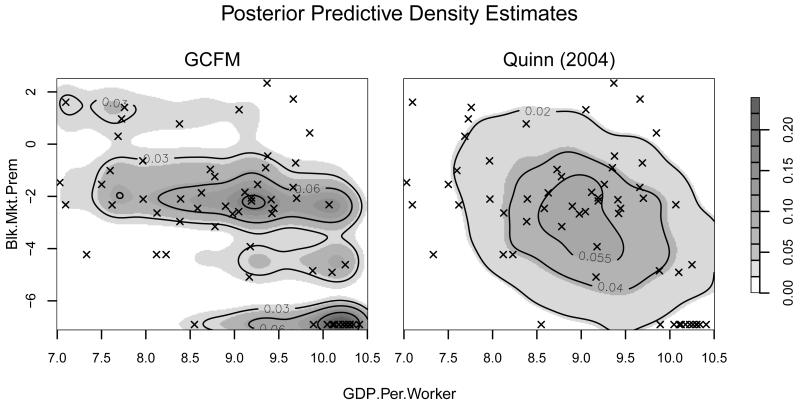
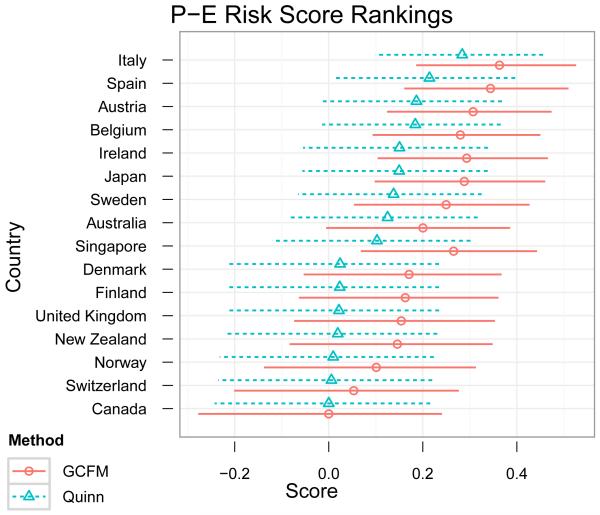
Incorrectly assuming a normal distribution for log black market premium is especially damaging. The copula correlation between GDPW and black market premium (on which the data are most informative) is underestimated in the Gaussian/probit model: mean −0.33 and 95% HPD interval (−0.46, −0.22) as opposed to −0.56 and (−0.73, −0.40) under our model. This is also evident in the posterior predictive samples of Kendall’s τ in Fig. 6. Figure 7 shows density estimates of draws from the bivariate posterior predictive of black market premium and GDPW. The Gaussian/probit model is clearly not a good fit, assigning very little mass to the bottom-right corner (which contains almost 25% of the data). The Gaussian copula factor model assigns appropriately high density to this region. Estimates of the latent variables are impacted as well: Figure 8 plots the mean factor scores from each model (after shifting and scaling to a common range) for low-risk countries. The seven countries with the lowest risk have identical covariate values except on GDPW. Our model infers mean scores that are sorted by GDPW (higher GDPW yielding a lower score). The Gaussian/probit model instead assigns these countries almost identical scores.
Figure 7.
Posterior predictive distributions of log GDP and log black market premium, with observed data scatterplots. Note the cluster of points in the bottom-right corner; even though they represent over 20% of the sample the predictive density from the model in Quinn (2004) assigns very little mass to this area.
Figure 8.
Comparison of the political-economic risk ranking obtained via our model and the mixed-data factor analysis of Quinn (2004). Points are posterior means and lines represent marginal 90% credible intervals.
6 Discussion
In this paper we have developed a new semiparametric approach to the factor analysis of mixed data which is both robust and efficient. We propose new default prior distributions for factor loadings which are more suited to routine use of this model (and similar models, such as probit factor models). As a byproduct we also induce attractive new priors on correlation matrices in Gaussian copula models; these are both more flexible and parsimonious than the inverse Wishart prior used by Hoff (2007), and much more efficient computationally than the graphical model priors of Dobra and Lenkoski (2011). They admit optimal parameter expansion schemes which are easy to implement, and are readily extended to informative specifications, to include covariates or to more complex latent variable models.
We have not considered the issue of uncertainty in the number of factors, but it is straightforward to do so by adapting existing methods for Gaussian factor models. In addition to posterior predictive checks, these include stochastic search (Carvalho et al., 2008), reversible jump MCMC (Lopes and West, 2004), Bayes factors (Ghosh and Dunson, 2009; Lopes and West, 2004) and nonparametric priors (Bhattacharya and Dunson, 2011; Paisley and Carin, 2009). The latter are especially promising when interest lies in C since they preserve the computational advantages of factor-analytic priors while providing full support on correlation matrices (which fails for fixed k < p). Particularly when the plausible range of k is quite small, posterior predictive checking can be very effective.
Supplementary Material
Acknowledgments
We would like to acknowledge the support of the Measurement to Understand Re-Classifcation of Disease of Cabarrus and Kannapolis (MURDOCK) Study and the NIH CTSA (Clinical and Translational Science Award) 1UL1RR024128-01, without whom this research would not have been possible. The first author would also like to thank Richard Hahn, Jerry Reiter and Scott Schmidler for helpful discussion.
Appendix
A Proof of Theorem 1
Proof. We require a variant of Doob’s theorem, presented in Gu and Ghosal (2009):
Doob’s Theorem. Let Xi be observations whose distributions depend on a parameter θ, both taking values in Polish spaces. Assume θ ~ Π and Xi|θ ~ Pθ. Let be the σ-field generated by X1, … , XN and . If there exists a measurable function f such that for then the posterior is strongly consistent at θ for almost every θ [Π].
Therefore we must establish the existence of a consistent estimator of C which is measurable with respect to the σ-field generated by the sequence (a coarsening of the σ-field generated by . Let . Let Rni(Y(n) be the p-vector with entry j given by Rnij and let . Observe that the information contained in the extended rank likelihood (namely the boundary conditions in the definition of the set D(Y(n))) is equivalent to the information contained in Rn(Y(n). Hence a function that is measurable with respect to , the σ-field generated by , is also measurable with respect to the σ-field generated by and we may work exclusively with the former.
Let and . Then where Uij = Fj(yij) by the SLLN, so and therefore Ui is measurable. Note that if Fj is discrete Uij is merely a relabeling of yij (each category/integer is “labeled” with its marginal cumulative probability). So Ui is a sample from a Gaussian copula model with correlation matrix C0 where the continuous margins are all U[0, 1] and the discrete marginal distributions are completely specified. The problem of estimating C from Ui reduces to estimating ordinary and polychoric/polyserial correlations with fixed marginals and it is straightforward to verify that the distribution of Ui is a regular parametric family admitting a consistent estimator of C, say hN(U1, … , UN). Therefore there exists a sequence of measurable functions hN(U1, … , UN) → h(U1, U2, …) = C0 almost surely and
| (A.1) |
where (A.1) holds because a null set under the measure induced by Rn(Y(n) is also null under .
Appendix
B Validity of the PX Sampler
Let Θ be the inferential parameters and let Our working prior for (v1, … vp) is . To verify that samples of Θ from the PX-Gibbs sampler have stationary distribution π(Θ|Y) we need to show that as n0 → 0 the transition kernels under the marginal sampling scheme (alternately drawing from π(W|Θ,Y) and π(Θ|W)) and the blocked sampling scheme (alternately drawing from π(W|Θ, V, Y) and π(Θ, V|W)) converge (Meng and Van Dyk, 1999). The tth updates under the two schemes are as follows:
Scheme 1: Draw and . Set r = vj0/vj1 and draw
Scheme 2: Draw . Set r = v(t−1)j/vtj and draw
Updates for the rest of Θ under both schemes are the same as in Section 3.2. As n0 → 0 under Scheme 1 the distribution of approaches a point mass at 1 and Scheme 1 converges to Scheme 2 with n0 = 0.
Footnotes
Available from http://stat.duke.edu/~jsm38/software/bfa
Contributor Information
Jared S. Murray, Dept. of Statistical Science, Duke University, Durham, NC 27708 (jared.murray@stat.duke.edu).
David B. Dunson, Dept. of Statistical Science, Duke University Durham, NC 27708 (dunson@stat.duke.edu).
Lawrence Carin, William H. Younger Professor, Dept. of Electrical & Computer Engineering, Pratt School of Engineering, Duke University, Durham, NC 27708 (lcarin@ee.duke.edu).
Joseph E. Lucas, Institute for Genome Sciences and Policy, Duke University, Durham, NC 27710 (joe@stat.duke.edu).
References
- Armagan A, Dunson D. Generalized double Pareto shrinkage. Arxiv preprint arXiv:1104.0861. 2011 [PMC free article] [PubMed] [Google Scholar]
- Bhattacharya A, Dunson DB. Sparse Bayesian infinite factor models. Biometrika. 2011;98(2):291–306. doi: 10.1093/biomet/asr013. [DOI] [PMC free article] [PubMed] [Google Scholar]
- Carvalho CM, Chang J, Lucas JE, Nevins JR, Wang Q, West M. High-Dimensional Sparse Factor Modeling: Applications in Gene Expression Genomics. Journal of the American Statistical Association. 2008;103(484):1438–1456. doi: 10.1198/016214508000000869. [DOI] [PMC free article] [PubMed] [Google Scholar]
- Chen M, Silva J, Paisley J, Wang C, Dunson D, Carin L. Compressive Sensing on Manifolds Using a Nonparametric Mixture of Factor Analyzers: Algorithm and Performance Bounds. IEEE Transactions on Signal Processing. 2010;58(12):6140–6155. doi: 10.1109/TSP.2010.2070796. [DOI] [PMC free article] [PubMed] [Google Scholar]
- Dobra A, Lenkoski A. Copula Gaussian graphical models and their application to modeling functional disability data. The Annals of Applied Statistics. 2011;5(2A):969–993. [Google Scholar]
- Dunson D. Bayesian latent variable models for clustered mixed outcomes. Journal of the Royal Statistical Society. Series B (Statistical Methodology) 2000;62(2):355–366. [Google Scholar]
- Dunson DB. Dynamic Latent Trait Models for Multidimensional Longitudinal Data. Journal of the American Statistical Association. 2003;98(463):555–563. [Google Scholar]
- Genest C, Ghoudi K, Rivest L-P. A Semiparametric Estimation Procedure of Dependence Parameters in Multivariate Families of Distributions. Biometrika. 1995;82(3):543. [Google Scholar]
- Ghahramani Z, Beal M. Variational inference for Bayesian mixtures of factor analysers. Advances in neural information processing systems. 2000;12:449–455. [Google Scholar]
- Ghosh J, Dunson DB. Default Prior Distributions and Efficient Posterior Computation in Bayesian Factor Analysis. Journal of Computational and Graphical Statistics. 2009;18(2):306–320. doi: 10.1198/jcgs.2009.07145. [DOI] [PMC free article] [PubMed] [Google Scholar]
- Gu J, Ghosal S. Bayesian ROC curve estimation under binormality using a rank likelihood. Journal of Statistical Planning and Inference. 2009;139(6):2076–2083. [Google Scholar]
- Hoff P. Extending the rank likelihood for semiparametric copula estimation. Annals of Applied Statistics. 2007;1(1):265–283. [Google Scholar]
- Hoff P, Niu X, Wellner J. Information bounds for Gaussian copulas. Arxiv preprint arXiv:1110.3572. 2011:1–24. doi: 10.3150/12-BEJ499. [DOI] [PMC free article] [PubMed] [Google Scholar]
- Hult H, Lindskog F. Multivariate extremes, aggregation and dependence in elliptical distributions. Advances in Applied Probability. 2002;34(3):587–608. [Google Scholar]
- Klaassen C, Wellner J. Efficient estimation in the bivariate normal copula model: normal margins are least favourable. Bernoulli. 1997:55–77. [Google Scholar]
- Liu JS, Wu YN. Parameter Expansion for Data Augmentation. Journal of the American Statistical Association. 1999;94(448):1264. [Google Scholar]
- Lopes H, West M. Bayesian model assessment in factor analysis. Statistica Sinica. 2004;14(1):41–68. [Google Scholar]
- Meng X, Van Dyk D. Seeking Efficient Data Augmentation Schemes via Conditional and Marginal Augmentation. Biometrika. 1999;86(2):301. [Google Scholar]
- Moustaki I, Knott M. Generalized latent trait models. Psychometrika. 2000;65(3):391–411. [Google Scholar]
- Muthén B. Latent Variable Structural Equation Modeling with Categorical Data. Journal of Econometrics. 1983;22(1-2):43–65. [Google Scholar]
- North DC, Weingast BR. Constitutions and commitment: the evolution of institutions governing public choice in seventeenth-century England. The journal of economic history. 1989;49(04):803–832. [Google Scholar]
- Paisley J, Carin L. Nonparametric factor analysis with beta process priors; Proceedings of the 26th Annual International Conference on Machine Learning - ICML ‘09.2009. pp. 1–8. [Google Scholar]
- Pitt M, Chan D, Kohn R. Efficient Bayesian inference for Gaussian copula regression models. Biometrika. 2006;93(3):537–554. [Google Scholar]
- Polson N, Scott J. Shrink Globally, Act Locally: Sparse Bayesian Regularization and Prediction. Bayesian Statistics. 2010:9. [Google Scholar]
- Quinn KM. Bayesian Factor Analysis for Mixed Ordinal and Continuous Responses. Political Analysis. 2004;12(4):338–353. [Google Scholar]
- Sammel M, Ryan L, Legler J. Latent Variable Models for Mixed Discrete and Continuous Outcomes. Journal of the Royal Statistical Society: Series B (Statistical Methodology) 1997;59(3):667–678. [Google Scholar]
- Sklar A. Fonctions de répartitionà n dimensions et leurs marges. Publ. Inst. Statist. Univ. Paris. 1959;8:229–231. [Google Scholar]
- Song X-Y, Pan J-H, Kwok T, Vandenput L, Ohlsson C, Leung P-C. A semiparametric Bayesian approach for structural equation models. Biometrical journal. Biometrische Zeitschrift. 2010;52(3):314–32. doi: 10.1002/bimj.200900135. [DOI] [PubMed] [Google Scholar]
- Yang M, Dunson DB. Bayesian Semiparametric Structural Equation Models with Latent Variables. Psychometrika. 2010;75(4):675–693. [Google Scholar]
Associated Data
This section collects any data citations, data availability statements, or supplementary materials included in this article.


