


Abstract
The 2′-deoxynucleoside containing the synthetic base 1-[(2R,4S,5R)-4-hydroxy-5-(hydroxymethyl)-tetrahydrofuran-2-yl)-1H-perimidin-2(3H)-one] (dPer) recognizes in DNA the O6-benzyl-2′-deoxyguanosine nucleoside (O6-Bn-dG), formed by exposure to N-benzylmethylnitrosamine. Herein, we show how dPer distinguishes between O6-Bn-dG and dG in DNA. The structure of the modified Dickerson–Drew dodecamer (DDD) in which guanine at position G4 has been replaced by O6-Bn-dG and cytosine C9 has been replaced with dPer to form the modified O6-Bn-dG:dPer (DDD-XY) duplex [5′-d(C1G2C3X4A5A6T7T8Y9G10C11G12)-3′]2 (X = O6-Bn-dG, Y = dPer) reveals that dPer intercalates into the duplex and adopts the syn conformation about the glycosyl bond. This provides a binding pocket that allows the benzyl group of O6-Bn-dG to intercalate between Per and thymine of the 3′-neighbor A:T base pair. Nuclear magnetic resonance data suggest that a similar intercalative recognition mechanism applies in this sequence in solution. However, in solution, the benzyl ring of O6-Bn-dG undergoes rotation on the nuclear magnetic resonance time scale. In contrast, the structure of the modified DDD in which cytosine at position C9 is replaced with dPer to form the dG:dPer (DDD-GY) [5′-d(C1G2C3G4A5A6T7T8Y9G10C11G12)-3′]2 duplex (Y = dPer) reveals that dPer adopts the anti conformation about the glycosyl bond and forms a less stable wobble pairing interaction with guanine.
INTRODUCTION
The alkylation of deoxyguanosine in DNA at the O6 position, exemplified by exposure to N-benzylmethylnitrosamine and the formation of O6-benzyl-2′-deoxyguanosine nucleoside (O6-Bn-dG), is cytotoxic (1) and mutagenic (2,3). The O6-Bn-dG lesion is representative of bulky DNA adducts involved in the initiation of gene mutations (4,5). It predominantly causes G→A transitions (6,7) and is observed in human cells (8). The development of synthetic nucleotides as chemical probes enabling site-specific reporting of such DNA damage is of interest (9–22). The 2′-deoxynucleoside containing the synthetic base 1-[(2R,4S,5R)-4-hydroxy-5-(hydroxymethyl)-tetrahydrofuran-2-yl)-1H-perimidin-2(3H)-one] (dPer; Chart 1) recognizes the O6-Bn-dG in DNA (23). Analyses of DNA containing O6-Bn-dG or dPer paired opposite each other or natural bases have demonstrated that the O6-Bn-dG:dPer pair is more stable than any pairing of the damaged base opposite any natural base, or of dPer opposite a natural base (23). Developing an understanding of the structural basis for O6-Bn-dG recognition is critical to further developing nucleosides such as dPer to recognize these mutagenic lesions.
Chart 1.
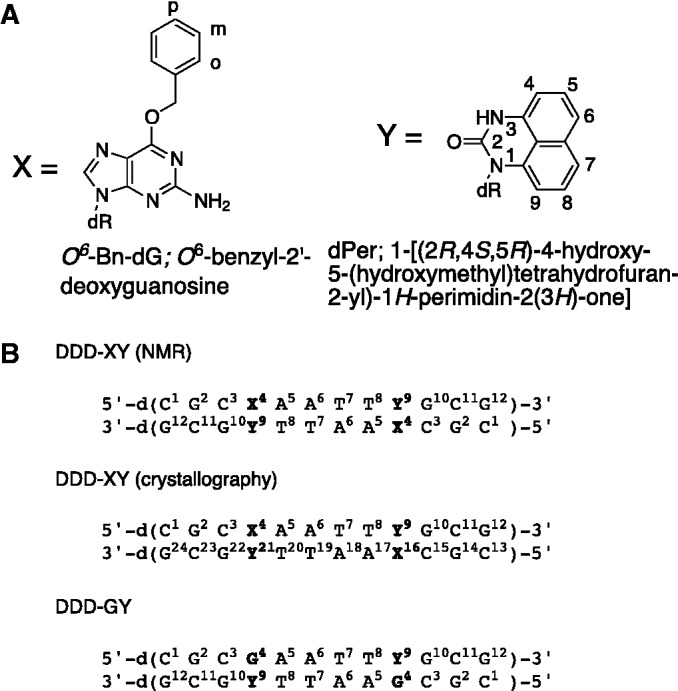
(A) Structures of O6-Bn-dG and dPer. (B) Sequences and numbering of the DDD-XY, DDD-XY and DDD-GY DDDs. The dodecamer exhibits pseudo-dyad symmetry, and in NMR spectra, both strands are numbered identically from nucleotides C1 to G12. The two strands are not symmetry related in the crystalline lattice and in crystallographic structures, the nucleotides are numbered from C1 to G12 in the first and from C13 to G24 in the second strand.
Herein, we explain the molecular basis by which dPer distinguishes between O6-Bn-dG and dG. When deoxyguanosine at position G4 of the Dickerson–Drew dodecamer (DDD) (24) was replaced by O6-Bn-dG, and deoxycytosine C9 was replaced with dPer to form the modified O6-Bn-dG:dPer (DDD-XY) duplex [5′-d(C1G2C3X4A5A6T7T8Y9G10C11G12)-3′]2 (X = O6-Bn-dG, Y = dPer) (Chart 1), dPer intercalated into the duplex and adopted the syn conformation about the glycosyl bond. This provides a binding pocket that allows the benzyl group of O6-Bn-dG to intercalate between Per and thymine of the 3′-neighbor A:T base pair. In contrast, when deoxycytosine at position C9 is replaced with dPer to form the duplex containing the dG:dPer base pair (DDD-GY) [5′-d(C1G2C3G4A5A6T7T8Y9G10C11G12)-3′]2 (Y = dPer), dPer adopts the anti conformation about the glycosyl bond and forms a less stable wobble pair with deoxyguanosine.
MATERIALS AND METHODS
Materials
The unmodified 5′-dCGCGAATTCGCG-3′ (DDD) was synthesized by the Midland Reagent Company (Midland, TX) and purified by anion-exchange high-performance liquid chromatography. The modified oligodeoxynucleotides were synthesized using an ABI 394 DNA synthesizer (Applied Biosystems, Foster City, CA) or a Mermade 9 DNA synthesizer (Bioautomation, Irving, TX) using β-cyanoethyl phosphoramidite chemistry. The dPer (23) and O6-Bn-dG phosphoramidites were prepared as described previously (25). The yields of the stepwise coupling reactions were monitored by trityl cation response. The oligodeoxynucleotides were removed from the resin by treating with 18 M (saturated) ammonium hydroxide for 1.5 h at 25°C. After filtration, the resulting solutions were heated at 55°C for 6 h to deprotect the oligodeoxynucleotides. All oligodeoxynucleotides were purified by semi-preparative reverse-phase high-performance liquid chromatography (Phenomenex, Phenyl-Hexyl, 5 µm, 250 mm × 10.0 mm) equilibrated with 0.1 M triethylammonium acetate (pH 7.0). The oligodeoxynucleotides were desalted by passing over Sephadex G-25 and characterized by matrix-assisted laser-desorption-ionization time-of-flight mass spectrometry. The concentrations of single-stranded oligodeoxynucleotides were estimated by ultraviolet (UV) absorbance at 260 nm on the basis of an extinction coefficient of 1.11 × 10⁵ M−1 cm−1, which was not adjusted for the presence of the modified bases (26). The oligodeoxynucleotides were annealed by heating to 80°C for 15 min and then cooled to room temperature.
Thermal denaturation studies
Melting temperatures were measured with a Varian Cary 100 Bio spectrophotometer operated at 260 nm. The buffer used for measurements contained 10 mM sodium phosphate, 50 μM Na2EDTA and 0.1 M NaCl (pH 7). The temperature was increased from 10 to 80°C at a rate of 0.5°C/min. Melting temperatures were calculated from first-order derivatives of the absorbance versus temperature profiles. The concentration of DNA was 1.5 µM.
Crystallizations and data collection of the DDD-XY duplex
Crystallization trials were performed with the Nucleic Acid Mini screen (27) (Hampton Research, Aliso Viejo, CA). The hanging drop vapor diffusion technique was used. DNA was desalted and prepared in water at 1.2 mM concentration. Droplets with volume 2 µl of a 1:1 mixture of sample and mini-screen buffer were equilibrated against 0.75 ml of 35% 2-methyl-2,4-pentanediol (MPD) at 18°C. Two crystals were obtained and found to be suitable for data collection. The first was crystalized from 10% MPD, 40 mM sodium cacodylate, 12 mM spermine tetra-HCl and 80 mM KCl, 20 mM BaCl2 (pH 7.0). The second was crystallized from 10% MPD, 40 mM sodium cacodylate, 12 mM spermine tetra-HCl, 40 mM LiCl and 80 mM SrCl2 (pH 7.0). Crystals were mounted in nylon loops and frozen in liquid nitrogen. Diffraction data were collected in a cold nitrogen stream on beamline 21-ID-F at LS-CAT, APS (Argonne National Laboratory, Argonne, IL) for both crystals. Single-wavelength anomalous dispersion (SAD) data were collected on the 21-ID-D beamline for the first crystal at the energy corresponding to absorption peak for the Ba atom. All data were processed with the program HKL2000 (28) and XDS (29).
Crystal structure determination and refinement of the DDD-XY duplex
The PHENIX (30) software was used to calculate phases and initial placing of the model into the electron density map from the SAD data for the first crystal, which was crystallized with BaCl2. Then, initial refinement of the model was performed with the Computer and Network Systems (CNS) (31) program (National Science Foundation), setting aside 5% randomly selected reflections for calculating the Rfree. Rigid body refinement and simulated annealing were performed. After several cycles of refinement, the emergent model was used as the starting model for phasing by molecular replacement methods for a data set obtained from the second crystal. Multiple rounds of coordinate refinements and simulated annealing led to an improved model for which sum (2Fo-Fc) and difference (Fo-Fc) Fourier electron density maps were generated. At a later stage solvent, water molecules were added on the basis of Fourier 2Fo-Fc sum and Fo-Fc difference electron density maps. Water molecules were accepted based on the standard distances and B-factor criteria. Further, structure refinement was performed using the program REFMAC in the Collaborative Computational Project Number 4 software suite (CCP4) (32). Geometry and topology files were generated for the O6-Bn-dG and dPer modified bases, and anisotropic temperature factor refinement was performed afterward. The programs TURBO-FRODO (33) and COOT (34) were used to display electron density maps. Helicoidal analysis was performed using the CURVES+ web server (35).
Nuclear magnetic resonance
The DDD-XY and DDD-GY modified duplexes were prepared at concentrations of 0.56 mM and 0.53 mM, respectively. The samples were prepared in 10 mM NaH2PO4, 0.1 M NaCl and 50 µM Na2EDTA (pH 7.0). To observe non-exchangeable protons, the samples were exchanged with D2O. The DDD-GY duplex was dissolved in D2O. The DDD-XY duplex was dissolved in 9:1 D2O:CD3CN. For the observation of exchangeable protons, the samples were dissolved in 9:1 H2O:D2O. 1H NMR spectra for DDD-XY duplex were recorded at 900 MHz at 10°C and 500 MHz at 7°C. 1H nuclear magnetic resonance (NMR) spectra for DDD-GY duplex were recorded at 800 MHz in D2O at 10°C and 600 MHz in 9:1 H2O:D2O at 5°C. Chemical shifts were referenced to water. Data were processed using TOPSPIN software (Bruker Biospin Inc., Billerica, MA). The nuclear Overhauser effect spectroscopy (NOESY) (36,37) and double quantum filtered correlation spectroscopy (DQF-COSY) (38) spectra in D2O were collected at 10°C; NOESY experiments were conducted at mixing times of 150, 200 and 250 ms with a relaxation delay of 2.0 s. The NOESY spectra of the modified samples in H2O were collected with a 250 ms mixing time, with a relaxation delay of 1.5 s. Water suppression was performed using the WATERGATE pulse sequence (39).
NMR experimental restraints
The NOESY spectra were processed using the TOPSPIN software (Bruker Biospin Inc., Billerica, MA), and the spectral data were evaluated using the program SPARKY (40) to obtain the cross-peak assignments. The intensities of cross-peaks were measured by volume integrations. Experimental intensities were combined with intensities obtained from complete relaxation matrix analysis (CORMA) of starting model to generate a hybrid intensity matrix (41,42). The intensities were converted to distances with the program MARDIGRAS, which refined the hybrid intensity matrix (43). Calculations were performed using 150, 200 and 250 ms mixing time data and 2, 3 and 4 ns isotropic correlation times. Evaluation of the resulting distance data allowed creation of upper and lower bound distance restraints that were used in restrained molecular dynamics (rMD) calculations. Additional empirical base pair, backbone and deoxyribose pseudorotation restraints for base pairs not proximal to the sites of modification were obtained from canonical values derived from B-DNA (44).
rMD calculations
An unmodified B type DNA model was used as a starting structure. The cytosine at position C9 in each strand was replaced by dPer with INSIGHT II (Accelrys Inc., San Diego, CA). Partial charges for Per were calculated with the B3LYP/6-31 G* basis set in GAUSSIAN (45). The starting structure was energy minimized for 1000 cycles. A simulated annealing protocol (46) was used for the rMD calculations, which were conducted with the parm99 force field, using the program AMBER (47). Force constants of 32 kcal mol−1 Å−2 were applied for distance restraints. The generalized Born model (48) was used for solvation. The salt concentration in all calculations was 0.1 M. Coupling of the molecule to the bath temperature was used to control the temperature during simulated annealing. First, calculations were performed for 20 ps (20 000 steps) by the following protocol: During steps 0–1000, the system was heated from 0 to 600 K with a coupling of 0.5 ps. During steps 1001–2000, the system was kept at 600 K. The system was then cooled from 600 to 100 K during steps 2001–18 000 with a coupling of 4 ps. Further cooling from 100 to 0 K occurred during steps 18 001–20 000 with a coupling of 1 ps. After initial cycles of refinement a longer 100 ps (100 000 steps), calculation was performed by the following protocol: During steps 0–5000, the system was heated from 0 to 600 K with a coupling of 0.5 ps. During steps 5001–10 000, the system was kept at 600 K. The system was cooled from 600 to 100 K during steps 10 001–90 000 with a coupling of 4 ps. Additional cooling from 100 to 0 K occurred during steps 90 001–100 000 with a coupling of 1 ps. Structure coordinates were saved after each cycle and were subjected to potential energy minimization. Nine refined structures calculated from the different starting structures were chosen based on the lowest deviations from the experimental distance and dihedral restraints and energy minimized to obtain an average structure. CORMA (41,42) was used to compare intensities calculated from these emergent structures with the distance restraints. Helicoidal analysis was performed using the CURVES+ web server (35).
Data deposition
The complete structure factor and final coordinates were deposited in the Protein Data Bank (www.rcsb.org): the PDB ID code for the DDD-XY duplex is 4HQI and for the DDD-GY duplex the PDB ID code is 2M11. Supplementary Table S1 contains the CIF file.
RESULTS
Thermodynamic studies
The unfolding of the DDD, DDD-XY and DDD-GY duplexes was examined by temperature-dependent UV spectroscopy. The TM values were determined by taking the first derivatives of the resulting UV melting curves. The melting temperature for the DDD was 45°C, for DDD-GY duplex was 28°C and for the DDD-XY duplex was 33°C. Notably, for the DDD-XY duplex, the presence of the dPer base complementary to O6-Bn-dG increased the TM of by 5°C as compared with the DDD-GY duplex, in agreement with prior observations that dPer thermodynamically discerns the presence of O6-Bn-dG (23).
Structure of the DDD-XY duplex
Two crystals suitable for data collection were obtained. The first was crystalized from the buffer containing 20 mM BaCl2. This crystal diffracted to 1.95 Å. The diffraction data were processed in space group P212121 (orthorhombic). The processing and refinement parameters are shown in Supplementary Table S2. It was not possible to complete the phasing utilizing molecular replacement approaches. Instead, the experimental phases were obtained from SAD data collected at the energy corresponding to absorption peak for Ba. From these data, phasing was accomplished, as was the initial placement of the model into the electron density map. Then, initial refinement of the model was performed, setting aside 5% randomly selected reflections for calculating the Rfree. Rigid body refinement and simulated annealing produced a structure that was in good agreement with the experimental electron density. A second crystal, crystallized from the buffer containing 80 mM SrCl2, diffracted at the greater resolution of 1.7 Å, also in space group P212121 (orthorhombic). The data from the second crystal were phased using molecular replacement methods in which the structure from the first crystal was used as a starting model. Multiple rounds of coordinate refinements and simulated annealing led to an improved structure for which sum (2Fo-Fc) and difference (Fo-Fc) Fourier electron density maps were generated.
A total of 49 water molecules were added on the basis of Fourier 2Fo–Fc sum and Fo–Fc difference electron density maps. These were accepted based on the standard distances and B-factor criteria. One Sr2+ ion was identified in the electron density map based on its low B-factor and the characteristic geometry, as well as one spermine. The cell parameters (a = 26.38, b = 36.77, c = 77.65, α = 90.0, β = 90.0, γ = 90.0, Supplementary Table S3) were atypical for the DDD duplex. The volume of the unit cell was greater. The overall structure of the DDD-XY duplex is shown with waters, Sr2 + , and a spermine molecule in Supplementary Figure S1. Although no electron density was observed for the 5′-terminal bases C1 and C13, and thus their positions could not be determined with certainty, the 3′-terminal bases G12 and G24 rotated out of the duplex toward the major groove of adjacent molecules. The crystal data collection and refinement statistics are compiled in Supplementary Table S3.
Figure 1 shows the DDD-XY duplex in the region of the C3:G22, X4:Y21 and A5:T20 base pairs. Both the O6-Bn-G and Per bases fit well into the electron density map. O6-Bn-dG remained in the anti conformation about the glycosyl bond. In contrast, the dPer nucleoside adopted the syn conformation. The intercalation of the Per base created a binding pocket into which the benzyl ring of the O6-Bn-dG base was inserted. The benzyl ring of the O6-Bn-G base also formed a stacking interaction with T20 of the 5′-neighbor A5:T20 base pair. The simultaneous insertion of both dPer and the benzyl ring of the O6-Bn-dG base increased the helical rise between neighboring base pairs C3:G22 and A5:T20 to 9.5 Å, as compared with the anticipated rise of ∼6.8 Å in B-DNA (Supplementary Figure S2). It also unwound the duplex. For the modified duplex, the twist at base pairs C3:G22 and X4:Y21 was −15°, whereas for the unmodified duplex it was 25°, a change of 40° (Supplementary Figure S2). For the dPer phosphodiester backbone angles α and γ changes of ∼210° were observed compared with the unmodified duplex (Supplementary Figures S3 and S4). The χ angle for dPer was in the range of 60–80°, which was consistent with the syn conformation (Supplementary Figure S5). The intercalation of the Per base, which was located between O6-Bn-G and the 5′ neighbor cytosine in both strands, increased the ξ angles of C3 and C15 by 90° (Supplementary Figure S5). Watson–Crick base pairing at the neighbor base pairs C3:G22 and A5:T20 was not disturbed. Figure 2 illustrates the stacking between the benzyl ring of O6-Bn-dG and dPer.
Figure 1.

The DDD-XY duplex in the region of the C3:G22, X4:Y21 and A5:T20 base pairs, showing the electron density map. The dPer nucleotide recognizes the benzyl group of O6-Bn-dG (X4) via a stacking interaction such that the benzyl ring intercalates between the T20 and Y21 bases.
Figure 2.
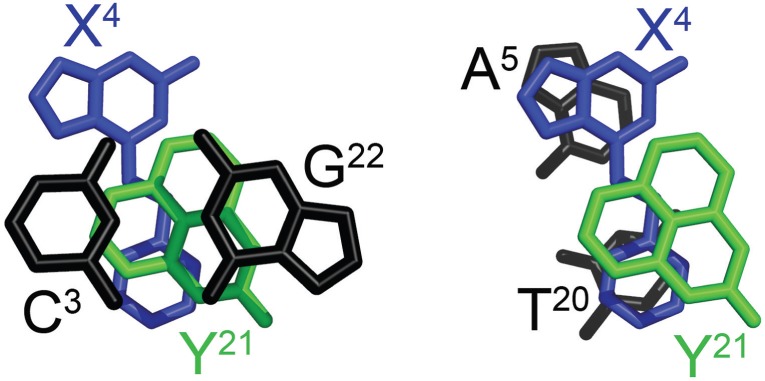
Stacking interactions for the O6-Bn-dG:dPer (DDD-XY) duplex. (Left panel) Stacking of the C3:G22 base pair (black) above X4 (blue) and Y21 (green). (Right panel) Stacking of the X4:Y21 pair (in blue and green, respectively) above base pair A5:T20 (black). The benzyl ring of O6-Bn-dG (X4) is stabilized by intercalation between T20 and Y21 (dPer) bases.
NMR spectroscopy of the DDD-XY duplex
To ascertain whether the crystallographic structure for the DDD-XY duplex was representative of the solution structure, a series NMR spectroscopy experiments were conducted. These proved to be challenging, as the resonances associated with the O6-Bn-dG:dPer pairing interaction exhibited severe line broadening. The source of the line broadening was not identified but may be attributed to rotation of the benzyl ring of O6-Bn-dG at a rate intermediate on the NMR time scale. However, it was observed that the addition of 10% CD3CN to the solvent as an organic modifier resulted in significant line narrowing to the resonances associated with the O6-Bn-dG:dPer interaction. The addition of the organic modifier did not otherwise affect the NMR spectrum of the duplex, and the duplex structure of the DNA was maintained (‘vide infra’). The O6-Bn-dG benzyl protons were observed as three signals between 6.6 and 7.4 ppm (Figure 3). All gave cross-peaks with the X4 methylene protons Hm1, Hm2 (1 c, 2 c, 4 c, 5 c, 6 c, Figure 3c). This indicated that in the presence of the organic modifier, rotation of the benzyl ring was rapid on the NMR time scale. The resonance located farthest downfield at 7.3 ppm was assigned as X4 Hmeta, whereas the resonance located farthest upfield at 6.7 ppm was assigned as X4 Hortho. The X4 Hpara proton was assigned at 7 ppm. Cross-peaks were observed between Hortho→Hmeta (1d, Figure 3d), Hmeta→Hpara (2d, Figure 3d), Hortho→Hpara (3d, Figure 3d). Interstrand cross-peaks between the X4 benzyl ring and T8 CH3, H2′, H2′′ were observed (1a, 2a, 1b, 2b, 3b, 4b, Figure 3a and b). A weak cross-peak between Y9 H9 and X4 Hortho was observed (7d, Figure 3d). The dPer (Y9) resonances were observed upfield from the benzyl ring protons of O6-Bn-dG (X4). Cross-peaks between dPer hydrogens are shown in Figure 3d (4d-6d, 8d-14d). Additional cross-peaks between the dPer base and its deoxyribose were identified (5b-8b, 8c-11c, Figure 3b and c). One weak interstrand cross-peak was identified between C3 H2′ and Y9 H6 (7b, Figure 3b).
Figure 3.

The NOESY spectrum for the DDD-XY duplex, showing the assignments of the O6-Bn-dG and dPer protons. The cross-peaks in (a) are assigned as follows: 1a, T8 CH3→X4 Hmeta; 2a T8 CH3→X4 Hortho. The cross-peaks in (b) are assigned as follows:1b, T8 H2′→X4 Hmeta; 2b, T8 H2′′→X4 Hmeta; 3b, T8 H2′→X4 Hortho; 4b, T8 H2''→X4 Hortho; 5b, Y9 H2′/H2''→Y9 H8; 6b, Y9 H2′/H2′′→Y9 H9; 7b, C3 H2′→Y9 H6; 8b, Y9 H2′/H2′′→Y9 H1′. The cross-peaks in (c) are assigned as follows: 1c, X4 Hm1→X4 Hmeta; 2c, X4 Hm2→X4 Hmeta; 3c, Y9 H4′→X4 Hmeta; 4c, X4 Hm2→X4 Hpara; 5c, X4 Hm1→X4 Hortho; 6c, X4 Hm2→X4 Hortho; 7c, Y9 H4′→X4 Hortho; 8c, Y9 H4′ →Y9 H8; 9c, Y9 H3′→Y9 H9; 10c, Y9 H4′→Y9 H1′; 11c, Y9 H3′→Y9 H1′. The cross-peaks in (d) are assigned as follows: 1d, X4 Hortho→X4 Hmeta; 2d, X4 Hpara→X4 Hmeta; 3d, X4 Hortho→X4 Hpara; 4d, Y9 H1′→Y9 H8; 5d, Y9 H6→Y9 H8; 6d, Y9 H7→Y9 H8; 7d, Y9 H9→X4 Hortho; 8d, Y9 H9→Y9 H8; 9d, Y9 H4→Y9 H5; 10d, Y9 H6→Y9 H5; 11d, Y9 H7→Y9 H5; 12d, Y9 H1′→Y9 H9; 13d, Y9 H7→Y9 H9. The spectrum was collected at 10°C at 900 MHz, using a 250 ms mixing time.
In the sequential NOE connectivity between base aromatic and deoxyribose H1′ protons (49,50), a number of the anticipated NOEs were weak (Supplementary Figure S6). These included the C3 H6→C3 H1′, the C3 H1′→X4 H8, the X4 H8→X4 H1′ and the X4 H1′→A5 H8. Also, the T7 H1′→T8 H6, T8 H6→T8 H1′, T8 H1′→Y9 H8, Y9 H8→Y9 H1′ and Y9 H1′→G10 H8 NOEs were weak. The magnitude of the Y9 H8→Y9 H1′ NOE was consistent with the syn conformation of the dPer nucleotide about the glycosyl bond. In the imino and amino proton regions of the spectrum, the Y9 imino proton could not be identified (Supplementary Figure S7). This was attributed to rapid exchange with solvent. Thus, in the sequential connectivity of the base imino protons (51), no T8 N3H→Y9 imino or Y9 imino→G10 N1H NOE was observed. The A5 H2→T8 N3H NOE was weak as compared with the A6 H2→T7 N3H NOE.
Structure of the DDD-GY duplex
To determine the basis by which dPer differentially recognized the O6-Bn-dG adduct versus dG, the structure of dPer placed opposite dG (DDD-GY) was determined. This duplex was not amenable to crystallographic analysis. However, it was possible to complete a structural determination by NMR. Assignments between aromatic protons of the base to deoxyribose H1′ protons are shown in Figure 4. At the G4:Y9 base pair, the C3 H6→C3 H1′, C3 H1′→G4 H8, G4 H8→G4 H1′, G4 H1′→A5 H8 and A5 H8→A5 H1′ cross-peaks were observed and were of normal intensities. Also, the T8 H6→T8 H1′, T8 H1′→Y9 H9, Y9 H9→Y9 H1′, Y9 H1′→G10 H8 and G10 H8→G10 H1′ NOEs were observed and were of normal intensities. There was a small chemical shift difference compared with unmodified duplex for the T8 and Y9 bases.
Figure 4.

The NOESY spectrum of the DDD-GY duplex, showing sequential NOEs between the aromatic and anomeric protons from C1 to G12. The spectrum was collected at 10°C at 800 MHz, using a 250 ms mixing time.
The sequential NOEs between the base imino protons showed a strong cross-peak between the G4 N1H imino proton and the Y9 dPer imino proton (u, Figure 5b). The sequential connectivity of the base imino protons was thus obtained from base pairs G2:C11→C3:G10→G4:Y9→A5:T8→A6:T7 (Figure 5b). The region of the spectrum showing NOEs between the base imino and amino protons and adenine H2 protons showed cross-peaks for base pairs A5:T8, A6:T7, G2:C11, G10:C3, and it showed that G4 and Y9 formed a base pair (k, l, m, n, Figure 5a). The G10 cross-peak had a similar chemical shift as compared with G2. The G4 N1H and Y9 HN resonances were shifted upfield to 10.2 and 10.7 ppm.
Figure 5.

The NOESY spectrum for the DDD-GY duplex. (a) Interstrand NOEs between complementary bases. The cross-peaks are assigned as a, A5 H2→T8 N3H; b, A6 H2→T8 N3H; c, A6 H1′→T7 N3H; d, A6 N6H2→T7 N3H; e, A5 H2→T7 N3H; f, A6 H2→T7 N3H; g, C3 N2H1→G10 N1H; h, C3 N2H2→G10 N1H; i, C11 N2H1→G2 N1H; j, C11 N2H2→G2 N1H; k, G4 H1′→Y9 HN; l, Y9 H1′→Y9 HN; m, G4 H1′→G4 N1H; n, Y9 H1′→G4 N1H. (b) NOE connectivity for the imino protons for the base pairs G2:C11, C3:G10, G4:Y9, A5:T8, A5:T7. The cross-peaks are assigned as T8 N3H→T7 N3H, T8 N3H→Y9 HN (p), T8 N3H→G4 N1H (o), Y9 HN→G10 N1H (s), G4 N1H→G10 N1H (r), G2 N1H→G10 N1H and Y9 HN→G4 N1H (u). Cross-peak (t) could not be assigned. The same cross-peak was observed for the DDD-XY duplex (peak k, Supplementary Figure S7). A NOESY experiment at a shorter mixing time of 70 ms showed no change in intensity and suggested that this may be an exchange cross-peak of unknown origin. The experiment was carried out at 5°C and with a mixing time of 250 ms at 600 MHz.
In the NMR spectrum for the DDD-GY duplex (Figure 6), two additional resonances were observed at 10.3 and 10.7 ppm, which were assigned to the G4 and Y9 bases. These were broad as compared with the other imino resonances. The chemical shift for the G10 N1H imino proton was similar to that of the G2 N1H imino proton; these two resonances remained sharp even at higher temperatures. The thymine T8 N3H imino resonance remained sharp at higher temperatures as compared with the T8 N3H imino resonance in the DDD-XY duplex (Supplementary Figure S8).
Figure 6.

The 1D NMR spectra showing the imino proton resonances for the DDD-GY duplex as a function of temperature. The individual nucleotides are identified as superscripts. Spectra were collected at 600 MHz.
The assignment of the dPer aromatic protons H4, H5, H6, H7, H8 and H9 is shown in Figure 7. These were observed between 6.2 and 7.4 ppm. The cross-peak between T8 H1′→Y9 H9 was identified (10 d, Figure 7d). Based on the intensities of cross-peaks, H8 and H7 were identified. They both showed cross-peaks to H9 (1d, 3d, Figure 7d). The H6 cross-peak was identified based on its proximity to H8 and H7 and H5 (2d, 4d, 6d, Figure 7d). The H5 proton showed a cross-peak to H4 (7d, Figure 7d). This peak was broad and shifted upfield to 6.2 ppm. H9 and H8 showed cross-peaks to T8 H2′ (1a, 4a, Figure 7a). H6 and H5 showed cross-peaks to the T8 CH3 group (2a, 3a, Figure 7a). Additional cross-peaks between H9, H8, H7 and its deoxyribose and to T8 deoxyribose protons were assigned (Figure 7c).
Figure 7.

The NOESY spectrum showing dPer resonance assignments for the DDD-GY duplex. The cross-peaks in (a) are assigned as follows: 1a, T8 H2′→Y9 H8; 2a, T8 Me→Y9 H6; 3a, T8 Me→Y9 H5; 4a, T8 H2′→Y9 H9. The cross-peaks in (b) are assigned as follows: 1b, T8 H2′′→Y9 H8; 2b Y9 H2′′→Y9 H8; 3b, T8 H2′′→Y9 H7; 4b, Y9 H2′′→Y9 H7; 5b, Y9 H2′→Y9 H9; 6b, T8 H2′′→Y9 H9; 7b, Y9 H2′′→Y9 H9. The cross-peaks in (c) are assigned as follows: 1c, T8 H3′→Y9 H8; 2c, Y9 H3′→Y9 H8; 3c, Y9 H5′′→Y9 H9; 4c, T8 H5′′→Y9 H9; 5c, Y9 H5′→Y9 H9; 6c, Y9 H4′→Y9 H9; 7c, T8 H3′→Y9 H9; 8c, Y9 H3′→Y9 H9. The cross-peaks in (d) are assigned as follows: 1d, Y9 H9→Y9 H8; 3d, Y9 H9→Y9 H7; 2d, Y9 H6→Y9 H8; 4d, Y9 H6→Y9 H7; 6d, Y9 H5→Y9 H6; 5d, Y9 H4→Y9 H6; 7d, Y9 H4→Y9 H5; 10d, T8 H6→Y9 H9; 9d, Y9 H1′→Y9 H9; 8d, T8 H1′→Y9 H9. The spectrum was collected at 10°C, with 250 ms mixing time, at 800 MHz.
The structure of the dG:dPer (DDD-GY) duplex was determined using a simulated annealing rMD protocol, restrained by experimental distance restraints determined from NOEs. Supplementary Table S4 shows the restraints used for rMD calculations. Nine structures were energy minimized and superimposed to obtain the average structure (Supplementary Figure S9). Supplementary Figure S10 shows these superimposed structures and the average structure. The latter was in good agreement with the experimental restraints confirmed by CORMA (52) analysis. Supplementary Table S5 shows the structural statistics. Figure 8 shows the DDD-GY duplex in the region of the C3:G10, G4:Y9 and A5:T8 base pairs. The dPer Y9 base formed a wobble base pair with the complementary guanine G4, involving two hydrogen bonds (Figure 9), which was supported by a strong cross-peak between imino protons of G4 and Y9 of opposite strands (cross-peak u, Figure 5b). The dPer ring was oriented in the major groove and adopted the anti conformation about the glycosyl bond. It did not disrupt neighbor base pairs. The dPer base stacked with its 5′ neighbor T8, but it did not stack well with its 3′ neighbor G10 (Figure 10). The complementary guanine, G4 stacked well with its 3′ neighbor A5, but not with C3. Helicoidal analysis (Supplementary Figures S11, S12, S13 and S14) revealed that the ζ angle of the dPer nucleotide increased by ∼50° compared with the unmodified duplex, which corroborated the reduced stacking between dPer (Y9) and the 3′ neighbor guanine (G10) (Supplementary Figure S14).
Figure 8.
The average structure of the DDD-GY duplex, in the region of the C3:G10, G4:Y9 and A5:T8 base pairs. Base Y9 is shown in green. The dPer ring is oriented in the major groove. It does not disrupt the neighbor base pairs. Hydrogens are omitted for clarity.
Figure 9.
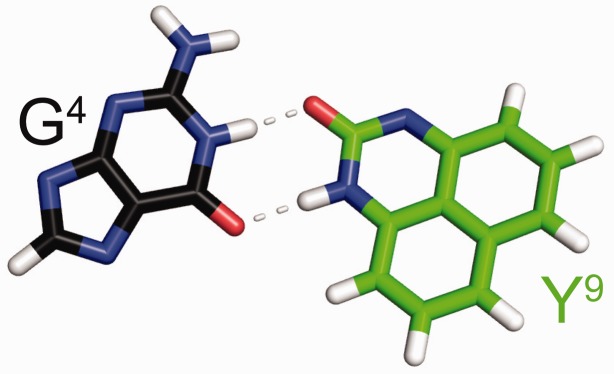
The average structure of the G4:Y9 base pair, in the DDD-GY duplex. G4 forms a wobble pair with the complementary dPer (Y9) base. The anticipated hydrogen bonds are indicated as gray dashed lines.
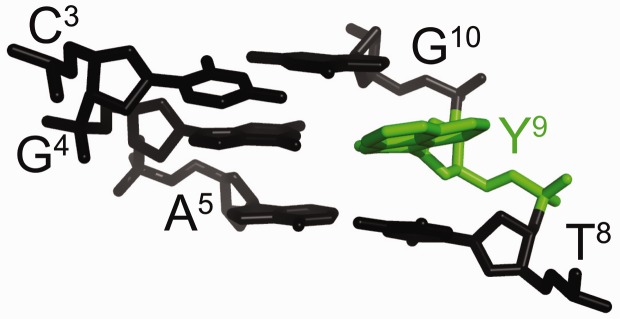
Figure 10.
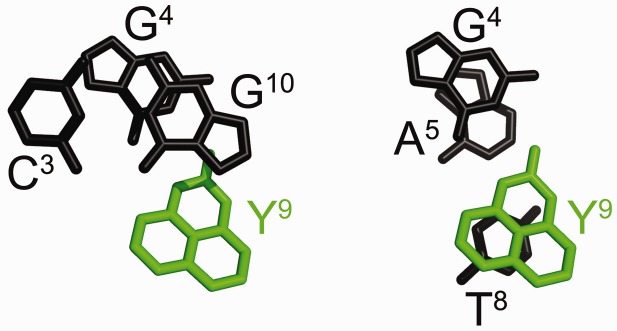
Stacking interactions for the DDD-GY duplex. (a) Stacking of the C3:G10 base pair (black) above the G4:Y9 base pair (green). (b) Stacking of G4 and Y9 (black and green, respectively) above the A5:T8 base pair (black). The dPer ring is in the major groove. The dPer (Y9) base stacks with T8.
DISCUSSION
The dPer synthetic nucleoside (Chart 1) recognizes O6-Bn-dG, as indicated by thermodynamic stabilization of the O6-Bn-dG:dPer interaction (23). The present studies, in the DDD sequence context, reveal a 5°C increase in the TM of the DDD-XY as compared with the DDD-GY duplex, which corroborates the previous results. It was originally hypothesized that the ability of dPer to recognize O6-Bn-dG was due to stacking and hydrophobic interactions with the benzyl ring of the DNA adduct, combined with potential hydrogen bonding between the anti conformation of dPer about the glycosyl bond and the N1 and N2 nitrogen atoms of the alkylated deoxyguanosine (23). The present data provide experimental evidence for a different mode of recognition.
dPer recognizes O6-Bn-dG via a stacking interaction
The data suggest that in this DNA sequence the presence of dPer ‘traps’ the benzyl ring of O6-Bn-dG between the dPer nucleotide and T20, providing a mechanism whereby dPer recognizes the O6-Bn-dG DNA damage (Figures 1 and 2). Crystallographic electron density maps show the insertion of the dPer base into the DNA provides a binding pocket for the benzyl group of O6-Bn-dG to intercalate between Per and thymine of the 3′-neighbor A:T base pair. The simultaneous insertion of Per and the benzyl group of O6-Bn-dG unwinds the duplex at the recognition site (Figure 1 and Supplementary Figure S1), as suggested by the weak sequential NOE connectivity cross-peak observed between C3 H1′ and X4 H8. Additionally, the weak cross-peak T8 H1′→Y9 H8 is consistent with an increased distance between these bases. The chemical shifts of the dPer base resonances, observed in the 5.5–6.4 ppm range (Figure 3), are consistent with the insertion of dPer into the duplex and π–π stacking with the benzyl group of O6-Bn-dG. Furthermore, the absence of the dPer imino resonance in NMR spectra indicates that the Y9 imino proton is in enhanced exchange with the solvent, consistent with a lack of base pairing (Supplementary Figure S7).
The orientation of the dPer base about the glycosyl bond in this DNA sequence was of interest. The syn-glycosyl conformation of the dPer nucleoside was observed when it was not incorporated into DNA (23). On the other hand, Gong and Sturla (23) had suggested hydrogen bonding between the N1 and N2 nitrogen atoms of the alkylated deoxyguanosine and dPer, requiring the anti conformation of dPer about the glycosyl bond. In the crystallographic data obtained at a resolution of 1.7 Å, when inserted into the electron density map in the syn conformation, the resulting crystallographic R factor was minimized. If dPer was instead inserted into the electron density map in the anti conformation, it did not fit well, and residual difference (Fo-Fc) Fourier electron density was observed. The NMR data also show a weak NOE between the dPer base H9 proton and the deoxyribose H1′ proton, consistent with dPer adopting the syn glycosyl torsion angle (Supplementary Figure S6). Overall, we conclude that in this DNA sequence, the insertion of dPer into the duplex is stabilized by a combination of base stacking and steric factors. Gong and Sturla (23) have observed similar thermodynamic profiles in other sequences, which suggests that the mechanisms of recognition could be similar. On the other hand, the possibility that the combination of stacking and steric factors observed in the present structures could be modulated by DNA sequence must be considered. For example, one might predict a more stable stacking interaction involving O6-Bn-dG if the present 3′-neighbor base A:T base pair were to be exchanged for a 3′-neighbor C:G base pair (Figures 1 and 2). It would thus be of interest to complete a structural analysis(es) of the recognition of O6-Bn-dG by dPer in other sequences.
It seems that the simultaneous insertion of the Per base and the O6-Bn-dG lesion explains the greater volume of the crystallographic unit cell (Supplementary Table S2) as compared with the canonical DDD, and that changes in the crystal packing of the O6-Bn-dG:dPer duplex explain why attempts to phase crystallographic data by the molecular replacement method failed. The electron density for the two 5′-terminal nucleotides C1 and C13 is not visible, suggesting that these bases are disordered in the crystal. The terminal bases may be unable to fit into the lattice owing to the intercalated structure of the modified duplex.
The observation that dPer recognizes O6-Bn-dG via a stacking interaction rather than via hydrogen bonding interactions is consistent with the notion that base stacking interactions are of importance in stabilizing nucleic acid duplexes and contribute to the sequence dependence of DNA duplex stability in unmodified DNA (53–57). Inter-strand stacking interactions have been found to underlie the stability of some chemically modified DNA duplexes. For example, Gallego and Loakes (58) reported on the solution structure and dynamics of oligodeoxynucleotide duplexes containing the universal base analogs 5-nitroindole and 5-nitroindole-3-carboxamide, concluding that these base analogs exist as a mixture of two different stacking configurations. Matsuda et al. (59) reported that for the 2′-deoxynucleotide containing the propynylisocarbostyril base analog (dPICS), the large aromatic rings of propynylisocarbostyril (dPICS) pair in an intercalative manner within an oligodeoxynucleotide duplex. Likewise, Malyshev et al. (60) determined the structure of an oligodeoxynucleotide duplex containing the unnatural dMMO2-d5SICS pair and concluded that this unnatural base pair adopted a well-defined structure, with only small helical distortions. Their structure revealed that the unnatural dMMO2-d5SICS paired via partial interstrand intercalation. The intercalation of nucleoside analogs may influence behavior in polymerase-mediated DNA synthesis reactions (59,60). Biphenyl groups placed as a pair in a DNA duplex intercalate side by side as a pair between the natural base pairs and also undergo dynamic motion (61). As well, oligonucleotides composed of achiral non-nucleosidic building blocks, such as pyrene and phenanthrene, embedded in DNA lead to duplex stabilization on the basis of inter-strand stacking interactions (62–64).
The NMR analysis leads to the conclusion that the intercalative recognition mechanism for the O6-Bn-dG:dPer pair applies in solution and provides information regarding solution dynamics of the interaction. The observation that the benzyl protons of the O6-Bn-dG appear as three resonances (Figure 3) is consistent with rotation of the benzyl ring in solution on the timescale of the NMR experiment. It is possible that the ring flipping is associated with DNA breathing motions, i.e. occurs when the DNA duplex is transiently open. This dynamic behavior probably accounts for the line broadening at base pairs C3:G10 and X4:Y9 in the NMR spectrum (Figures 3 and Supplementary Figure S6). The flipping benzyl ring between Per and T8 is consistent with line broadening observed both for T8 and dPer protons. Similar flipping of the styrenyl moiety has been observed in the NMR spectrum for the S(61,2)-R-(N6-adenyl)styrene oxide adduct, when placed in DNA (65). DNA containing the O6-Bn-G:C pairing is destabilized relative to an unmodified G:C base pair (23); however, attempts to characterize the structure of the O6-Bn-G lesion in DNA were unsuccessful, as the NMR spectra showed spectral broadening, which suggested that the lesion induced conformational disorder into the duplex. However, a structural analysis of an O6-Bn-dG modified template:primer complexed with the Y-family polymerase Dpo4 revealed that O6-Bn-dG formed a wobble base pair when placed opposite dC and pseudo Watson–Crick hydrogen bonding when placed opposite dT (66).
dPer pairs with guanine via a wobble base pairing interaction
The present results reveal formation of a wobble pair between dPer and dG, with dPer oriented in the anti conformation with respect to the glycosyl bond, with hydrogen bonds involving dPer and the N1 and N2 nitrogen atoms of the guanine (Figure 9). The presence of these hydrogen bonds is consistent with the NMR data, which shows that the sequential connectivity of the base imino protons from base pairs C3:G10→G4:Y9→A5:T8 is observed (Figure 5b). Moreover, the region of the spectrum showing NOEs between the base imino and amino protons (Figure 5) is consistent with the notion that G4 and Y9 form a wobble-like base pair, as there was no break in the NOE connectivity between bases, and the T8→Y9 and Y9→G10 cross-peaks were weak. Notably, the chemical shifts for the dPer protons are observed 6.6–7.4 ppm, i.e. further downfield than for the DDD-XY duplex, suggesting reduced stacking interactions (Figure 7). These downfield shifts are consistent with the positioning of the dPer ring into the major groove, as seen in Figures 8 and 10. The observation that the TM for the DDD-GY duplex is 5°C lower than that for the DDD-XY duplex suggests that the stability imparted by this wobble interaction is lower than that from the dPer:O6-Bn-dG intercalative interaction, perhaps also due to poorer stacking interactions between dPer and the flanking bases (Figure 10), thus providing a basis for specificity. The presence of the wobble-pair interaction, however, perhaps limits the selectivity of dPer for O6-Bn-dG over dG.
SUMMARY
The synthetic nucleoside dPer distinguishes between O6-Bn-dG and dG in this DNA sequence by an intercalative binding mode. It enables the benzyl group of O6-Bn-dG to intercalate between dPer and thymine of the 3′-neighbor A:T base pair. The binding of the benzyl group is captured in the face-to-face stack in the crystal structure but is dynamic on the NMR timescale. In contrast, dPer forms a less stable pair with dG, which is characterized by a wobble-type H-bonding interaction. The structural insight gained in this study provides information that may be applied to chemical modifications that could further stabilize dPer:O6-Bn-dG stacking interactions and/or destabilize the dPer:O6-Bn-dG wobble interaction.
ACCESSION NUMBERS
PDB ID code for the DDD-XY duplex is 4HQI, and for the DDD-GY duplex, the PDB ID code is 2M11.
SUPPLEMENTARY DATA
Supplementary Data are available at NAR Online: Supplementary Tables 1–5, Supplementary Figures 1–6, Supplementary References [30–31,45,59].
FUNDING
NIH [R01 CA-108604 to S.J.S.], [R01 GM-055237 to M.E.], [R01 ES-05509 to M.P.S.]; ERC grant [260341 to S.J.S.]. Funding for NMR was supplied by NIH grants [S10 RR-05805, S10 RR-025677 and NSF Grant DBI 0922862], the latter funded by the American Recovery and Reinvestment Act of 2009 (Public Law 111-5). Vanderbilt University assisted with the purchase of in-house crystallographic and NMR instrumentation. Use of the Advanced Photon Source was supported by the U.S. Department of Energy, Office of Science, Office of Basic Energy Sciences, under Contract No. DE-AC02-06CH11357. The LS-CAT Sector 21 beamline is supported by the Michigan Economic Development Corporation and the Michigan Technology Tri-Corridor [085P1000817]. Funding for open access charge: National Institutes of Health and ERC.
Conflict of interest statement. None declared.
Supplementary Material
REFERENCES
- 1.Pegg AE, Dolan ME, Moschel RC. Structure, function, and inhibition of O6-alkylguanine-DNA alkyltransferase. Prog. Nucleic Acid Res. Mol. Biol. 1995;51:167–223. doi: 10.1016/s0079-6603(08)60879-x. [DOI] [PubMed] [Google Scholar]
- 2.Margison GP, Santibanez Koref MF, Povey AC. Mechanisms of carcinogenicity/chemotherapy by O6-methylguanine. Mutagenesis. 2002;17:483–487. doi: 10.1093/mutage/17.6.483. [DOI] [PubMed] [Google Scholar]
- 3.Wyatt MD, Pittman DL. Methylating agents and DNA repair responses: Methylated bases and sources of strand breaks. Chem. Res. Toxicol. 2006;19:1580–1594. doi: 10.1021/tx060164e. [DOI] [PMC free article] [PubMed] [Google Scholar]
- 4.Moschel RC, Hudgeins A, Dipple AJ. Aralkylation of guanosine by carcinogen N-nitroso-N-benzylurea. J. Org. Chem. 1980;45:533–535. [Google Scholar]
- 5.Peterson LA. N-Nitrosobenzylmethylamine is activated to a DNA benzylating agent in rats. Chem. Res. Toxicol. 1997;10:19–26. doi: 10.1021/tx9601014. [DOI] [PubMed] [Google Scholar]
- 6.Mitra G, Pauly GT, Kumar R, Pei GK, Hughes SH, Moschel RC, Barbacid M. Molecular analysis of O6-substituted guanine-induced mutagenesis of ras oncogenes. Proc. Natl Acad. Sci. USA. 1989;86:8650–8654. doi: 10.1073/pnas.86.22.8650. [DOI] [PMC free article] [PubMed] [Google Scholar]
- 7.Bishop RE, Pauly GT, Moschel RC. O6-ethylguanine and O6-benzylguanine incorporated site-specifically in codon 12 of the rat H-ras gene induce semi-targeted as well as targeted mutations in Rat4 cells. Carcinogenesis. 1996;17:849–856. doi: 10.1093/carcin/17.4.849. [DOI] [PubMed] [Google Scholar]
- 8.Pauly GT, Moschel RC. Mutagenesis by O6-methyl-, O6-ethyl-, and O6-benzylguanine and O4-methylthymine in human cells: Effects of O6-alkylguanine-DNA alkyltransferase and mismatch repair. Chem. Res. Toxicol. 2001;14:894–900. doi: 10.1021/tx010032f. [DOI] [PubMed] [Google Scholar]
- 9.Ide H, Akamatsu K, Kimura Y, Michiue K, Makino K, Asaeda A, Takamori Y, Kubo K. Synthesis and damage specificity of a novel probe for the detection of abasic sites in DNA. Biochemistry. 1993;32:8276–8283. doi: 10.1021/bi00083a031. [DOI] [PubMed] [Google Scholar]
- 10.Boturyn D, Constant JF, Defrancq E, Lhomme J, Barbin A, Wild CP. A simple and sensitive method for in vitro quantitation of abasic sites in DNA. Chem. Res. Toxicol. 1999;12:476–482. doi: 10.1021/tx980275g. [DOI] [PubMed] [Google Scholar]
- 11.Matray TJ, Kool ET. A specific partner for abasic damage in DNA. Nature. 1999;399:704–708. doi: 10.1038/21453. [DOI] [PubMed] [Google Scholar]
- 12.Sun L, Zhang K, Zhou L, Hohler P, Kool ET, Yuan F, Wang Z, Taylor JS. Yeast pol eta holds a cis-syn thymine dimer loosely in the active site during elongation opposite the 3′-T of the dimer, but tightly opposite the 5′-T. Biochemistry. 2003;42:9431–9437. doi: 10.1021/bi0345687. [DOI] [PubMed] [Google Scholar]
- 13.Sato K, Greenberg MM. Selective detection of 2-deoxyribonolactone in DNA. J. Am. Chem. Soc. 2005;127:2806–2807. doi: 10.1021/ja0426185. [DOI] [PubMed] [Google Scholar]
- 14.Greco NJ, Tor Y. Simple fluorescent pyrimidine analogues detect the presence of DNA abasic sites. J. Am. Chem. Soc. 2005;127:10784–10785. doi: 10.1021/ja052000a. [DOI] [PubMed] [Google Scholar]
- 15.Dhar S, Kodama T, Greenberg MM. Selective detection and quantification of oxidized abasic lesions in DNA. J. Am. Chem. Soc. 2007;129:8702–8703. doi: 10.1021/ja073014e. [DOI] [PMC free article] [PubMed] [Google Scholar]
- 16.Ono S, Li Z, Koga Y, Tsujimoto A, Nakagawa O, Sasaki S. Development of a specific fluorescent probe for 8-oxoguanosine. Nucleic Acids Symp. Ser. 2007:315–316. doi: 10.1093/nass/nrm158. [DOI] [PubMed] [Google Scholar]
- 17.Nakagawa O, Ono S, Li Z, Tsujimoto A, Sasaki S. Specific fluorescent probe for 8-oxoguanosine. Angew. Chem. Int. Ed. Engl. 2007;46:4500–4503. doi: 10.1002/anie.200700671. [DOI] [PubMed] [Google Scholar]
- 18.Greco NJ, Sinkeldam RW, Tor Y. An emissive C analog distinguishes between G, 8-oxoG, and T. Org. Lett. 2009;11:1115–1118. doi: 10.1021/ol802656n. [DOI] [PMC free article] [PubMed] [Google Scholar]
- 19.Dahlmann HA, Vaidyanathan VG, Sturla SJ. Investigating the biochemical impact of DNA damage with structure-based probes: abasic sites, photodimers, alkylation adducts, and oxidative lesions. Biochemistry. 2009;48:9347–9359. doi: 10.1021/bi901059k. [DOI] [PMC free article] [PubMed] [Google Scholar]
- 20.Taniguchi Y, Koga Y, Fukabori K, Kawaguchi R, Sasaki S. OFF-to-ON type fluorescent probe for the detection of 8-oxo-dG in DNA by the Adap-masked ODN probe. Bioorg. Med. Chem. Lett. 2012;22:543–546. doi: 10.1016/j.bmcl.2011.10.093. [DOI] [PubMed] [Google Scholar]
- 21.Taniguchi Y, Kawaguchi R, Sasaki S. Adenosine-1,3-diazaphenoxazine derivative for selective base pair formation with 8-oxo-2′-deoxyguanosine in DNA. J. Am. Chem. Soc. 2011;133:7272–7275. doi: 10.1021/ja200327u. [DOI] [PubMed] [Google Scholar]
- 22.Onizuka K, Nishioka T, Li Z, Jitsuzaki D, Taniguchi Y, Sasaki S. An efficient and simple method for site-selective modification of O6-methyl-2′-deoxyguanosine in DNA. Chem. Commun. 2012;48:3969–3971. doi: 10.1039/c2cc17621a. [DOI] [PubMed] [Google Scholar]
- 23.Gong J, Sturla SJ. A synthetic nucleoside probe that discerns a DNA adduct from unmodified DNA. J. Am. Chem. Soc. 2007;129:4882–4883. doi: 10.1021/ja070688g. [DOI] [PubMed] [Google Scholar]
- 24.Wing R, Drew H, Takano T, Broka C, Tanaka S, Itakura K, Dickerson RE. Crystal structure analysis of a complete turn of B-DNA. Nature. 1980;287:755–758. doi: 10.1038/287755a0. [DOI] [PubMed] [Google Scholar]
- 25.Mounetou E, Debiton E, Buchdahl C, Gardette D, Gramain JC, Maurizis JC, Veyre A, Madelmont JC. O6-(alkyl/aralkyl)guanosine and 2′-deoxyguanosine derivatives: synthesis and ability to enhance chloroethylnitrosourea antitumor action. J. Med. Chem. 1997;40:2902–2909. doi: 10.1021/jm960881d. [DOI] [PubMed] [Google Scholar]
- 26.Cavaluzzi MJ, Borer PN. Revised UV extinction coefficients for nucleoside-5′-monophosphates and unpaired DNA and RNA. Nucleic Acids Res. 2004;32:e13. doi: 10.1093/nar/gnh015. [DOI] [PMC free article] [PubMed] [Google Scholar]
- 27.Berger I, Kang CH, Sinha N, Wolters M, Rich A. A highly efficient 24-condition matrix for the crystallization of nucleic acid fragments. Acta Crystallogr. D Biol. Crystallogr. 1996;52:465–468. doi: 10.1107/s0907444995013564. [DOI] [PubMed] [Google Scholar]
- 28.Otwinowski Z, Minor W. Processing of X-ray diffraction data collected in oscillation mode. In: Carter CW Jr., Sweet RM, editors. Methods in Enzymology. Vol. 276. New York: Academic Press; 1997. pp. 307–326. [DOI] [PubMed] [Google Scholar]
- 29.Kabsch W. XDS. Acta. Crystallogr. D Biol. Crystallogr. 2010;66:125–132. doi: 10.1107/S0907444909047337. [DOI] [PMC free article] [PubMed] [Google Scholar]
- 30.Adams PD, Afonine PV, Bunkoczi G, Chen VB, Davis IW, Echols N, Headd JJ, Hung LW, Kapral GJ, Grosse-Kunstleve RW, et al. PHENIX: A comprehensive Python-based system for macromolecular structure solution. Acta. Crystallogr. D Biol. Crystallogr. 2010;66:213–221. doi: 10.1107/S0907444909052925. [DOI] [PMC free article] [PubMed] [Google Scholar]
- 31.Brunger AT, Adams PD, Clore GM, DeLano WL, Gros P, Grosse-Kunstleve RW, Jiang JS, Kuszewski J, Nilges M, Pannu NS, et al. Crystallography & NMR system: a new software suite for macromolecular structure determination. Acta. Crystallogr. D Biol. Crystallogr. 1998;54:905–921. doi: 10.1107/s0907444998003254. [DOI] [PubMed] [Google Scholar]
- 32.Collaborative Computational Project Number 4. The CCP4 suite: programs for protein crystallography. Acta. Crystallogr. D Biol. Crystallogr. 1994;50:760–763. doi: 10.1107/S0907444994003112. [DOI] [PubMed] [Google Scholar]
- 33.Cambillau C, Roussel A. TURBO FRODO Version OpenGL.1. Marseille, France: Université Aix-Marseille II; 1997. [Google Scholar]
- 34.Emsley P, Lohkamp B, Scott WG, Cowtan K. Features and development of coot. Acta. Crystallogr. D Biol. Crystallogr. 2010;66:486–501. doi: 10.1107/S0907444910007493. [DOI] [PMC free article] [PubMed] [Google Scholar]
- 35.Blanchet C, Pasi M, Zakrzewska K, Lavery R. CURVES+ web server for analyzing and visualizing the helical, backbone and groove parameters of nucleic acid structures. Nucleic Acids Res. 2011;39:W68–W73. doi: 10.1093/nar/gkr316. [DOI] [PMC free article] [PubMed] [Google Scholar]
- 36.Jeener J, Meier BH, Bachmann P, Ernst RR. Investigation of exchange processes by 2-dimensional NMR spectroscopy. J. Chem. Phys. 1979;71:4546–4553. [Google Scholar]
- 37.Wagner R, Berger S. Gradient-selected NOESY - A fourfold reduction of the measurement time for the NOESY experiment. J. Magn. Res. A. 1996;123:119–121. doi: 10.1006/jmra.1996.0222. [DOI] [PubMed] [Google Scholar]
- 38.Piantini U, Sorensen OW, Ernst RR. Multiple quantum filters for elucidating NMR coupling networks. J. Am. Chem. Soc. 1982;104:6800–6801. [Google Scholar]
- 39.Piotto M, Saudek V, Sklenar V. Gradient-tailored excitation for single-quantum NMR spectroscopy of aqueous solutions. J. Biomol. NMR. 1992;6:661–665. doi: 10.1007/BF02192855. [DOI] [PubMed] [Google Scholar]
- 40.Goddard TD, Kneller DG. SPARKY v. 3.113. San Francisco: University of California; 2006. [Google Scholar]
- 41.James TL. Relaxation matrix analysis of two-dimensional nuclear Overhauser effect spectra. Curr. Opin. Struct. Biol. 1991;1:1042–1053. [Google Scholar]
- 42.Keepers JW, James TL. A theoretical study of distance determination from NMR. Two-dimensional nuclear Overhauser effect spectra. J. Magn. Reson. 1984;57:404–426. [Google Scholar]
- 43.Borgias BA, James TL. MARDIGRAS—a procedure for matrix analysis of relaxation for discerning geometry of an aqueous structure. J. Magn. Reson. 1990;87:475–487. [Google Scholar]
- 44.Arnott S, Hukins DWL. Optimised parameters for A-DNA and B-DNA. Biochem. Biophys. Res. Comm. 1972;47:1504–1509. doi: 10.1016/0006-291X(72)90243-4. [DOI] [PubMed] [Google Scholar]
- 45.Frisch MJ, Trucks GW, Schlegel HB, Scuseria GE, Robb MA, Cheeseman JR, Montgomery JA, Vreven T, Kudin KN, Burant JC, et al. GAUSSIAN 03. 2004 Gaussian, Inc., Wallingford, CT. [Google Scholar]
- 46.Kirkpatrick S, Gelatt CD, Jr, Vecchi MP. Optimization by simulated annealing. Science. 1983;220:671–680. doi: 10.1126/science.220.4598.671. [DOI] [PubMed] [Google Scholar]
- 47.Case DA, Cheatham TE, 3rd, Darden T, Gohlke H, Luo R, Merz KM, Jr, Onufriev A, Simmerling C, Wang B, Woods RJ. The AMBER biomolecular simulation programs. J. Comput. Chem. 2005;26:1668–1688. doi: 10.1002/jcc.20290. [DOI] [PMC free article] [PubMed] [Google Scholar]
- 48.Bashford D, Case DA. Generalized Born models of macromolecular solvation effects. Annu. Rev. Phys. Chem. 2000;51:129–152. doi: 10.1146/annurev.physchem.51.1.129. [DOI] [PubMed] [Google Scholar]
- 49.Reid BR. Sequence-specific assignments and their use in NMR studies of DNA structure. Q. Rev. Biophys. 1987;20:2–28. doi: 10.1017/s0033583500004212. [DOI] [PubMed] [Google Scholar]
- 50.Patel DJ, Shapiro L, Hare D. DNA and RNA: NMR studies of conformations and dynamics in solution. Q. Rev. Biophys. 1987;20:35–112. doi: 10.1017/s0033583500004224. [DOI] [PubMed] [Google Scholar]
- 51.Boelens R, Scheek RM, Dijkstra K, Kaptein R. Sequential assignment of imino- and amino-proton resonances in 1H NMR spectra of oligonucleotides by two-dimensional NMR spectroscopy. Application to a lac operator fragment. J. Magn. Reson. 1985;62:378–386. [Google Scholar]
- 52.Keepers JW, James TL. A theoretical study of distance determination from NMR. Two-dimensional nuclear Overhauser effect spectra. J. Magn. Reson. 1984;57:404–426. [Google Scholar]
- 53.Petersheim M, Turner DG. Base-stacking and base-pairing contributions to helix stability: thermodynamics of double-helix formation with CCGG, CCGGp, CCGGAp, ACCGGp, CCGGUp, and ACCGGUp. Biochemistry. 1983;22:256–263. doi: 10.1021/bi00271a004. [DOI] [PubMed] [Google Scholar]
- 54.Turner DH, Petersheim M, Albergo DD, Dewey TG, Freier SM. Why do nucleic acids form helices? In: Sarma RH, editor. Proceedings of the 2nd SUNYA Conversation in the Discipline Biomolecular Stereodynamics. Vol. I. New York: Adenine Press; 1995. pp. 429–438. [Google Scholar]
- 55.Fiala KA, Brown JA, Ling H, Kshetry AK, Zhang J, Taylor JS, Yang W, Suo Z. Mechanism of template-independent nucleotide incorporation catalyzed by a template-dependent DNA polymerase. J. Mol. Biol. 2007;365:590–602. doi: 10.1016/j.jmb.2006.10.008. [DOI] [PMC free article] [PubMed] [Google Scholar]
- 56.Guckian KM, Schweitzer BA, Ren RX, Sheils CJ, Tahmassebi DC, Kool ET. Factors contributing to aromatic stacking in water: evaluation in the context of DNA. J. Am. Chem. Soc. 2000;122:2213–2222. doi: 10.1021/ja9934854. [DOI] [PMC free article] [PubMed] [Google Scholar]
- 57.Yakovchuk P, Protozanova E, Frank-Kamenetskii MD. Base-stacking and base-pairing contributions into thermal stability of the DNA double helix. Nucleic Acids Res. 2006;34:564–574. doi: 10.1093/nar/gkj454. [DOI] [PMC free article] [PubMed] [Google Scholar]
- 58.Gallego J, Loakes D. Solution structure and dynamics of DNA duplexes containing the universal base analogues 5-nitroindole and 5-nitroindole 3-carboxamide. Nucleic Acids Res. 2007;35:2904–2912. doi: 10.1093/nar/gkm074. [DOI] [PMC free article] [PubMed] [Google Scholar]
- 59.Matsuda S, Fillo JD, Henry AA, Rai P, Wilkens SJ, Dwyer TJ, Geierstanger BH, Wemmer DE, Schultz PG, Spraggon G, et al. Efforts toward expansion of the genetic alphabet: Structure and replication of unnatural base pairs. J. Am. Chem. Soc. 2007;129:10466–10473. doi: 10.1021/ja072276d. [DOI] [PMC free article] [PubMed] [Google Scholar]
- 60.Malyshev DA, Pfaff DA, Ippoliti SI, Hwang GT, Dwyer TJ, Romesberg FE. Solution structure, mechanism of replication, and optimization of an unnatural base pair. Chemistry. 2010;16:12650–12659. doi: 10.1002/chem.201000959. [DOI] [PMC free article] [PubMed] [Google Scholar]
- 61.Johar Z, Zahn A, Leumann CJ, Jaun B. Solution structure of a DNA duplex containing a biphenyl pair. Chemistry. 2008;14:1080–1086. doi: 10.1002/chem.200701304. [DOI] [PubMed] [Google Scholar]
- 62.Langenegger SM, Haner R. Excimer formation by interstrand stacked pyrenes. Chem. Commun. 2004:2792–2793. doi: 10.1039/b412831a. [DOI] [PubMed] [Google Scholar]
- 63.Langenegger SM, Haner R. Selectivity in DNA interstrand-stacking. Bioorg. Med. Chem. Lett. 2006;16:5062–5065. doi: 10.1016/j.bmcl.2006.07.039. [DOI] [PubMed] [Google Scholar]
- 64.Malinovskii VL, Samain F, Haner R. Helical arrangement of interstrand stacked pyrenes in a DNA framework. Angew. Chem. Int. Ed. 2007;46:4464–4467. doi: 10.1002/anie.200700891. [DOI] [PubMed] [Google Scholar]
- 65.Painter SL, Zegar IS, Tamura PJ, Bluhm S, Harris CM, Harris TM, Stone MP. Influence of the R(61,2)- and S(61,2)-α-(N6-adenyl)styrene oxide adducts on the A:C mismatched base pair in an oligodeoxynucleotide containing the human N-ras codon 61. Biochemistry. 1999;38:8635–8646. doi: 10.1021/bi9900323. [DOI] [PubMed] [Google Scholar]
- 66.Eoff RL, Irimia A, Egli M, Guengerich FP. Sulfolobus solfataricus DNA polymerase Dpo4 is partially inhibited by “wobble” pairing between O6-methylguanine and cytosine, but accurate bypass is preferred. J. Biol. Chem. 2007;282:1456–1467. doi: 10.1074/jbc.M609661200. [DOI] [PubMed] [Google Scholar]
Associated Data
This section collects any data citations, data availability statements, or supplementary materials included in this article.