


Abstract
Current microRNA target predictions are based on sequence information and empirically derived rules but do not make use of the expression of microRNAs and their targets. This study aimed to improve microRNA target predictions in a given biological context, using in silico predictions, microRNA and mRNA expression. We used target prediction tools to produce lists of predicted targets and used a gene set test designed to detect consistent effects of microRNAs on the joint expression of multiple targets. In a single test, association between microRNA expression and target gene set expression as well as the contribution of the individual target genes on the association are determined. The strongest negatively associated mRNAs as measured by the test were prioritized. We applied our integration method to a well-defined muscle differentiation model. Validation of our predictions in C2C12 cells confirmed predicted targets of known as well as novel muscle-related microRNAs. We further studied associations between microRNA–mRNA pairs in human prostate cancer, finding some pairs that have been recently experimentally validated by others. Using the same study, we showed the advantages of the global test over Pearson correlation and lasso. We conclude that our integrated approach successfully identifies regulated microRNAs and their targets.
INTRODUCTION
Many algorithms have been developed for microRNA (miRNA) target prediction (1–6). Most of the prediction algorithms are based on sequence information and empirically derived rules, e.g. sequence alignment information, conservation of sequence regions between species and/or free energy calculation of the miRNA–mRNA complex (7). Other methods use a combination of information together with a classifier like support vector machines (8,9) or hidden Markov models (10). So far, the lists of predicted targets generated by different prediction tools poorly overlap with the small number of validated targets (11). Recently, several authors suggested to integrate expression profiles from both miRNA and mRNA with in silico target predictions to reduce the number of false positives and increase the number of biologically relevant targets, e.g. (12–14) or see the review of Muniategui et al. (15) and references therein.
However, the proposed methods have important limitations. miRNAs are often ‘fine-tuners’ of mRNA expression (16), leading to weak individual associations between miRNA with mRNA expression profiles. This means that methods based on pairwise correlations of miRNA and mRNA expressions (17–19) have low power to find individual associations, which is further reduced by a large multiple testing problem. Other methods first test for differential miRNA and mRNA expression and subsequently test for enrichment of differentially expressed targets (20–22), or after differential expression analysis, a meta analysis-like approach is used (12). These approaches rely on arbitrary thresholds in the separate analyses and do not measure association between the expression data sets. Other disadvantages of enrichment methods, such as Fisher’s exact test or GSEA (23), have been discussed elsewhere (24,25), and better alternatives, including the global test, have been proposed (26–28).
Methods based on penalized regression, such as lasso, have also been proposed (13,29). Such methods focus on representation of the outcome variable using the covariates, but do not lead to a significance test of association. Engelmann (13) has proposed to estimate significance by using resampling. In contrast, the global test directly leads to an association test, without the need of computationally intensive resampling. Previously, we used the global test in the integrated analysis of DNA copy number and gene expression (30). We showed that a global test-based integration model is robust and sensitive to identify sets of genes whose expression is affected by copy number. Here, we propose to use the global test (26) for the integration of miRNA and mRNA expression by testing whether expression of predicted targets is related to the miRNA expression. Because the predicted mRNA targets of each miRNA are tested together, the multiple testing problem is largely reduced. Also, the power to detect weak associations is increased. Furthermore, within the same model the influence of the individual mRNA targets on the test statistic is available for further prioritization of the targets.
We applied our integrated analysis approach to two mammalian data sets. Firstly, we used a well-defined muscle differentiation model in which we experimentally validated novel predicted miRNA targets. Secondly, we used the miRNA and mRNA expression profiles of a large study on prostate cancer to study whether predicted miRNA–mRNA pairs overlap with validated pairs. Finally, our quantitative comparison showed the advantages of the global test for integrated analysis of miRNA and mRNA expression data.
MATERIALS AND METHODS
C2C12 expression data
miRNA and mRNA microarray expression profiles on a time course of C2C12 cell differentiation were obtained from two previously described studies (20,31). mRNA expression was measured using Agilent’s one-color  whole mouse genome oligo arrays. The locked-nucleic acid technology from miRCURY was used for the miRNA expression profiling. Data sets are publicly available from GEO (32) as series GSE19968 and GSE9449.
miRNA expression profiles were obtained from proliferating myoblasts (60–70% confluence), at confluence (100%), 1, 2 and 4 days after induction of differentiation (20), whereas the mRNA expression profiles were obtained from the myoblasts stage, start of differentiation, 24 h after the start of differentiation and from myotubes (96 h after start of differentiation) (31). To match the data as well as possible miRNA expression time point ‘2 days after induction of differentiation’ was removed. The miRNA array probes represented 339 mouse miRNAs. The mRNA probe identifiers were mapped to 21 202 unique Entrez identifiers. Mappings were based on data provided by Entrez Gene ftp://ftp.ncbi.nlm.nih.gov/gene/DATA, with a date stamp from the source of 14 September 2011.
Prostate cancer expression data
Matched miRNA and mRNA expression profiles (33) for 140 samples (112 tumor, 28 normal) were collected from GEO (32) as series GSE21036 and GSE21034. miRNA expression profiles were obtained using Agilent miRNA V2 arrays. Whole-transcript and exon-level expression data were obtained using Affymetrix Human Exon 1.0 ST. In our integrated analysis, we used the whole-transcript data. Gene bank accession numbers were converted to 20 035 unique entrez identifiers. The miRNA expression data contained 373 unique miRNAs. Mappings were based on data provided by Entrez Gene ftp://ftp.ncbi.nlm.nih.gov/gene/DATA, with a date stamp from the source of 4 September 2012.
Collecting predicted and validated targets
We selected three commonly used tools for target prediction: TargetScan version 6.1 (6), microCosm version 5 (formerly miRBase Targets) (5) and PITA version from 2007 (4). The processed data of all three prediction tools were stored in a local SQLite (34) database enabling fast querying of the data.
We selected three databases containing validated targets: Tarbase version 5c (35), miRecords version November 25, 2010 (36) and miRTarBase release 3.5 (37). The union of these databases was used, with filtering to (i) exclude those pairs of which mRNA or miRNA were not tested on the arrays and (ii) exclude pairs that were not in the predicted data used to build the gene sets. Because validated databases in general do no contain specific information on the biological context, we also used the manually obtained list of prostate-specific miRNA–mRNA pairs of Lu et al. (29).
Pseudo code: Integrated Analysis.
Input:
 matrix of mRNA expression profiles
 matrix of miRNA expression profiles
 incidence matrix relating miRNAs to mRNAs
Output:
P-values:
 vector of P-values for the miRNAs direction and strength of the individual target association extracted from gtObject
for each miRNA i do
{
y <- Y[i,] ##miRNA expression profile
w <- W[i,] ##predicted targets
Xw <- X[w,] ##mRNA expression profiles
gtObject <- gt(y ∼ Xw) ##globaltest-function
}
Integrated analysis
We propose an integrated analysis of miRNA and mRNA expression based on the global test (see Pseudo code above). The global test is a generalization for testing the global null hypothesis of a linear (or generalized linear) regression model  when the number of features exceeds the number of samples (
 ).
).
In our integrated analysis, the linear model with only an intercept is tested against the alternative model  . Here
  represents the expression profile of a certain miRNA and
  the expression profiles of the predicted mRNA targets for that miRNA. The number of targets p is generally larger than the number of samples n. For more details about the technicalities of the method, see section ‘Integrated analysis method’ in the Supplementary Material.
A useful interpretation of the global test for the linear model is as a sum of squared covariances between predictors and responses [see section 5 of (26)]. Furthermore, because the global test test-statistic is a sum of test-statistics of the single targets, ranking of the targets is included in the test. Also, target prediction scores are easily incorporated in the global test by using a weighted sum, see e.g. Jelier et al. (38).
Reporter plasmids construction
Parts of 250–500 nucleotides of the 3′ untranslated regions (UTR) of the selected target genes containing the miRNA recognition sites were amplified by PCR (for primer sequences see Supplementary Table S1) from oligo dT-primed cDNA derived from C2C12 proliferating muscle precursor cells. The resulting amplified fragments were cloned into pGEM-T easy (Promega), sequence verified and subsequently cloned into pMIR-REPORT (Invitrogen).
Transfection and luciferase measurement
C2C12 muscle precursor cells were cultured in Dulbecco’s Medium (without phenol red) supplemented with 10% fetal bovine serum, 1% penicillin/streptomycin, 2% Glutamax and 1% glucose (all from Gibco-BRL) using plates that were pre-coated with purified bovine dermal collagen (Vitrogen100; Cohesion). At 70% confluency, the cells were harvested and plated in a microclear 96-wells plate at  cells per well in penicillin/streptomycin free medium. After 24 h, the cells were transfected with 100 ng pMIR-REPORT 3′ UTR, 10 ng Renilla-Luc (Promega) and 100 nM miRNA using DharmaFECT Duo Transfection Reagent (Thermo scientific) according to the manufacturer’s protocol. Synthetic miRNAs were obtained from Thermo scientific. All transfections were done at least in triplo. After 24 h, luciferase activity was measured for both luciferase and renilla constructs using the Dual-Glo ®Luciferase Assay System (Promega).
Luciferase assay analysis
The luciferase assay was performed using three 96-wells plates. On each plate, the background for both luciferase and renilla luminescence was measured in wells only containing the C2C12 cells. The median value per plate was used for a background subtraction to correct plate effects. For further analysis, the ratios between the background-corrected luciferase and renilla intensities were used. For each cloned 3′ UTR target, a one-sided two-sample Wilcoxon rank-sum test was performed between between the transfections including the miRNA for which a binding site was predicted and the other transfections.
Software
R-2.14.1 (39) was used together with the following packages: globaltest, 5.8.1, (40), org.Mm.eg.db, 2.6.4, (41), RSQLite, 0.11.1, (34), DBI, 0.2.5, (42), AnnotationDbi, 1.16.19, (43), GEOquery, 2.21.9, (44), directlabels, 2.6, (45), VennDiagram, 1.5.1, (46) and lattice, 0.20-6, (47). Our approach is wrapped-up in a package called miRNAmRNA, 1.0.0, available from www.humgen.nl/MicroarrayAnalysisGroup.html.
RESULTS
Integrated analysis of miRNA and mRNA expression
For our integrated approach, we generated overlapping lists of in silico predicted targets by TargetScan, microCosm and PITA. These tools were selected based on partly complementary prediction algorithms and support for multiple organisms. For each miRNA, mRNA expression profiles were extracted for the overlapping targets predicted by all three databases. The size of the gene sets varied between 1 and 157 predicted targets.
Of the 339 mouse miRNAs assayed, 208 had at least one predicted target by all three prediction tools. We ranked the miRNAs based on the strength of association with the collective expression profiles of the predicted mRNA targets using the global test (Table 1).
Table 1.
Overview of mouse miRNAs that show the strongest association with gene expression of their predicted target sets
| miRNA | P-valuea | Number of targetsb | Regulationc |
|---|---|---|---|
| miR-134 | 0.00366 | 5 | up |
| miR-20a | 0.00677 | 134 | down |
| miR-500 | 0.01090 | 23 | up |
| miR-133a | 0.01230 | 49 | up |
| let-7c | 0.01614 | 86 | up |
| miR-24 | 0.02212 | 47 | up |
| miR-346 | 0.02681 | 4 | down |
| miR-93 | 0.03190 | 124 | down |
| miR-701 | 0.03250 | 1 | down |
| miR-299 | 0.03305 | 8 | up |
| miR-15b | 0.03308 | 100 | down |
| miR-486 | 0.03409 | 13 | up |
| miR-32 | 0.03616 | 120 | down |
| miR-26a | 0.03693 | 76 | up |
| miR-495 | 0.05060 | 48 | up |
| miR-467a | 0.05228 | 34 | down |
| miR-543 | 0.05705 | 55 | down |
| miR-33 | 0.06556 | 20 | down |
| miR-150 | 0.06703 | 17 | up |
| miR-22 | 0.07198 | 41 | up |
aP-values are calculated using an asymptotic distribution for the global test test statistic.
bmRNAs in the gene set, the intersecting predictions between TargetScan, microCosm and PITA.
cIndicates direction of change in miRNA expression during C2C12 differentiation, comparing differentiated versus proliferating myoblasts.
Although we did not, a priori, select for miRNAs that were differentially regulated during C2C12 cell differentiation, the miRNAs mmu-miR-133a and mmu-miR-26a, which are known to be upregulated during muscle differentiation (20,48,49), were ranked among the top 20. This was expected, as the global test models the expression of miRNAs as a function of the expression of the predicted targets, and statistically significant associations require some level of regulation of the miRNA under the tested experimental conditions. Figure 1 shows the expression of the top 20 associated miRNAs during muscle cell differentiation. Among the identified miRNAs highly associated to target gene expression in differentiating C2C12 cells, several have been related to muscle in literature e.g. miR-133a, miR-26a, miR-24 and miR-486 (50). To validate our integrated approach, we selected two known myomirs, mmu-miR-133a (49) and mmu-miR-26a (20), and an miRNA predicted by our approach to be involved in C2C12 cell differentiation, mmu-miR-22. Similar to mmu-miR-133a and mmu-miR-26a, mmu-miR-22 is upregulated during differentiation of C2C12 cells (Figure 1). Four of five most negatively associated target genes of miR-22 are involved in cytoskeleton reorganization, which is a process occurring during myoblast differentiation (51).
Figure 1.
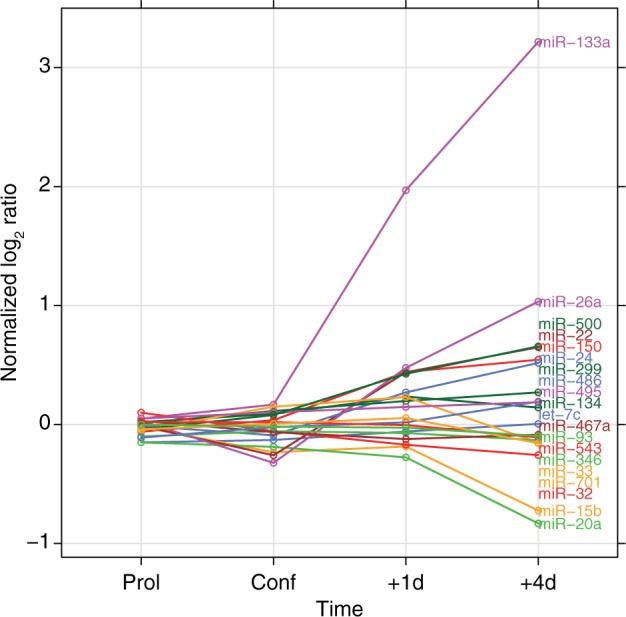
miRNA expression profiles of the top 20 that show the highest association with gene expression of their target sets. The normalized  ratio compares the expression from proliferating myoblasts (60–70% confluence), at confluence (100%), 1 and 4 days after induction of differentiation to a pool of proliferating myoblasts (20).
For each of these three miRNAs, we selected mRNAs for validation from the top 10 targets most strongly and negatively associated mRNAs with the miRNA expression according to global test (Supplementary Tables S2–S4). As positive controls, two known targets for mmu-miR-26a Epha2 and Ezh2 were included, although they ranked lower than the top 10 in our result (Supplementary Table S1). For mmu-miR-133a, the known target Whsc2 (48) was included as positive control.
Validation experiments
The 3′ untranslated regions (UTR) of 11 top-ranked mRNA targets were cloned behind luciferase reporters (Supplementary Table S1). The UTRs of Arfip2 and Fbxl19 contained predicted binding sites for multiple tested miRNAs (Figure 2). Co-transfection experiments with synthetic mmu-miR-133a, mmu-miR-26a and mmu-miR-22 were performed to evaluate the effect of specific miRNA binding on luciferase protein activity (Figure 3). The three top negatively associated targets—Wasf1, Arpc5 and Nr3c1—were indeed regulated by mmu-miR-22, which we predicted to be involved in C2C12 cell differentiation (Figure 3 upper row). Whsc2, a known target for mmu-miR-133a, was clearly downregulated by the targeting miRNA. Also the predicted targets Foxc1, Ptbp2 and Arfip2 showed significant downregulation by mmu-miR-133a (Figure 3 middle row). For mmu-miR-26a, both known targets Epha2 and Ezh2 and predicted target Thrap3 showed significant downregulation (Figure 3 bottom row).
Figure 2.
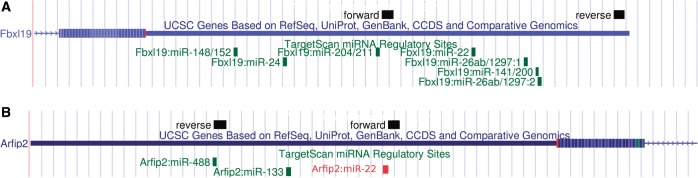
(A) Part of the 3′ UTR of Fbxl19 taken from the UCSC browser [assembly July 2007 (NCBI37/mm9)]. The black boxes indicate BLAT (52) alignment of the forward and reverse primers used to PCR-amplify a fragment to insert in the luciferase construct. In green are the seed-regions for predicted miRNAs by TargetScan. [Note that miR-141/200 ranked lower than the top 20 respectively, 48, 155, 194, 209 for miRNAs mmu-miR-200a (0.2), mmu-miR-141 (0.7), mmu-miR-200c (0.9) and mmu-miR-200b (0.9), with global test P-value between brackets.] (B) Part of the 3′ UTR of Arfip2 taken from the UCSC browser. The black boxes indicate BLAT alignment of the forward and reverse primers used to PCR-amplify a fragment to insert in the luciferase construct. In green are the seed-regions for predicted miRNAs by TargetScan. The red box is the seed-region for mmu-miR-22 manually added, as the older version of TargetScan used to find overlapping targets did not predicted Arfip2 as a target for mmu-miR-22.
Figure 3.

Validation of miRNA–mRNA target pairs by co-transfection of luciferase 3′ UTR reporter constructs and synthetic miRNAs in C2C12 cells. Luciferase activities in cells transfected with the miRNA targeting the cloned 3′ UTR are depicted in color: top row: mmu-miR-22 in green  , middle row mmu-miR-133a in red △ and bottom row mmu-miR-26a in dark blue × . Points reflect independent biological replicates (n = 3 per condition). Note that the y-axis scale of each panel is different, reflecting differences in baseline activity of the luciferase UTR reporters. P-values reported at the top of each panel are the results from a one-sided two-sample Wilcoxon rank sum tests for each luciferase 3′ UTR reporter between the miRNA for which a binding site was predicted and the non-binding miRNAs.
The 3′ UTR of Fbxl19 contained two predicted binding sites for mmu-miR-26a and one for mmu-miR-22 (Figure 2A). Indeed, mmu-miR-22 reduced the luciferase activity, 1.7-fold, mmu-miR-26a (two sites) 2.4-fold and their combination 2.6-fold (Figure 4A). The gene Arfip2 is predicted to be regulated by both mmu-miR-133a and mmu-miR-22. Target predictions that were made using an older version of TargetScan Nov 2011 did not identify Arfip2 as a predicted target for mmu-miR-22. Therefore, initially primers were only designed around the binding site of mmu-miR-133a. However, it turned out that the binding site for mmu-miR-22 was included as well (Figure 2B). Both miRNAs downregulated Arfip2 with P-values  (Figure 4B).
Figure 4.
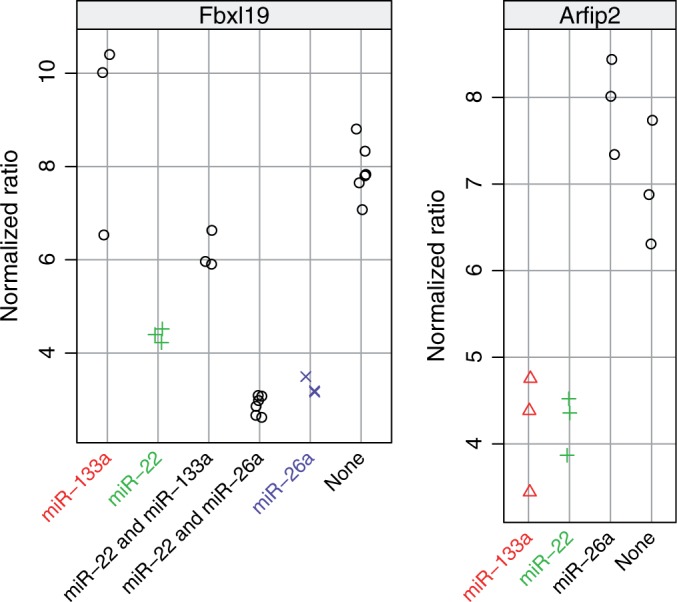
Validation of miRNA–mRNA target pairs by co-transfection in C2C12 cells for those 3′ UTRs that were predicted to have multiple binding sites. Notice that the y-axis scale of each panel is different, reflecting differences in baseline activity of the luciferase UTR reporters.
This proof-of-principle study shows that the integrated analysis of in silico predicted targets with miRNA and mRNA expression profiles identified muscle-related miRNAs and their target genes.
Prostate cancer
Our integrated analysis approach has other generic features. For example, reversing the model, to test the association between the expression of one mRNA with its set of potentially regulating miRNAs as proposed by (13,29), is easily accomplished. Furthermore, target prediction tools do not show much overlap in their predictions and there could be added value in using the partial overlap between prediction tools. This option is often implemented in miRNA functional annotation tools (53). To show these two additional features, we used the human prostate cancer data described by (33).
Integrated analysis using the original model with the predicted targets from the strict overlap between TargetScan, microCosm and PITA as a set, resulted in 175 significant miRNAs associated with the corresponding predicted targets (FDR  ). Keeping the strongest associated targets for each miRNA (FDR
  ) resulted in 1732 significant miRNA–mRNA pairs (Supplementary Tables S5 and S6). Of these significant pairs, 47 have been validated (Supplementary Figure S1A and Supplementary Table S5). Integrated analysis using the reverse model with miRNA sets yielded 961 significant mRNAs containing a total of 1653 significant miRNA–mRNA pairs (using the same thresholds as before), with 203 unique miRNAs (Supplementary Table S7). The overlap with the previous analysis is 170 and 1486, miRNAs and miRNA–mRNA pairs, respectively (Supplementary Figure S2A and Supplementary Table S5). Out of 10 prostate cancer-specific miRNA–mRNA pairs described by Lu et al. (29) that we could predict, four pairs overlapped with our results: hsa-miR-100:SMARCA5, hsa-miR-101:EZH2, hsa-miR-125b:BAK1 and hsa-miR-141:ZEB2. Both miR-141 and the oncomir miR-125b ranked high in our list, respectively 21 and 10, and the targets respectively at 5 and 1 within each list. Recently, these miRNAs have been described to play an important role in prostate cancer development (54).
There was increased overlap of associated pairs with validated pairs when the integrated analysis was performed using partial overlap between target prediction tools (Supplementary Figures S1C, D, and S2B and Supplementary Tables S5, S8 and S9), increasing from 4 to 18 for the original model and 4 to 19 for the reversed model. However, also the number of validated pairs that did not overlap with our predictions increased. Compared with all associations, there was a slight increase in the proportion of validated pairs among the negatively associated pairs.
Quantitative comparison between different methods
Approaches recently proposed to jointly analyse miRNA and target mRNAs have used Pearson correlation and lasso (13,14). In addition to a qualitative comparison summarized in Supplementary Table S10, we performed a comprehensive quantitative comparison between these methods and the global test, illustrated with the prostate cancer data set (see section ‘Prioritization of microRNAs and their targets: quantitative comparison of global test, correlation and lasso’ of the Supplementary Material). We showed that the global test yields better prioritization of miRNAs by taking all of their targets into account to produce a P-value (Figure 5). In contrast, lasso aims at sparsity, so may ignore target mRNAs with relatively large association with the miRNA under study. Pearson correlation only yields results per pair, so objective prioritization of relevant miRNAs would involve stricter multiple testing correction, and thus less power.
Figure 5.

Comparison of global test, correlation and lasso for the prioritization of miRNAs and their targets. The x-axis represents the global test z-score (global test statistic transformed to z-scores) for each miRNA. The miRNAs are ordered according to the global test statistic, with increasing significance from left to right, and the vertical line separates not significant (left) from significant (right) associations, all according to the global test. The vertical stacks of points represent the global test statistics separately for each target, colored according to significance (black if significant, i.e. P-value < 0.001 after multiple testing correction using Benjamini–Hochberg’s FDR; grey otherwise). The size of each point reflects the absolute correlation coefficient. Red squares indicate miRNA–mRNA pairs selected by lasso, so that in each vertical column of squares the red ones represent mRNA targets with a non-zero lasso-regression coefficient.
Using subsampling, we found that miRNA selections by the global test and by Pearson correlation yield relatively the same sensitivity, but the global test’s specificity is much better, with the Pearson correlation including many more false positives than expected (Supplementary Figures S4A and B). In terms of miRNA–mRNA pairs, Pearson correlation and global test yield virtually the same selection (Supplementary Figure S4C). Lasso does keep false discoveries under control (Supplementary Figure S4D) in the selection of miRNA–mRNA pairs; however, its sparsity is not helpful to find all relevant miRNA–mRNA pairs (Figure 5). These results strengthen the choice of the global test for our approach for integrated analysis of miRNA and mRNA expression data.
Using prediction scores
Most tools assign a prediction score for miRNA–mRNA interaction, which could be used in a weighted global test (38). However, the scores from different tools reflect different aspects of miRNA–mRNA interaction, have different ranges and distributions and generally are not correlated (55). Therefore, combining prediction scores of multiple tools to a single score is not trivial. We included combined weights using rank, max and uniform scaling approaches and conducted the integrated analysis of miRNA and mRNA expression. Using the weighted global test with the combined prediction scores resulted in slightly different P-values and ranking of predicted targets but did not improve the predictions of known targets (data not shown).
DISCUSSION
We integrated target prediction information with miRNA and mRNA expression data to prioritize miRNAs and associated targets in a specific biological context. Essentially, each miRNA was tested for association with expression levels of a set of predicted mRNA targets using the global test (26). Our results show that the global test is better suited for integrated analysis of miRNA and mRNA expression data, compared with either Pearson correlation or lasso-based approaches.
Our systematic approach enables the identification of miRNAs that are strongly associated with a set of target-gene expressions in the biological condition of interest. Within the same model, the influences of the individual mRNA targets on the test statistic are available. The most highly negatively associated target genes were prioritized for experimental validation. We used a luciferase reporter assay in C2C12 cells and confirmed all of our predictions. We also showed that multiple miRNAs targeting the same gene can be detected and may act synergistically, as has been reported before (56).
We compared our results with those of Wong et al. (20) on C2C12 miRNA expression. Wong et al. used stringent P-value and fold-change cutoffs resulting in six potential miRNAs involved in C2C12 muscle cell differentiation, namely mmu-miR-133a/133b, mml-miR-133a (mml = Macaca mulatta), mmu-miR-206, mmu-miR-26a, mmu-miR-422b upregulated and mmu-miR-222 downregulated. Subsequently, these were matched to differentially expressed mRNAs previously reported (57). Three identified mRNAs were downregulated and were targets predicted by three tools (PicTar, TargetScan and miRanda) for two upregulated miRNAs. Two mRNAs, Ezh2 and Epha2, were validated as targets for mmu-miR-26a, and Gja1 as target for mmu-miR-206. This approach relies on arbitrary thresholds in the separate analyses and does not take into account association between the expression data sets. The separate analyses also require a meaningful grouping of samples, leading to a short list of differentially expressed miRNAs and mRNAs. This leads to a too strict approach, as differential expression (and grouping) need not occur for miRNA regulation of mRNA expression. Therefore, the power to detect miRNA–mRNA pairs is lower. Indeed, we confirmed Wong’s results, and found several more targets that were confirmed by validation experiments, showing the superior power of the method.
Our method does not require grouping of samples, as no shortlist of miRNAs or mRNAs is needed. It is most powerful when the same biological samples are used for obtaining the miRNA and mRNA expression profiles, which was not the case for the C2C12 data we have used here. In addition, the small sample size resulted in P-values for both miRNAs and mRNAs that were not extremely significant, although still yielding successfully validated effects.
miRNA and mRNA expression associations can only be found if the mRNA is degraded after being targeted, so some associations that affect translation only are missed. If protein abundance data were used instead of mRNA, however, our integrated approach could be used and all associations would be detectable.
Since the review paper of (15), new methods have been proposed for the integrated analysis of miRNA and mRNA expression data with in silico predicted targets using gene sets, e.g. (12–14). Although the methods of (12–14) use in silico target predictions to define sets of mRNAs or miRNAs in their models, there are substantial differences between these methods and our method, both in the type of hypothesis tested and the computational approach (an overview is given in Supplementary Table S10).
Artmann proposed a supervised method that separately tests for differentially expressed miRNAs between two conditions and whether the corresponding set of predicted targets is differentially expressed between these conditions. The resulting P-values are combined using a meta-analysis approach giving a ranked list of miRNAs that are simultaneously differentially expressed between the conditions and associated with the corresponding predicted targets. In contrast, our approach directly tests the association between miRNA and mRNA expression without taking a grouping variable into account, so there is no need for a meta-analysis approach to combine P-values, which could lead to power loss. The method by Bossel Ben-Moshe et al. is based on the Pearson correlation between the miRNA expression profile and the expression profiles of the predicted targets. They use a strategy which is closely related to gene set enrichment analysis (GSEA) (23) to calculate the enrichment of the top ranked in silico predicted pairs, based on the prediction scores. We have shown that our method is comparable with Pearson correlation per pair, but yields better prioritization of miRNAs. Prediction scores can also be easily incorporated in our method, but these did not improve the predictions of known targets in our examples. The approach of Engelmann et al. is based on the penalized linear regression algorithm, lasso (58), for selection of the miRNAs that best predict the target expression, used before in the context miRNA–mRNA prediction also by (29). We have shown that this is not ideal for finding all miRNA–mRNA pairs in any context (Supplementary Material).
Other differences between these approaches seem more arbitrary, such as the choice of the database(s) containing target predictions or the use of partial or strict overlap between databases. Our integrated approach is generic: either miRNAs or mRNAs can be used as a set, the decision of using partial or strict overlap is left to the user, and adding target predictions from other tools is straightforward. In addition, one could use all genes as potential targets for a miRNA to discover novel or non-canonical targets. Other advantages of our method are that given a miRNA expression profile and the expression profiles of the corresponding predicted targets, a single P-value indicates the strength of association of the miRNA expression with the expression of the predicted targets. Therefore, separate tests for differentially expressed miRNAs and mRNAs or computationally intensive resampling to obtain P-values are not necessary. Furthermore, the predicted targets are ordered automatically by strength and direction of their association. Because the number of miRNAs is much smaller than the number of mRNAs, the multiple testing problem is less severe. Finally, the number of targets predicted for a single miRNA is larger than the number of miRNAs that target the same mRNA (on average), increasing the power of the global test to detect multiple moderate and consistent associations.
In summary, we present an integrated approach for adding biological relevance to miRNA target predictions by taking into account expression of both miRNA and mRNA. Our method uses the global test to detect consistent effects across multiple genes. A single test identifies miRNAs with strong association to their predicted target gene set expression as well as the most relevant miRNA–mRNA regulatory interactions.
SUPPLEMENTARY DATA
Supplementary Data are available at NAR Online: Supplementary Tables 1–10, Supplementary Figures 1–4 and Supplementary methods.
ACKNOWLEDGEMENTS
We thank Farhad Akbari Moqadam, Monique den Boer and Eleonora de Klerk for useful discussions.
FUNDING
Centre for Medical Systems Biology within the framework of the Netherlands Genomics Initiative (NGI)/Netherlands Organisation for Scientific Research (NWO); European Commission 7th Framework Program [261123] (GEUVADIS) (partially); Netherlands Organisation for Scientific Research (NWO) Horizon [93511015 to H.P.B.]. Funding for open access charge: Center for Human and Clinical Genetics, Leiden University Medical Center.
Conflict of interest statement. None declared.
REFERENCES
- 1.Kiriakidou M, Nelson PT, Kouranov A, Fitziev P, Bouyioukos C, Mourelatos Z, Hatzigeorgiou A. A combined computational-experimental approach predicts human microRNA targets. Genes Dev. 2004;18:1165–1178. doi: 10.1101/gad.1184704. [DOI] [PMC free article] [PubMed] [Google Scholar]
- 2.Krek A, Grun D, Poy MN, Wolf R, Rosenberg L, Epstein EJ, MacMenamin P, daPiedade I, Gunsalus KC, Stoffel M, et al. Combinatorial microRNA target predictions. Nat. Genet. 2005;37:495–500. doi: 10.1038/ng1536. [DOI] [PubMed] [Google Scholar]
- 3.Miranda KC, Huynh T, Tay Y, Ang YS, Tam WL, Thomson AM, Lim B, Rigoutsos I. A pattern-based method for the identification of MicroRNA binding sites and their corresponding heteroduplexes. Cell. 2006;126:1203–1217. doi: 10.1016/j.cell.2006.07.031. [DOI] [PubMed] [Google Scholar]
- 4.Kertesz M, Iovino N, Unnerstall U, Gaul U, Segal E. The role of site accessibility in microRNA target recognition. Nat. Genet. 2007;39:1278–1284. doi: 10.1038/ng2135. [DOI] [PubMed] [Google Scholar]
- 5.Griffiths-Jones S, Saini HK, van Dongen S, Enright AJ. miRBase: tools for microRNA genomics. Nucleic Acids Res. 2008;36:D154–D158. doi: 10.1093/nar/gkm952. [DOI] [PMC free article] [PubMed] [Google Scholar]
- 6.Friedman RC, Farh KK, Burge CB, Bartel DP. Most mammalian mRNAs are conserved targets of microRNAs. Genome Res. 2009;19:92–105. doi: 10.1101/gr.082701.108. [DOI] [PMC free article] [PubMed] [Google Scholar]
- 7.Yue D, Liu H, Huang Y. Survey of computational algorithms for MicroRNA target prediction. Curr. Genomics. 2009;10:478–492. doi: 10.2174/138920209789208219. [DOI] [PMC free article] [PubMed] [Google Scholar]
- 8.Kim SK, Nam JW, Rhee JK, Lee WJ, Zhang BT. miTarget: microRNA target gene prediction using a support vector machine. BMC Bioinformatics. 2006;7:411. doi: 10.1186/1471-2105-7-411. [DOI] [PMC free article] [PubMed] [Google Scholar]
- 9.Yang Y, Wang YP, Li KB. MiRTif: a support vector machine-based microRNA target interaction filter. BMC Bioinformatics. 2008;9:S4. doi: 10.1186/1471-2105-9-S12-S4. [DOI] [PMC free article] [PubMed] [Google Scholar]
- 10.Plaisier CL, Bare JC, Baliga NS. miRvestigator: web application to identify miRNAs responsible for co-regulated gene expression patterns discovered through transcriptome profiling. Nucleic Acids Res. 2011;39:W125–W131. doi: 10.1093/nar/gkr374. [DOI] [PMC free article] [PubMed] [Google Scholar]
- 11.Witkos TM, Koscianska E, Krzyzosiak WJ. Practical aspects of microRNA target prediction. Curr. Mol. Med. 2011;11:93–109. doi: 10.2174/156652411794859250. [DOI] [PMC free article] [PubMed] [Google Scholar]
- 12.Artmann S, Jung K, Bleckmann A, Beissbarth T. Detection of simultaneous group effects in microRNA expression and related target gene sets. PLoS One. 7:e38365. doi: 10.1371/journal.pone.0038365. [DOI] [PMC free article] [PubMed] [Google Scholar]
- 13.Engelmann JC, Spang R. A least angle regression model for the prediction of canonical and non-canonical miRNA-mRNA interactions. PLoS One. 2012;7:e40634. doi: 10.1371/journal.pone.0040634. [DOI] [PMC free article] [PubMed] [Google Scholar]
- 14.Bossel Ben-Moshe N, Avraham R, Kedmi M, Zeisel A, Yitzhaky A, Yarden Y, Domany E. Context-specific microRNA analysis: identification of functional microRNAs and their mRNA targets. Nucleic Acids Res. 2012;40:10614–10627. doi: 10.1093/nar/gks841. [DOI] [PMC free article] [PubMed] [Google Scholar]
- 15.Muniategui A, Pey J, Planes F, Rubio A. Joint analysis of miRNA and mRNA expression data. Brief. Bioinformatics. 2013;14:263–278. doi: 10.1093/bib/bbs028. [DOI] [PubMed] [Google Scholar]
- 16.Bartel DP, Chen CZ. Micromanagers of gene expression: the potentially widespread influence of metazoan microRNAs. Nat. Rev. Genet. 5:396–400. doi: 10.1038/nrg1328. [DOI] [PubMed] [Google Scholar]
- 17.Fulci V, Colombo T, Chiaretti S, Messina M, Citarella F, Tavolaro S, Guarini A, Foa R, Macino G. Characterization of B- and T-lineage acute lymphoblastic leukemia by integrated analysis of MicroRNA and mRNA expression profiles. Genes Chromosomes Cancer. 2009;48:1069–1082. doi: 10.1002/gcc.20709. [DOI] [PubMed] [Google Scholar]
- 18.Liu H, Brannon AR, Reddy AR, Alexe G, Seiler MW, Arreola A, Oza JH, Yao M, Juan D, Liou LS, et al. Identifying mRNA targets of microRNA dysregulated in cancer: with application to clear cell renal cell carcinoma. BMC Syst. Biol. 2010;4:51. doi: 10.1186/1752-0509-4-51. [DOI] [PMC free article] [PubMed] [Google Scholar]
- 19.Buffa FM, Camps C, Winchester L, Snell CE, Gee HE, Sheldon H, Taylor M, Harris AL, Ragoussis J. microRNA-associated progression pathways and potential therapeutic targets identified by integrated mRNA and microRNA expression profiling in breast cancer. Cancer Res. 2011;71:5635–5645. doi: 10.1158/0008-5472.CAN-11-0489. [DOI] [PubMed] [Google Scholar]
- 20.Wong CF, Tellam RL. MicroRNA-26a targets the histone methyltransferase Enhancer of Zeste homolog 2 during myogenesis. J. Biol. Chem. 2008;283:9836–9843. doi: 10.1074/jbc.M709614200. [DOI] [PubMed] [Google Scholar]
- 21.Nam S, Li M, Choi K, Balch C, Kim S, Nephew KP. MicroRNA and mRNA integrated analysis (MMIA): a web tool for examining biological functions of microRNA expression. Nucleic Acids Res. 2009;37:W356–W362. doi: 10.1093/nar/gkp294. [DOI] [PMC free article] [PubMed] [Google Scholar]
- 22.Xin F, Li M, Balch C, Thomson M, Fan M, Liu Y, Hammond SM, Kim S, Nephew KP. Computational analysis of microRNA profiles and their target genes suggests significant involvement in breast cancer antiestrogen resistance. Bioinformatics. 2009;25:430–434. doi: 10.1093/bioinformatics/btn646. [DOI] [PMC free article] [PubMed] [Google Scholar]
- 23.Subramanian A, Tamayo P, Mootha VK, Mukherjee S, Ebert BL, Gillette MA, Paulovich A, Pomeroy SL, Golub TR, Lander ES, et al. Gene set enrichment analysis: a knowledge-based approach for interpreting genome-wide expression profiles. Proc. Natl Acad. Sci. USA. 2005;102:15545–15550. doi: 10.1073/pnas.0506580102. [DOI] [PMC free article] [PubMed] [Google Scholar]
- 24.Allison DB, Cui X, Page GP, Sabripour M. Microarray data analysis: from disarray to consolidation and consensus. Nat. Rev. Genet. 2006;7:55–65. doi: 10.1038/nrg1749. [DOI] [PubMed] [Google Scholar]
- 25.Goeman JJ, Buhlmann P. Analyzing gene expression data in terms of gene sets: methodological issues. Bioinformatics. 2007;23:980–987. doi: 10.1093/bioinformatics/btm051. [DOI] [PubMed] [Google Scholar]
- 26.Goeman JJ, vande Geer SA, deKort F, van Houwelingen HC. A global test for groups of genes: testing association with a clinical outcome. Bioinformatics. 2004;20:93–99. doi: 10.1093/bioinformatics/btg382. [DOI] [PubMed] [Google Scholar]
- 27.Mansmann U, Meister R. Testing differential gene expression in functional groups. Goeman’s global test versus an ANCOVA approach. Methods Inf. Med. 2005;44:449–453. [PubMed] [Google Scholar]
- 28.Kong SW, Pu WT, Park PJ. A multivariate approach for integrating genome-wide expression data and biological knowledge. Bioinformatics. 2006;22:2373–2380. doi: 10.1093/bioinformatics/btl401. [DOI] [PMC free article] [PubMed] [Google Scholar]
- 29.Lu Y, Zhou Y, Qu W, Deng M, Zhang C. A Lasso regression model for the construction of microRNA-target regulatory networks. Bioinformatics. 2011;27:2406–2413. doi: 10.1093/bioinformatics/btr410. [DOI] [PubMed] [Google Scholar]
- 30.Menezes RX, Boetzer M, Sieswerda M, van Ommen GJ, Boer JM. Integrated analysis of DNA copy number and gene expression microarray data using gene sets. BMC Bioinformatics. 2009;10:203. doi: 10.1186/1471-2105-10-203. [DOI] [PMC free article] [PubMed] [Google Scholar]
- 31.Liu Y, Chu A, Chakroun I, Islam U, Blais A. Cooperation between myogenic regulatory factors and SIX family transcription factors is important for myoblast differentiation. Nucleic Acids Res. 2010;38:6857–6871. doi: 10.1093/nar/gkq585. [DOI] [PMC free article] [PubMed] [Google Scholar]
- 32.Edgar R, Domrachev M, Lash AE. Gene expression omnibus: NCBI gene expression and hybridization array data repository. Nucleic Acids Res. 2002;30:207–210. doi: 10.1093/nar/30.1.207. [DOI] [PMC free article] [PubMed] [Google Scholar]
- 33.Taylor BS, Schultz N, Hieronymus H, Gopalan A, Xiao Y, Carver BS, Arora VK, Kaushik P, Cerami E, Reva B, et al. Integrative genomic profiling of human prostate cancer. Cancer Cell. 2010;18:11–22. doi: 10.1016/j.ccr.2010.05.026. [DOI] [PMC free article] [PubMed] [Google Scholar]
- 34.James DA. RSQLite: SQLite interface for R. 2011. R package version 0.11.1. [Google Scholar]
- 35.Vergoulis T, Vlachos IS, Alexiou P, Georgakilas G, Maragkakis M, Reczko M, Gerangelos S, Koziris N, Dalamagas T, Hatzigeorgiou AG. TarBase 6.0: capturing the exponential growth of miRNA targets with experimental support. Nucleic Acids Res. 2012;40:D222–D229. doi: 10.1093/nar/gkr1161. [DOI] [PMC free article] [PubMed] [Google Scholar]
- 36.Xiao F, Zuo Z, Cai G, Kang S, Gao X, Li T. miRecords: an integrated resource for microRNA-target interactions. Nucleic Acids Res. 2009;37:D105–D110. doi: 10.1093/nar/gkn851. [DOI] [PMC free article] [PubMed] [Google Scholar]
- 37.Hsu SD, Lin FM, Wu WY, Liang C, Huang WC, Chan WL, Tsai WT, Chen GZ, Lee CJ, Chiu CM, et al. miRTarBase: a database curates experimentally validated microRNA-target interactions. Nucleic Acids Res. 2011;39:D163–D169. doi: 10.1093/nar/gkq1107. [DOI] [PMC free article] [PubMed] [Google Scholar]
- 38.Jelier R, Goeman JJ, Hettne KM, Schuemie MJ, den Dunnen JT, ’tHoen PA. Literature-aided interpretation of gene expression data with the weighted global test. Brief. Bioinform. 2011;12:518–529. doi: 10.1093/bib/bbq082. [DOI] [PubMed] [Google Scholar]
- 39.R Development Core Team. R: A Language and Environment for Statistical Computing. R Foundation for Statistical Computing, Vienna, Austria. ISBN 3-900051-07-0. [Google Scholar]
- 40.Goeman JJ, Oosting J. Globaltest: Testing Association of a Group of Genes with a Clinical Variable. 2011. R package version 5.8.1. [Google Scholar]
- 41.Carlson M, Falcon S, Pages H, Li N. org.Mm.eg.db: Genome wide annotation for Mouse. R package version 2.6.4. [Google Scholar]
- 42.RSpecial InterestGroup onDatabases. DBI: R Database Interface. 2009. R package version 0.2-5. [Google Scholar]
- 43.Pages H, Carlson M, Falcon S, Li N. AnnotationDbi: Annotation Database Interface. R package version 1.16.19. [Google Scholar]
- 44.Sean Davis, Paul Meltzer GEOquery: a bridge between the gene expression omnibus (geo) and bioconductor. Bioinformatics. 2007;14:1846–1847. doi: 10.1093/bioinformatics/btm254. [DOI] [PubMed] [Google Scholar]
- 45.Hocking TD. directlabels: Direct labels for multicolor plots in lattice or ggplot2. 2012. R package version 2.6. [Google Scholar]
- 46.Chen H. VennDiagram: Generate high-resolution Venn and Euler plots. 2012. R package version 1.5.1. [Google Scholar]
- 47.Sarkar D. lattice: Lattice Graphics. 2009. R package version 0.17-26. [Google Scholar]
- 48.Care A, Catalucci D, Felicetti F, Bonci D, Addario A, Gallo P, Bang ML, Segnalini P, Gu Y, Dalton ND, et al. MicroRNA-133 controls cardiac hypertrophy. Nat. Med. 2007;13:613–618. doi: 10.1038/nm1582. [DOI] [PubMed] [Google Scholar]
- 49.Townley-Tilson WH, Callis TE, Wang D. MicroRNAs 1, 133, and 206: critical factors of skeletal and cardiac muscle development, function, and disease. Int. J. Biochem. Cell Biol. 2010;42:1252–1255. doi: 10.1016/j.biocel.2009.03.002. [DOI] [PMC free article] [PubMed] [Google Scholar]
- 50.Goljanek-Whysall K, Sweetman D, Munsterberg AE. microRNAs in skeletal muscle differentiation and disease. Clin. Sci. 2012;123:611–625. doi: 10.1042/CS20110634. [DOI] [PubMed] [Google Scholar]
- 51.Tassin AM, Maro B, Bornens M. Fate of microtubule-organizing centers during myogenesis in vitro. J. Cell Biol. 1985;100:35–46. doi: 10.1083/jcb.100.1.35. [DOI] [PMC free article] [PubMed] [Google Scholar]
- 52.Kent WJ. BLAT–the BLAST-like alignment tool. Genome Res. 2002;12:656–664. doi: 10.1101/gr.229202. [DOI] [PMC free article] [PubMed] [Google Scholar]
- 53.Liu B, Li J, Cairns MJ. Identifying miRNAs, targets and functions. Brief. Bioinformatics. 2012 doi: 10.1093/bib/bbs075. Nov 22 (epub ahead of print) [DOI] [PMC free article] [PubMed] [Google Scholar]
- 54.Hassan O, Ahmad A, Sethi S, Sarkar FH. Recent updates on the role of microRNAs in prostate cancer. J. Hematol. Oncol. 2012;5:9. doi: 10.1186/1756-8722-5-9. [DOI] [PMC free article] [PubMed] [Google Scholar]
- 55.Gamazon ER, Im HK, Duan S, Lussier YA, Cox NJ, Dolan ME, Zhang W. ExprTarget: an integrative approach to predicting human microRNA targets. PLoS One. 2010;5:e13534. doi: 10.1371/journal.pone.0013534. [DOI] [PMC free article] [PubMed] [Google Scholar]
- 56.Grimson A, Farh KK, Johnston WK, Garrett-Engele P, Lim LP, Bartel DP. MicroRNA targeting specificity in mammals: determinants beyond seed pairing. Mol. Cell. 2007;27:91–105. doi: 10.1016/j.molcel.2007.06.017. [DOI] [PMC free article] [PubMed] [Google Scholar]
- 57.Tomczak KK, Marinescu VD, Ramoni MF, Sanoudou D, Montanaro F, Han M, Kunkel LM, Kohane IS, Beggs AH. Expression profiling and identification of novel genes involved in myogenic differentiation. JFASEB J. 2004;18:403–405. doi: 10.1096/fj.03-0568fje. [DOI] [PubMed] [Google Scholar]
- 58.Tibshirani R. Regression shrinkage and selection via the lasso. J. R. Stat. Soc. Ser. B. 1996;58:267–288. [Google Scholar]
- 59.Pitman EJG. A note on normal correlation. Biometrika. 1939;31:9–12. [Google Scholar]
- 60.Goeman JJ, Oosting J, Cleton-Jansen AM, Anninga JK, van Houwelingen HC. Testing association of a pathway with survival using gene expression data. Bioinformatics. 2005;21:1950–1957. doi: 10.1093/bioinformatics/bti267. [DOI] [PubMed] [Google Scholar]
- 61.Goeman JJ, van Houwelingen HC, Finos L. Testing against a high-dimensional alternative in the generalized linear model: asymptotic type I error control. Biometrika. 2011;98:381–390. [Google Scholar]
Associated Data
This section collects any data citations, data availability statements, or supplementary materials included in this article.