

Abstract
“Master” transcription factors are the gatekeepers of lineage identity. As such, they have been a major focus of efforts to manipulate cell fate for therapeutic purposes. The ETS transcription factor PU.1 has a potent ability to confer macrophage phenotypes on cells already committed to a different lineage, but how it overcomes the presence of other master regulators is not known. The nuclear receptor peroxisome proliferator-activated receptor γ (PPARγ) is the master regulator of the adipose lineage, and its genomic binding pattern in adipocytes is well characterized. Here we show that, when expressed at macrophage levels in mature adipocytes, PU.1 bound a large fraction of its macrophage sites, where it induced chromatin opening and the expression of macrophage target genes. Strikingly, PU.1 markedly reduced the genomic binding of PPARγ without changing its abundance. PU.1 expression repressed genes with nearby adipocyte-specific PPARγ binding sites, while a common macrophage-adipocyte gene expression program was retained. Together, these data reveal unexpected lability within the adipocyte PPARγ cistrome and show that, even in terminally differentiated cells, PU.1 can remodel the cistrome of another master regulator.
INTRODUCTION
The ability to manipulate cell fate in vitro and in vivo is a rapidly expanding field with clear applications for disease treatment (1). The inherent multipotency of embryonic stem cells (ESCs) and induced pluripotent stem cells (iPSCs) makes them attractive target cells for these approaches. However, many studies have now reported the feasibility of direct conversion of cells from one lineage to another, an approach that is not limited by the low efficiency of iPSC generation or limited availability of ESCs (2, 3). This is most commonly achieved by using fibroblasts, which can be efficiently converted to cardiac myocytes, endothelial cells, hepatocytes, neurons, and macrophages, via the ectopic expression of master regulator transcription factors (4–6). However, other lineages are permissive to transdifferentiation. For instance, pancreatic exocrine cells can be converted to β cells, and hepatocytes can be converted to biliary epithelial cells, all in vivo (7, 8). However, in the majority of cases, the mechanisms underlying loss of parental lineage identity and gain of a new identity are unknown.
Thus far, reprogramming efforts have focused on the manipulation of “master regulator” transcription factors, so called because they are necessary and sufficient for terminal differentiation (9, 10). Several decades of work have established that the ETS family transcription factor PU.1 fulfills these criteria for macrophages (11–13). More recent studies have established PU.1 as a potent reprogramming factor. Specifically, ectopic PU.1 expression in fibroblasts, lymphocyte progenitors, and neuronal progenitors can confer macrophage phenotypes on these cells (14–17). However, little is known about the mechanisms underlying these PU.1-mediated transdifferentiation events. For instance, it is unclear how the genomic landscape of PU.1 binding in converted cells compares to the endogenous PU.1 cistrome in macrophages. Moreover, the effects of PU.1 on recipient cell master regulators are not known, a problem complicated in some cases by the feasibility of performing genome-wide binding studies in rare cell populations such as lymphocyte and neural progenitors. Thus, it remains unknown whether PU.1 interferes with the activity of other lineage-specifying transcription factors during transdifferentiation.
The nuclear receptor peroxisome proliferator-activated receptor γ (PPARγ) promotes commitment to the adipocyte lineage, both in vitro and in vivo (18). It is abundantly expressed in 3T3-L1 cells, a widely used model of adipocyte biology, where chromatin immunoprecipitation followed by deep sequencing (ChIP-seq) has linked the adipogenic functions of PPARγ to its genomic binding (19–22). As for other master regulators, such as PU.1 and MyoD, PPARγ binds to tens of thousands of genomic regions. A major challenge continues to be identifying which of these binding sites (if any) are dispensable and which are critical for the master regulator's role in establishing and maintaining cellular identity. Conditions that destabilize binding of these transcription factors, independently of reduced abundance, are largely unknown. One such context may be transdifferentiation. In cells permissive to lineage conversion, it is possible that changes in master regulator occupancy occur on a global scale. It is also important to consider the fact that some master regulators, like PPARγ, are expressed in multiple lineages (23–27). After adipocytes, PPARγ is most abundantly expressed in macrophages (28–31), but how its binding is regulated to achieve a smaller, largely distinct cistrome from that in adipocytes is unclear.
To explore the relationship between two master regulators, we expressed PU.1 in mature adipocytes and analyzed its genomic occupancy and its effect on the genome-wide binding of endogenous PPARγ. In adipocytes, PU.1 occupied a large fraction of its macrophage binding sites, where it dramatically increased chromatin accessibility. In contrast, PU.1 globally dampened adipocyte PPARγ binding, without a concomitant change in its protein abundance. Destabilization of PPARγ binding resulted in a loss of 75% of its adipocyte binding regions but the maintenance of a robust set of several thousand sites. These core PPARγ binding sites were enriched for proximity to genes involved in adipogenic differentiation and metabolic functions and, importantly, were also enriched for overlap with PPARγ binding in adipose tissue in vivo. We observed increased PU.1 occupancy at highly induced genes and decreased PPARγ occupancy at highly repressed genes. Interestingly, not all PPARγ target genes were repressed; expression of genes common to adipocytes and macrophages was preserved and was linked to cooccupancy of PPARγ and PU.1. Taken together, these results reveal an unexpected instability of PPARγ binding in mature adipocytes and suggest that PU.1 favors reprogramming via interfering with genomic binding of other master regulators.
MATERIALS AND METHODS
Cell culture and differentiation.
3T3-L1 preadipocytes (American Type Culture Collection) were grown to confluence, followed by differentiation induction with growth medium containing 1 μM dexamethasone, 0.5 mM 3-isobutyl-1-methylxanthine, and 10 μg/ml insulin (all from Sigma). Adipocytes were considered mature after 7 days and when >95% of cells showed adipocyte morphology. Growth medium consisted of Dulbecco's modified Eagle medium with 25 mM glucose, 10% fetal bovine serum (U.S. Biotechnologies), 100 units/ml penicillin, and 100 μg/ml streptomycin (GIBCO).
Animals.
Wild-type male C57BL/6 mice were obtained from Jackson Laboratory and maintained on a standard diet with 12 h-light/12 h-dark (LD) cycles for at least 2 weeks. Twelve-week-old mice were euthanized at Zeitgeber time 10 (ZT10; equivalent to 5:00 p.m.) for experiments, all of which were performed at the University of Pennsylvania according to protocols approved by the Institutional Animal Care and Use Committee.
Adenoviral cloning and infections.
An expression construct containing full-length murine Pu.1 cDNA (NM_011355) was a kind gift from Michael Atchison (University of Pennsylvania). PCR cloning was used to add a SalI restriction site to the 5′ end of the Pu.1 cDNA, followed by a FLAG tag to the N terminus of PU.1 and an EcoRV restriction site at the 3′ end of the Pu.1 cDNA. FLAG-PU.1 was ligated into the pENTR2b vector, followed by recombination with the adenoviral construct pAd/CMV/V5-DEST. The control adenovirus pAd/CMV/V5-GW/lacZ/was also generated (all vectors were from Invitrogen). Crude viral lysates were obtained by transfection of 293A cells with viral DNA followed by large-scale amplification and purification (University of Pennsylvania Vector Core). For adipocyte infections, purified adenoviruses were incubated in low-serum medium (growth medium with 0.5% fetal bovine serum [FBS]) containing 0.5 μg/ml poly-l-lysine for 2 h at 25°C. Adipocytes were washed once with PBS and then incubated with adenovirus (5 ml of diluted virus per 10-cm dish). After 4 h, additional low-serum medium was added (5 ml per 10 cm dish). After 16 h, low-serum medium was replaced with growth medium, and cells were incubated under standard conditions until harvest (24 to 72 h postinfection).
Chromatin immunoprecipitation (ChIP). (i) 3T3-L1 adipocytes.
Nuclei were extracted by probe sonication in hypotonic lysis buffer (20 mM HEPES, 3 mM MgCl2, 250 mM sucrose, 0.2% NP-40, 3 mM beta-mercaptoethanol) followed by three washes of nuclei in this buffer. Nuclear lysis and ChIP were performed as previously described (19) using 3 μl of anti-CTCF serum (07-729; Millipore) or 10 μg of the following antibodies: anti-PPARγ (sc7196x), anti-PU.1 (sc352x), and anti-retinoid X receptor α (anti-RXRα; sc553x), all from Santa Cruz. For preparation of sequencing libraries, purified DNA from three ChIPs per condition or one matching input was used. For ChIP followed by quantitative PCR, amplicons were detected using Power SYBR green PCR master mix (Applied Biosystems). Analysis was performed using the standard curve method, and all enrichments were calculated by comparing the relative abundance of a genomic region in the ChIP fraction to its abundance in the input (% IP/input). Primer sequences used for quantitative PCR (qPCR) analysis are listed in Table S1 in the supplemental material.
(ii) Murine epididymal adipose tissue.
Mice were euthanized at ZT10 (5 p.m.), and tissue was harvested immediately, quickly minced, and cross-linked in 1% formaldehyde for 20 min, followed by quenching with 1/20 volume of 2.5 M glycine solution and two washes with PBS. Cell lysates with fragmented chromatin were prepared by probe sonication in ChIP dilution buffer (50 mM HEPES, 155 mM NaCl, 1.1% Triton X-100, 0.11% sodium deoxycholate, 0.1% SDS, 1 mM phenylmethylsulfonyl fluoride [PMSF], and a Complete protease inhibitor tablet [pH 7.5]). ChIP was performed as previously described (19) using 10 μg of anti-PPARγ antibody. For ChIP-seq, material from three to four mice was pooled prior to library generation.
Formaldehyde-assisted isolation of regulatory elements (FAIRE).
Nuclear extraction and sonication were performed on adipocyte samples as described above for ChIP. Chromatin preparations were processed as described previously (11), and enrichment for genomic regions was assessed by qPCR using the same primers as for ChIP-qPCR.
ChIP-seq.
ChIP DNA was prepared for sequencing according to the amplification protocol provided by Illumina. For 3T3-L1 cells, ChIP and input libraries were generated from two independent biological replicates. Sequence reads of 36 bp (first replicate sequenced on GAIIx; Illumina) and 50 bp (second replicate sequenced on HiSeq; Illumina) were obtained using the Solexa analysis pipeline and mapped to the mouse genome (UCSC mm9) using Bowtie (version 0.12.8). Mapped reads had no more than two mismatches in their first 27 bp, and redundant reads mapping to the same 5′ position were removed. Reads from both replicates were pooled prior to peak calling using the FindPeaks algorithm (default settings for transcription factor ChIP-seq, --factor settings; false discovery rate [FDR], 0.1%) in the HOMER software suite (v3.15) (32). For adipose tissue, sequence reads were processed (mapped to UCSC mm8) and peaks called using HOMER as described above. This PPARγ cistrome as well as the cistromes for macrophage PPARγ and PU.1 (generated in the study described in reference 11) were converted from mm8 to mm9 coordinates using the LiftOver utility in the UCSC Genome Browser. ChIP-seq stack height profiles were generated in HOMER using default parameters and visualized using the Integrative Genomics Viewer (33).
Cistromic analysis.
For de novo motif analysis, a random set of matched controls with similar distances to the nearest transcriptional start site (TSS) was generated for all adipocyte PPARγ binding regions using CisGenome (34). Motif finding was then performed in HOMER (32) for 200-bp regions around peak centers, using the matched controls as background with masking of all repeat elements. Overlap analyses were performed using the Cistrome Venn diagram tool (35), where overlapping binding regions had ≥1 bp in common. Functional annotation enrichment was performed using GREAT, with default settings (36).
Quantification of ChIP-seq signals presented in boxplots and scatterplots was performed by determining the maximum peak height (number of reads at peak, per million mapped reads) of each binding region in both LACZ- and PU.1-Ads. For the scatterplot of PPARγ ChIP-seq data using normalized reads per million, the height of each peak was normalized to the sum of reads in all peaks (37). For lost PPARγ peaks in PU.1-Ads, the corresponding genomic regions were treated as arbitrary peaks, and peak height normalization was performed using the sum of reads in both called peaks and arbitrary peaks. For histograms of ChIP-seq signals showing “rpm at each base,” the number of sequencing reads stacked at each base position in a peak was calculated using Bedtools (version 2.16.2). Peaks near the same set of genes (e.g., induced, repressed, or unchanged genes) were aligned, and the number of stacked reads at each base was averaged and normalized to the total number of reads. Mapping of PPARγ and PU.1 binding sites to genes was carried out in HOMER. Each binding site was assigned to its closest TSS with a distance cutoff of 50 kb. Mapped binding sites were then divided by the total number of genes in each subset to obtain the number of peaks per gene. The enrichment in peaks per gene of a test set (induced, repressed, or unchanged genes) compared to a control set (randomly selected RefSeq genes) is presented as the binding score in Fig. 5 to 7.
Fig 5.
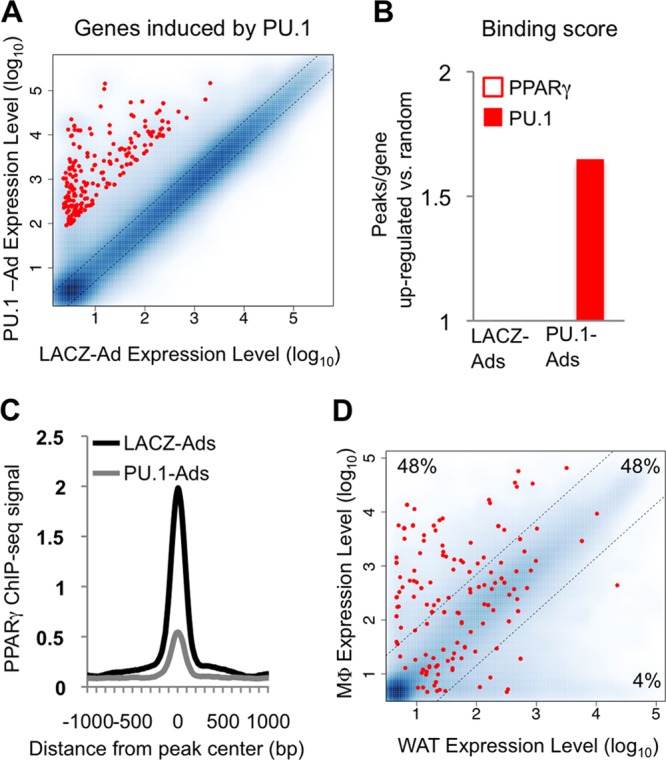
PU.1 occupancy is associated with activation of macrophage genes in adipocytes. The top 300 genes upregulated by PU.1 in adipocytes were analyzed. (A) Scatterplot showing the relative expression level of each gene (red dots) in PU.1-Ads versus LACZ-Ads compared to all genes on the microarray (blue dots). Expression levels represent normalized signal intensity. (B) Binding scores for the upregulated gene set reflect the average number of PPARγ and PU.1 binding sites, relative to 300 randomly selected RefSeq genes (TSS ± 50 kb). (C) Average profile of the PPARγ ChIP-seq signal around PPARγ binding sites located near upregulated genes (TSS ± 50 kb). (D) Scatterplot showing the normalized expression level of each gene in macrophages and white adipose tissue. A 7-fold difference in expression level was used to generate macrophage-specific, common, and adipocyte-specific subsets. The percentage of genes in each category is shown.
Fig 7.
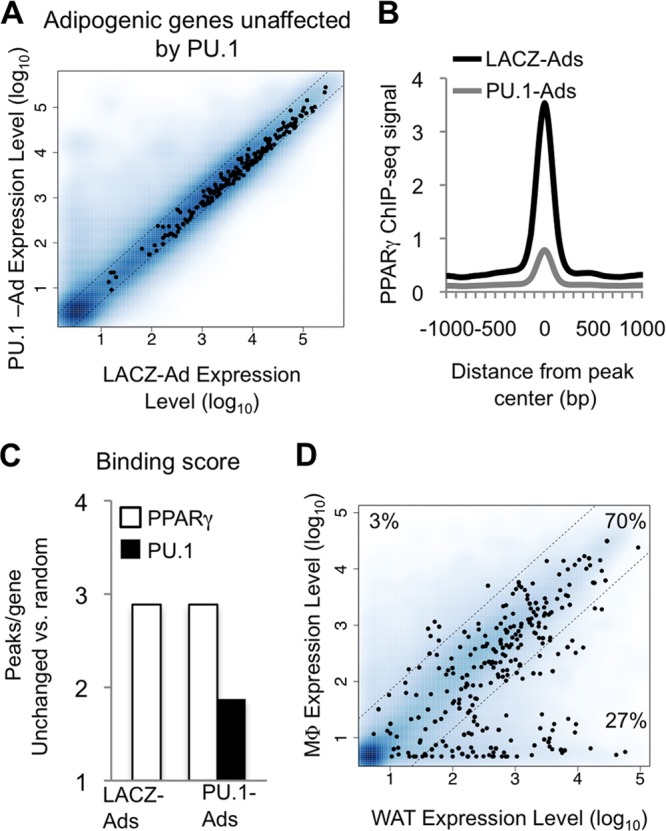
Genes unchanged by PU.1 in adipocytes reflect a common macrophage-adipocyte gene expression program. A total of 249 PPARγ target genes unaffected by PU.1 (see Materials and Methods) were analyzed. (A) Scatterplot showing the relative expression level of each gene (black dots) in PU.1-Ads versus LACZ-Ads compared to all genes on the microarray (blue dots). (B) Average profile of the PPARγ ChIP-seq signal around PPARγ binding sites located near unchanged genes (TSS ± 50 kb). (C) Binding scores for the unchanged gene set reflect the average number of PPARγ and PU.1 binding sites, relative to 300 randomly selected RefSeq genes (TSS ± 50 kb). (D) Scatterplot showing the normalized expression level of each gene in macrophages and white adipose tissue. A 7-fold difference in expression level was used to generate macrophage-specific, common, and adipocyte-specific subsets. The percentage of genes in each category is shown.
RNA isolation, microarrays, and reverse transcription-quantitative PCR (RT-qPCR).
Total RNA was isolated from adipocytes using TRIzol (Invitrogen) followed by purification with the RNeasy minikit (Qiagen). For the microarray, 5 μg of RNA was amplified and labeled using a low-input Quick Amp labeling kit (Agilent) and hybridized to the SurePrint G3 mouse GE 8x60K array (Agilent). Differential gene expression was determined using the SAM algorithm (38) with cutoffs of an FDR of <5% and a change of ≥2-fold. Highly upregulated and downregulated genes were defined as the top 300 genes ranked by fold change in PU.1-Ads/LACZ-Ads or LACZ-Ads/PU.1-Ads, respectively. The number 300 was chosen to match the number of unchanged genes analyzed. These were defined as PPARγ target genes based on their upregulation during differentiation of 3T3-L1 cells (≥5-fold) and downregulation after PPARγ knockdown in mature 3T3-L1 cells (≥2-fold) (39). As a control gene set, 1,500 RefSeq genes were randomly selected from the murine genome. For RT-qPCR, 1 μg of purified RNA and random hexamer primers were used to generate cDNA according to the manufacturer's instructions (Applied Biosystems). qPCR analysis was performed using primers listed in Table S2 in the supplemental material, and amplicons were detected with Power SYBR green master mix (Applied Biosystems). Relative expression levels for genes of interest were determined by the standard curve method followed by normalization to the housekeeping gene Rplp0.
Immunoblotting.
Whole-cell lysates were separated in 10% SDS-polyacrylamide gels and transferred to polyvinylidene difluoride membrane. After incubation with the primary antibodies for PPARγ (sc-7273), PU.1 (sc-352), RXRα (sc-553; all from Santa Cruz), HSP90 (4874S; Cell Signaling), or RAN (610340; BD Transduction Laboratories), a secondary horseradish peroxidase-conjugated antibody (Sigma) was added, and an enhanced chemiluminescent substrate kit (PerkinElmer Western Lightning) was used for detection.
Statistical analysis.
For relative mRNA expression levels, values are expressed as means ± standard errors of the means (SEM) and represent six independent experiments. For ChIP-qPCR enrichment levels, values are expressed as means ± SEM and represent four independent experiments. Statistical significance was determined using two-way analysis of variance (ANOVA).
Data accession number.
Microarray and ChIP-seq data have been deposited in the Gene Expression Omnibus and are available under the accession number GSE48345.
RESULTS
Functional expression of PU.1 in adipocytes.
Ectopic expression of PU.1 in progenitor cells of different lineages and committed fibroblasts is sufficient to activate a macrophage gene expression program (14–16). To determine the effects of ectopic PU.1 expression on the distantly related adipocyte lineage, we infected mature 3T3-L1 adipocytes (day 7) with recombinant adenoviruses expressing full-length, FLAG-tagged PU.1 or beta-galactosidase as a control (referred to as PU.1-Ads and LACZ-Ads, respectively). At 72 h postinfection, we observed levels of ectopic PU.1 mRNA and protein in adipocytes comparable to those found endogenously in macrophages (Fig. 1A and B). This was true for macrophages from the peritoneal cavity (Fig. 1A) and bone marrow (Fig. 1B). It should be noted that we are routinely unable to detect PPARγ in bone marrow-derived macrophages (Fig. 1B). Expression of PU.1 in mature adipocytes for 72 h had a minimal effect on the expression of PPARγ1 and -γ2 isoforms in four of six experiments; in the other two experiments, PPARγ protein levels decreased 10 to 50% (see Fig. S1A in the supplemental material). Similar results were observed for RXRα, the obligate heterodimer partner for PPARγ (40) (see Fig. S1B in the supplemental material). In order to determine whether PU.1 could interfere with the genomic binding of PPARγ independently of changes in its expression, we determined PPARγ protein levels for each experiment and performed downstream analyses only on samples from experiments where PPARγ levels were not decreased.
Fig 1.
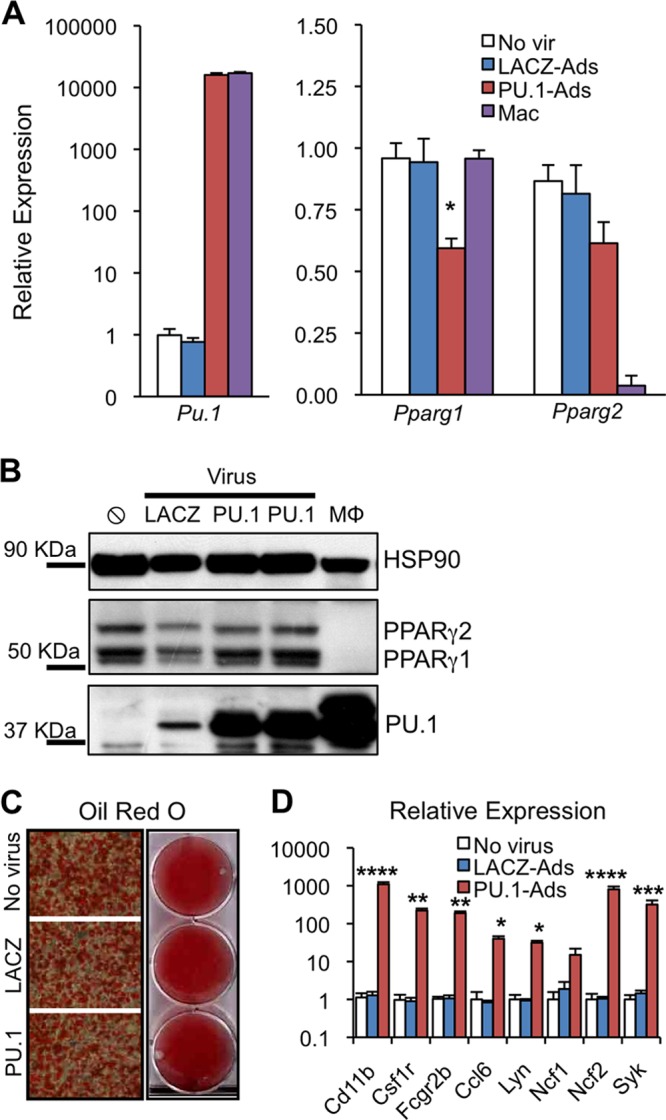
Functional expression of PU.1 in adipocytes. (A) RT-qPCR gene expression analysis of ectopic Pu.1 and endogenous Pparg1 and Pparg2 in mature 3T3-L1 adipocytes. Cells were harvested 72 h after infection with adenovirus expressing Pu.1 cDNA (PU.1-Ads) or beta-galactosidase (LACZ-Ads) or after mock infection (no vir). Levels of ectopic Pu.1 were compared to the endogenous level in peritoneal macrophages (MΦ). Values were normalized to that for the housekeeping gene Arbp and are shown relative to the no-virus control (mean ± SEM, n = 6; *, P < 0.05). (B) Immunoblot analysis comparing levels of ectopic PU.1 in adipocytes with endogenous PU.1 in bone marrow MΦs. PU.1-Ads and LACZ-Ads were harvested at 72 h after viral infection. Lysates from PU.1-Ads represent the two experiments used for ChIP-seq analyses. (C) Oil Red O staining of neutral lipid in LACZ-Ads and PU.1-Ads compared to mock-infected adipocytes. (D) RT-qPCR gene expression analysis of PU.1 target genes in LACZ-Ads and PU.1-Ads, compared to mock-infected adipocytes, as in panel A (mean ± SEM, n = 6; ****, P < 0.0001; ***, P < 0.001; **, P < 0.01; *, P < 0.05).
Though PU.1 has been expressed in many different cell types (14–17), to our knowledge this is the first attempt at expressing PU.1 in terminally differentiated, postmitotic cells. Therefore, we carefully evaluated its functionality in adipocytes in comparison to that in macrophages. PU.1 did not affect adipocyte morphology or lipid accumulation as determined by Oil Red O staining of neutral lipids (Fig. 1C). PU.1 did robustly activate several of its known target genes, including Itgam/Cd11b, Csf1r, Fcgr2b, Ccl6, Lyn, Ncf2, and Syk (Fig. 1D). Taken together, these results show that PU.1, a master hematopoietic regulator, can be functionally expressed in mature adipocytes.
PU.1 expression in adipocytes is not sufficient to direct PPARγ to its macrophage-specific binding sites.
Genome-wide binding analysis using chromatin immunoprecipitation followed by deep sequencing (ChIP-seq) identified 40,922 PU.1 peaks in adipocytes, similar to the number previously found in macrophages (11, 32). There was a high degree of overlap between the PU.1 cistromes in these two cell types, with ∼40% of macrophage PU.1 sites also bound in adipocytes and vice versa (Fig. 2A). We performed de novo motif analysis around PU.1 binding sites unique to macrophages, adipocytes, or shared between them, but did not find coenriched motifs unique to either cistrome (see Fig. S2 in the supplemental material). Robust PU.1 binding was observed proximal to the transcription start sites (TSS) of its highly induced target genes Itgam/Cd11b, Csf1r, and Fcgr2b (Fig. 2B and C). Using formaldehyde-assisted isolation of regulatory elements (FAIRE), we found dramatically increased chromatin accessibility at these genes in PU.1-Ads (Fig. 2D), supporting the conclusion that PU.1 has the ability to alter the adipocyte genomic landscape.
Fig 2.
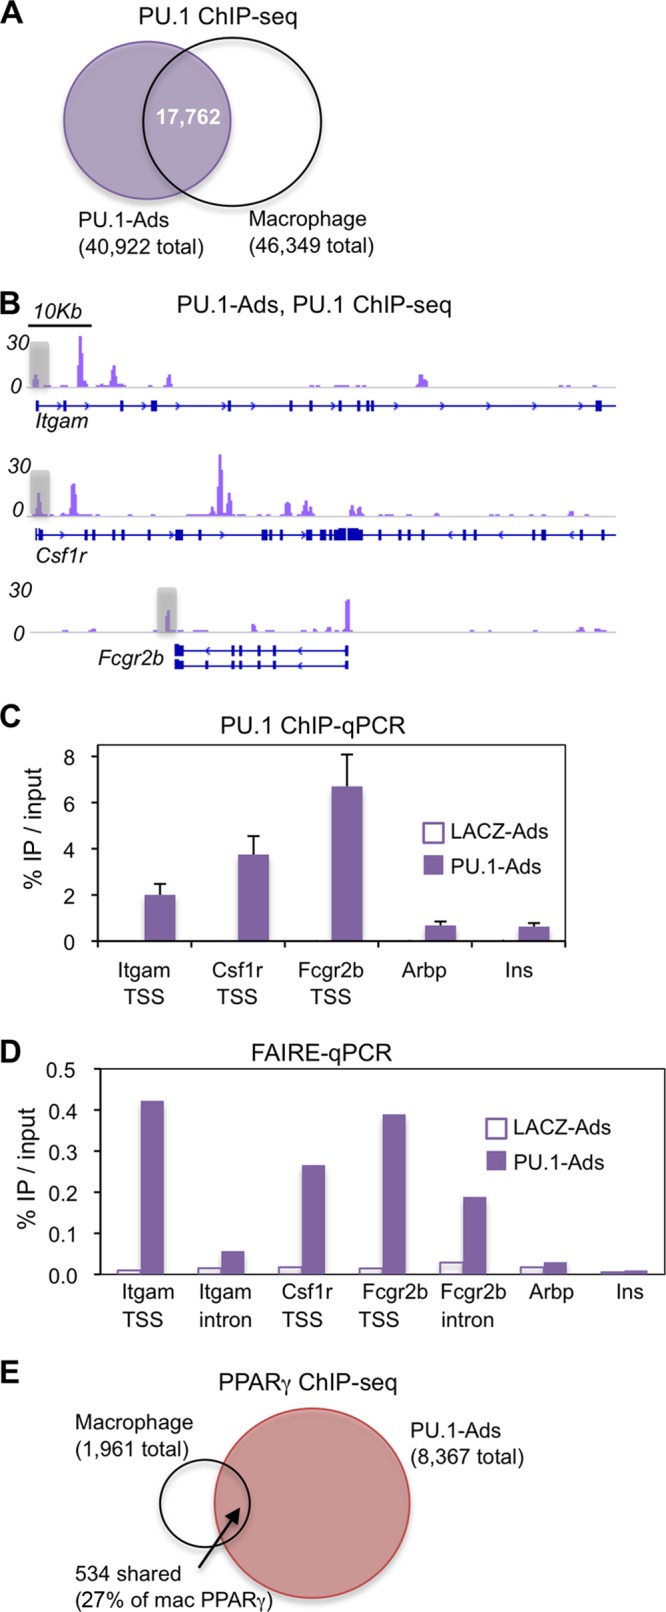
PU.1 binds robustly to macrophage-specific sites in adipocytes but fails to recruit PPARγ. (A) Venn diagram representing the overlap of PU.1 peaks in adipocytes with those in macrophages (at least 1 bp in common). (B) ChIP-seq stack height profiles of PU.1 peaks in adipocytes at three known macrophage PU.1 target genes. PU.1 peaks at the TSS of each gene were confirmed by ChIP-qPCR (see panel C). (C) ChIP-qPCR analysis of PU.1 enrichment in PU.1-Ads at the three genomic regions highlighted in panel B. Regions within the Arbp and insulin genes were used as negative-control sites (n = 4, mean ± SEM). ChIP for PU.1 in LACZ-Ads detected nonspecific binding of the PU.1 antibody at a level of 0.05 to 0.1%. (D) FAIRE-qPCR at the TSS and first intron of the PU.1 target genes shown in panel B (n = 1). (E) Venn diagram showing the overlap of PPARγ peaks in macrophages with PPARγ peaks in PU.1-Ads. The sharing of 27% of macrophage PPARγ peaks with adipocytes is roughly equivalent to what was found for adipocytes that do not express PU.1 (11).
During lineage conversion of one cell type into another, the genomic binding of transcription factors common to both lineages may be redirected by reprogramming factors such as PU.1. In macrophages, PPARγ binds to ∼2,000 sites, of which approximately 25% are shared with adipocytes (11). The remaining macrophage-unique PPARγ binding sites are highly enriched for colocalized PU.1, suggesting that expressing PU.1 in adipocytes may be sufficient to direct PPARγ to its macrophage binding sites. In contrast, however, overlap of PPARγ sites in macrophages with PPARγ sites in PU.1-Ads was 27% (Fig. 2E), approximately equivalent to the overlap in adipocytes without PU.1 (11), indicating that expressing PU.1 in adipocytes is insufficient to drive PPARγ to its macrophage-unique binding sites. Notably, PU.1 occupied many of these sites in adipocytes (see Fig. S3A in the supplemental material), but its average binding strength was lower than that in macrophages (see Fig. S3B and C in the supplemental material). Taken together, these results suggest that (i) PU.1 alone is not sufficient to establish the macrophage PPARγ cistrome and (ii) a certain threshold of PU.1 occupancy is required to facilitate macrophage PPARγ binding at sites where the two factors colocalize in macrophages.
PU.1 globally dampens the genomic binding of PPARγ.
We next compared PPARγ binding between PU.1-Ads and control LACZ-Ads. Peak-calling analysis identified ∼40,000 PPARγ binding sites in LACZ-Ads, a number on a par with recent findings for adipocyte PPARγ (22). Moreover, these peaks show strong concordance with those in our initial report of the 3T3-L1 PPARγ cistrome (19); additional sites are likely due to improved ChIP efficiency and increased sequencing depth (see Fig. S4 in the supplemental material). After expression of PU.1, PPARγ bound to a small number of new sites. These were weak PPARγ peaks that had little overlap with the macrophage PPARγ cistrome, consistent with the inability of PU.1 to recruit PPARγ (data not shown). Remarkably, PU.1 expression led to the surprising loss of ∼75% (34,118) of adipocyte PPARγ peaks (Fig. 3A). Examples of retained and lost PPARγ peaks are shown in Fig. 3B, where PPARγ binding is visualized as stack height profiles on the genome. The retention and loss of PPARγ binding sites was confirmed using ChIP-qPCR, where retained sites were enriched an average of 9-fold compared with negative-control sites (Arbp and Ins), while lost regions had an average enrichment of 2-fold, with most sites being at background levels (Fig. 3C). A similar binding pattern was observed for RXRα (Fig. 3D), indicating interference with binding of the heterodimer complex by PU.1.
Fig 3.

PU.1 globally dampens adipocyte PPARγ genomic binding. (A) Venn diagram representing the overlap between PPARγ peaks in LACZ-Ads and PU.1-Ads (at least a 1-bp overlap). The data show that 75% of adipocyte PPARγ peaks are lost after expression of PU.1. (B) Genome browser tracks showing PPARγ ChIP-seq stack height profiles in LACZ- and PU.1-Ads, at examples of lost and retained sites verified by ChIP-qPCR (see panels C and D). (C) ChIP-qPCR analysis of PPARγ enrichment at five retained (a to e) and five lost (f to j) sites in LACZ- and PU.1-Ads. Regions in the Arbp and insulin genes were used as negative-control sites (n = 4, mean ± SEM; ****, P < 0.0001; ***, P < 0.001; **, P < 0.01; *, P < 0.05). In PU.1-Ads, the average change over negative-control sites was 9-fold for retained PPARγ peaks, compared to 2-fold for lost PPARγ peaks. (D) ChIP-qPCR analysis of RXRα enrichment as in panel C. (E) Boxplot of ChIP-seq data showing heights of lost and retained PPARγ peaks in LACZ-Ads (rpm, reads per million). (F) Quantitative analysis of PPARγ ChIP-seq signal. Scatterplot of the maximum stack height at each PPARγ peak, color coded based on whether each peak was called only in LACZ-Ads (lost) or in both LACZ- and PU.1-Ads (retained).
Overall, the strength of PPARγ binding was considerably greater at “retained” sites than at “lost” sites in the control adipocytes (Fig. 3E), suggesting that PU.1 expression mediated a global dampening of PPARγ binding rather than a selective loss of the weaker PPARγ peaks. Indeed, quantitative comparison of the binding strength at all PPARγ sites demonstrated a global reduction in PPARγ binding, with the vast majority of all lost and retained sites exhibiting diminished binding strength in the presence of PU.1 (Fig. 3F). On average, binding strength (as represented by peak height) was equivalently diminished at lost and retained PPARγ regions (see Fig. S5A in the supplemental material), further supporting a global, PU.1-mediated decrease in PPARγ binding. In addition, we performed a normalization of ChIP-seq peak strength to reads under peaks for each sample and repeated the quantitative analysis using these values (see Fig. S5B in the supplemental material). All PPARγ sites were “pulled” toward the line of unity in this analysis, confirming that the diminishment of PPARγ binding occurred globally in adipocytes expressing PU.1. Importantly, this pruning of the PPARγ cistrome occurred without a detectable decrease in either PPARγ protein levels (Fig. 1B) or general “ChIP-ability” of DNA binding proteins in PU.1-Ads, as CTCF occupancy was comparable between LACZ- and PU.1-Ads (see Fig. S6 in the supplemental material). Taken together, these data show that diminishment of adipocyte PPARγ binding by PU.1 expression occurs at the vast majority of sites, and its retention at a core set of sites is associated with greater baseline binding strength.
PU.1-mediated pruning of the adipocyte PPARγ cistrome preserves core sites proximal to adipogenic genes and bound in adipose tissue in vivo.
Thus far, we have shown that PU.1 expression effectively segregated the adipocyte PPARγ cistrome into two subsets—weaker binding sites completely destabilized after PU.1 expression (lost subset) and stronger binding sites partially destabilized after PU.1 expression (retained subset). It should be noted that the known PPARγ-RXR (DR1) motif was the best match to the most highly enriched de novo motif found in both lost and retained PPARγ subsets. Moreover, it was represented with approximately equivalent frequencies in both sets of binding regions (see Fig. S7A in the supplemental material). Given that a number of transcription factors have been found to colocalize with PPARγ in adipocytes (22, 41, 42), it was possible that PU.1 acted through a cooperating factor to destabilize PPARγ binding. Therefore, we performed de novo motif analysis within a 200-bp region around the center of the 8,367 strongest lost PPARγ binding regions (based on their peak height at baseline), searching for motifs differentially enriched relative to the 8,367 retained PPARγ sites. This analysis identified the PPAR-RXR (DR1) and C/EBP motifs as the most significantly enriched in both the lost and retained PPARγ subsets (Fig. 4A and B), consistent with previous studies reporting extensive colocalization of these factors in 3T3-L1 adipocytes (19, 21). Other highly enriched de novo motifs, including NFIC, AP-1, and EBF, were also nearly equally prominent in both the lost and retained subsets (Fig. 4A and B; also, see Fig. S7B in the supplemental material), providing no indication that PU.1 acted through another transcription factor present selectively at lost or retained PPARγ binding sites.
Fig 4.

PU.1 pruning of the adipocyte PPARγ cistrome preserves sites proximal to adipogenic genes and bound in adipose tissue. The lost subset of PPARγ peaks is enriched for weaker peaks and contains four times the number of peaks as the retained subset (Fig. 3). To facilitate downstream comparison between lost and retained subsets, we normalized their number by selecting the 8,367 strongest lost PPARγ peaks (by height) for the analyses shown in panels A to D. (A) De novo motif analysis of 200-bp regions around the centers of lost PPARγ peaks. The top five de novo motifs for each subset are shown, ranked by P value. (B) De novo motif analysis for the retained PPARγ peaks, as for panel A. The complete list of motifs for each subset is shown in Fig. S4 in the supplemental material. (C) GREAT analysis of enriched functional annotations associated with lost and retained PPARγ peaks. Results are from the PANTHER Pathway Commons database. (D) Comparison of the number of 3T3-L1 PPARγ peaks in each subset which have a corresponding PPARγ binding site in vivo in white adipose tissue (at least a 1-bp overlap). The P value was computed using a hypergeometric test. (E) Comparison of the percentage of 3T3-L1 PPARγ peaks in each subset that has a corresponding PPARγ binding site in vivo.
To further explore the effects of PU.1 on the adipocyte PPARγ cistrome, we used the Genomic Region Enrichment of Annotations tool (GREAT) (36) to determine whether the lost and retained PPARγ binding sites were associated with distinct sets of genes. Notably, the retained PPARγ regions were highly associated with genes involved in adipocyte differentiation, with the two most significantly enriched terms being “metabolism of lipids and lipoproteins” and “transcriptional regulation of white adipocyte differentiation” (Fig. 4C). Overall, for the retained PPARγ sites, 8 of 10 enriched functional annotation terms were related to adipocyte biology, whereas only 2 of 10 pathways enriched in the lost PPARγ regions were adipocyte related (Fig. 4C). This is consistent with the stronger binding of PPARγ in adipocytes at sites that are retained even in the presence of PU.1.
The functional annotation analysis suggested that PPARγ binding sites which are resistant to the full destabilizing effects of PU.1 could be those critical to the regulation of adipocyte fate and function. If so, we might expect the retained subset to be more enriched than the lost subset for overlap with PPARγ binding sites in vivo. To test this, we performed PPARγ ChIP-seq analysis in murine epididymal white adipose tissue (eWAT). Using the same peak-calling parameters as for 3T3-L1 cells, we identified approximately 26,000 PPARγ binding sites in eWAT (1-rpm cutoff). Comparing an equivalent number of lost and retained regions (8,367) revealed approximately 3,000 more PPARγ binding sites within the retained subset that had a corresponding PPARγ binding site in eWAT (Fig. 4D). Overall, in vivo overlap accounted for 80% of retained 3T3-L1 PPARγ binding sites and only 50% of lost sites (Fig. 4E). Moreover, the overlap between lost sites and PPARγ binding sites in eWAT in vivo decreased to ∼30% when all 34,118 lost PPARγ regions were used (data not shown). Together, these data suggest that PPARγ binding sites remaining after PU.1 expression represent a core set of genomic regions highly enriched for proximity to adipogenic genes and bound by PPARγ in adipose tissue in vivo.
In adipocytes, PU.1 binding marks highly induced macrophage-specific genes, while diminished PPARγ binding marks highly repressed white adipose tissue-specific genes.
To determine how adipocyte gene expression is altered by PU.1 activity, we performed microarray analysis of LACZ- and PU.1-Ads, concomitant with our ChIP-seq studies. In adipocytes, 2,272 genes were upregulated after PU.1 expression. We selected the top 300 upregulated genes (Fig. 5A, red dots) for analysis of transcription factor binding. At genomic regions proximal to these highly induced genes, we observed strong enrichment for PU.1 binding (Fig. 5B). In contrast, PPARγ binding was not enriched compared to random control genes, and its binding strength was decreased (Fig. 5C), suggesting that PU.1 was the major driver of this gene expression program. If so, this gene set should be enriched for a macrophage-specific expression signature. To test this, we used publicly available data from large-scale expression profiling of murine tissues (43). Comparing the relative mRNA level of each PU.1-induced gene between primary macrophages and white adipose tissue generated three clusters: macrophage-specific, white adipose tissue-specific, and common genes (Fig. 5D, three regions of scatterplot delineated by dotted lines). PU.1 activated very few white adipose tissue-specific genes (Fig. 5D, 4% cluster). Rather, PU.1 preferentially induced macrophage genes, approximately half of which were shared with adipose tissue and half of which were macrophage specific (Fig. 5D, 48% clusters), consistent with the role of PU.1 as a master regulator of the macrophage phenotype.
We then analyzed the 300 most highly repressed genes (Fig. 6A, green dots). In contrast to induced genes, there was no enrichment for nearby PU.1 binding (Fig. 6B). Rather, PPARγ preferentially occupied these genes, both before and after PU.1 expression (Fig. 6B). Notably, the average binding strength of PPARγ peaks was decreased in PU.1-Ads (Fig. 6C), consistent with the global decrease in PPARγ binding in this setting. When we analyzed these genes for tissue-specific expression (Fig. 6D), we found very few macrophage-specific genes (Fig. 6D, 6% cluster). Instead, approximately half of the genes were shared between adipose tissue and macrophages and the other half were white adipose tissue specific (Fig. 6D, 43% and 51% clusters, respectively). Since PU.1 binding is not enriched at these genes, it is likely that the loss of PPARγ occupancy is responsible, at least in part, for the repression of this adipose tissue-enriched gene set. Taken together, these data reveal that in adipocytes, PU.1 can promote a macrophage gene expression program while simultaneously suppressing PPARγ-driven adipose tissue genes.
Fig 6.
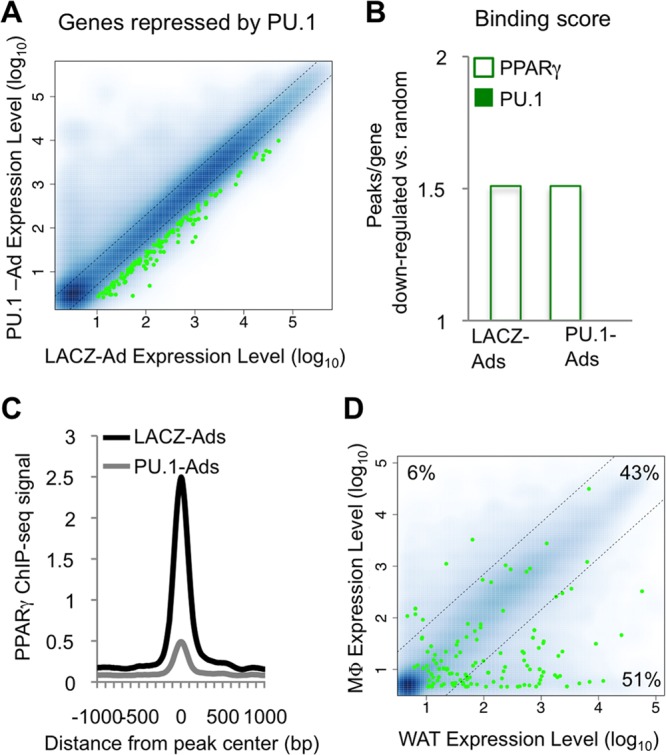
Genes repressed by PU.1 in adipocytes reflect an adipocyte gene expression program. The top 300 genes downregulated by PU.1 in adipocytes were analyzed. (A) Scatterplot showing the relative expression level of each gene (green dots) in PU.1-Ads versus LACZ-Ads compared to all genes on the microarray (blue dots). (B) Binding scores for the downregulated gene set reflect the average number of PPARγ and PU.1 binding sites, relative to 300 randomly selected RefSeq genes (TSS ± 50 kb). (C) Average profile of the PPARγ ChIP-seq signal around PPARγ binding sites located near downregulated genes (TSS ± 50 kb). (D) Scatterplot showing the normalized expression level of each gene in macrophages and white adipose tissue. A 7-fold difference in expression level was used to generate macrophage-specific, common, and adipocyte-specific subsets. The percentage of genes in each category is shown.
Genes unchanged by PU.1 in adipocytes reflect a common macrophage-white adipose tissue gene expression program.
Though decreased PPARγ occupancy correlated with gene repression in PU.1-Ads, we noticed that expression of certain well-known PPARγ target genes, such as Cd36, Cebpa, and Fabp4, was not affected. To further explore this, we generated a list of PPARγ target genes defined by (i) upregulation during 3T3-L1 adipogenesis and (ii) downregulation after PPARγ knockdown in mature 3T3-L1 adipocytes (39). Approximately 370 genes met these criteria. Notably, expression of the majority of these genes (60%, 249) was unaffected by PU.1 in adipocytes (Fig. 7A, black dots; also, see Fig. S8A in the supplemental material). Consistent with its global trend, PPARγ binding strength was diminished at binding sites proximal to these genes (Fig. 7B), though its occupancy was enriched compared to that of randomly selected genes (Fig. 7C, white bars). Interestingly, these genes were also enriched for nearby binding of PU.1 (Fig. 7C, black bar), indicating that PU.1 may be able to activate them in adipocytes. To test this, we depleted PPARγ from adipocytes and then expressed PU.1. However, PU.1 was unable to rescue the expression of these genes (data not shown), suggesting that cooccupancy of both factors is required for their regulation.
The cooccupancy of PU.1 and PPARγ at these genes suggested marking of a shared adipocyte-macrophage gene expression program. Indeed, very few of these genes were macrophage or white adipose tissue specific (Fig. 7D, 3% and 27% clusters, respectively); rather, the majority showed a common expression profile between primary macrophages and white adipose tissue (Fig. 7D, 70% cluster). These included novel putative PU.1/PPARγ target genes involved in fatty acid metabolism, such as Acsl3, Acadvl, and Acox1 (see Fig. S8B and C in the supplemental material). Together, these results show that cooccupancy of PPARγ and PU.1 in adipocytes is associated with a gene expression program shared between primary macrophages and white adipose tissue.
DISCUSSION
Master regulator transcription factors are gatekeepers of lineage identity. Thus, elucidating their functional relationships is critical to a better understanding, and potential manipulation, of cellular fate decisions. In this study, the genome-wide binding of PPARγ in adipocytes, a lineage where it acts as the major driver of terminal differentiation, was studied after introduction of the hematopoietic master regulator PU.1. Surprisingly, PPARγ genomic occupancy was globally destabilized, eliminating weak binding sites and dampening, while still preserving stronger ones. Retained PPARγ binding sites were associated with adipogenic target genes and, compared to lost sites, were preferentially bound by PPARγ in adipose tissue in vivo. In the context of PU.1 expression, a gain of PU.1 binding and loss of PPARγ binding was associated with activation or repression, respectively. Interestingly, a shared adipose tissue-macrophage gene expression signature was preserved in PU.1-expressing adipocytes, characterized by cooccupancy of PPARγ and PU.1. Together, these results link PU.1's transdifferentiation potential with its ability to dramatically alter the genomic binding of another master regulator.
In addition to guiding macrophage development from hematopoietic progenitors, PU.1 can also reprogram otherwise committed cells to the macrophage lineage (14–17). This “transdifferentiation” requires (i) activation of a new lineage gene expression program and (ii) shutting off of the parental lineage gene expression program (44). First, though the induction of macrophage genes in adipocytes expressing PU.1 is consistent with possible lineage conversion (14, 15), we did not observe macrophage-like morphology or loss of lipid droplets in these cells (Fig. 1C and data not shown). This aborted lineage conversion is consistent with the finding that many macrophage PU.1 binding sites were not occupied by PU.1 in adipocytes and suggests that nonoverlapping sites represent PU.1-controlled regulatory regions involved in establishing the macrophage phenotype.
Moreover, efficient reprogramming of somatic cells often requires the concerted action of several ectopically expressed transcription factors, such as the generation of cardiac myocytes from fibroblasts by the trifecta of GATA4, MEF2C, and TBX5 (45). Thus, the attenuated lineage conversion in our system could reflect the functional deficit of other transcription factors required for macrophage differentiation. For example, macrophage PU.1 is often bound near C/EBPα and C/EBPβ, but this overlap is not complete, as 70% of C/EBP sites do not have PU.1 nearby (32). Interestingly, recent studies have established that both PU.1 and C/EBPβ can function as “pioneering” transcription factors that bind to inaccessible regions of DNA and facilitate their remodeling (41, 46). However, these two factors have nonredundant roles in macrophage differentiation (16) suggesting that (i) the independent pioneering activities of PU.1 and C/EBPβ may be required for establishment of macrophage identity, and (ii) in adipocytes, ectopic PU.1 is not sufficient to direct endogenous C/EBPs away from their adipocyte program and toward a macrophage one.
The second arm of somatic cell reprogramming involves extinguishing the parental cell gene expression program. In one study of B cell-to-macrophage lineage conversion, shutting down the B cell gene expression program was associated with dramatic suppression of its master regulators (2). This suggests that master regulators play an active role in maintaining normal levels of lineage-specific transcripts in committed somatic cells. Levels of adipogenic transcripts decrease when PPARγ is depleted from adipocytes (39), a phenomenon that could be related to the ability of PPARγ to interact with chromatin-remodeling enzymes, such as SWI-SNF family members (47, 48). Thus, ablation of PPARγ may be required to dramatically alter the adipocyte chromatin landscape in a manner consistent with conversion to another lineage. This is reflected in the inability of PU.1 to extinguish PPARγ expression in adipocytes and their attenuated macrophage conversion. Alternatively, in our system, reducing the level of PPARγ in adipocytes to the level normally found in macrophages (11) may have further potentiated lineage conversion. Absent a change in PPARγ abundance and overall adipocyte chromatin structure, PU.1 likely found its target motif in regions of open chromatin near a subset of PPARγ target genes. Notably, this gene set was strongly enriched for a common macrophage-adipose tissue expression signature.
A recent study suggested a role for endogenous PU.1 in mature adipocytes (49). However, in that study the relative abundance of this adipocyte PU.1 was not compared to that in macrophages. Our results clearly show that endogenous PU.1 levels in adipocytes are extremely low. Moreover, when interrogated by ChIP, the binding of endogenous PU.1 is below the level of detection in adipocytes, whereas ectopically expressed PU.1 binds robustly in a manner that is enriched at binding sites (Fig. 2C). Thus, if PU.1 is expressed in adipocytes, its genomic binding is likely restricted to a small number of sites below the level of detection for ChIP-seq and would not influence the results presented here.
Expressing PU.1 in adipocytes eliminated the majority of PPARγ binding sites. Importantly, this was not indirectly caused by PU.1-mediated depletion of PPARγ protein levels or by depletion of its binding partner RXRα, indicating that PU.1 likely interferes with the ability of PPARγ to bind DNA and/or chromatin. This could occur through PU.1-induced changes in global chromatin accessibility, destabilizing transcription factor binding and rendering all DNA binding proteins less “ChIP-able.” However, we did not detect any change in the occupancy of another sequence-specific DNA binding protein, CTCF, in PU.1-Ads compared to control cells. Moreover, genomic binding of ectopic PU.1 itself was widespread and robust.
As master regulators of cell fate and strong transcriptional activators, PPARγ and PU.1 collaborate with common coregulatory DNA binding proteins (50, 51). If a common factor (or factors), present in limiting amounts, is required for stable PPARγ genomic binding in adipocytes, then competition with PU.1 for these factors could decrease PPARγ occupancy, similar to the “squelching” of transcription factor activity that occurs when steroid hormone receptors are activated by their ligands (52, 53). Indeed, it was recently reported that estrogen receptor preferentially recruits the SRC family coactivator NCOA3 to its binding sites, and this is associated with decreased cooccupancy of NCOA3 at FoxA1 sites (54). However, we did not find any evidence for PU.1 interference with the binding of either NCOA3 or its related family member NCOA1 at PPARγ sites (data not shown).
The findings presented here show that the hematopoietic master regulator PU.1 can facilitate its own binding to thousands of genomic regions in adipocytes while simultaneously destabilizing the genomic binding of PPARγ. Though the numbers of PU.1 binding sites in adipocytes and macrophages are similar, their overlap is limited, indicating a role for additional hematopoietic regulators in guiding PU.1 binding site selection in macrophages. In addition, expression of PU.1 in adipocytes revealed that PPARγ binding sites can be placed into a hierarchy, with the strongest sites being enriched for binding near adipogenic genes and for overlap with PPARγ binding in vivo. Elucidating the mechanisms used by cell type-specific master regulators to establish and maintain lineage identity should aid efforts aimed at manipulating cell fate for therapeutic purposes.
Supplementary Material
ACKNOWLEDGMENTS
We thank Michael Atchison (University of Pennsylvania) for the gift of a PU.1 expression construct. We thank Jonathan Schug, Alan Fox, Olga Smirnova and members of the Functional Genomics Core at the University of Pennsylvania Diabetes Research Center (DK19525) for ChIP-seq sample sequencing and running the Illumina pipeline. We also thank members of the Lazar lab for helpful discussions.
This work was supported by NIH DK49780 and by the Cell and Developmental Biology Training Grant (T32HD007516).
Footnotes
Published ahead of print 17 June 2013
Supplemental material for this article may be found at http://dx.doi.org/10.1128/MCB.00599-13.
REFERENCES
- 1. Cherry AB, Daley GQ. 2012. Reprogramming cellular identity for regenerative medicine. Cell 148:1110–1122 [DOI] [PMC free article] [PubMed] [Google Scholar]
- 2. Bussmann LH, Schubert A, Vu Manh TP, De Andres L, Desbordes SC, Parra M, Zimmermann T, Rapino F, Rodriguez-Ubreva J, Ballestar E, Graf T. 2009. A robust and highly efficient immune cell reprogramming system. Cell. Stem Cell 5:554–566 [DOI] [PubMed] [Google Scholar]
- 3. Ladewig J, Koch P, Brustle O. 2013. Leveling Waddington: the emergence of direct programming and the loss of cell fate hierarchies. Nat. Rev. Mol. Cell Biol. 14:225–236 [DOI] [PubMed] [Google Scholar]
- 4. Margariti A, Winkler B, Karamariti E, Zampetaki A, Tsai TN, Baban D, Ragoussis J, Huang Y, Han JD, Zeng L, Hu Y, Xu Q. 2012. Direct reprogramming of fibroblasts into endothelial cells capable of angiogenesis and reendothelialization in tissue-engineered vessels. Proc. Natl. Acad. Sci. U. S. A. 109:13793–13798 [DOI] [PMC free article] [PubMed] [Google Scholar]
- 5. Islas JF, Liu Y, Weng KC, Robertson MJ, Zhang S, Prejusa A, Harger J, Tikhomirova D, Chopra M, Iyer D, Mercola M, Oshima RG, Willerson JT, Potaman VN, Schwartz RJ. 2012. Transcription factors ETS2 and MESP1 transdifferentiate human dermal fibroblasts into cardiac progenitors. Proc. Natl. Acad. Sci. U. S. A. 109:13016–13021 [DOI] [PMC free article] [PubMed] [Google Scholar]
- 6. Huang P, He Z, Ji S, Sun H, Xiang D, Liu C, Hu Y, Wang X, Hui L. 2011. Induction of functional hepatocyte-like cells from mouse fibroblasts by defined factors. Nature 475:386–389 [DOI] [PubMed] [Google Scholar]
- 7. Zhou Q, Brown J, Kanarek A, Rajagopal J, Melton DA. 2008. In vivo reprogramming of adult pancreatic exocrine cells to beta-cells. Nature 455:627–632 [DOI] [PMC free article] [PubMed] [Google Scholar]
- 8. Yanger K, Zong Y, Maggs LR, Shapira SN, Maddipati R, Aiello NM, Thung SN, Wells RG, Greenbaum LE, Stanger BZ. 2013. Robust cellular reprogramming occurs spontaneously during liver regeneration. Genes Dev. 27:719–724 [DOI] [PMC free article] [PubMed] [Google Scholar]
- 9. Heinz S, Glass CK. 2012. Roles of lineage-determining transcription factors in establishing open chromatin: lessons from high-throughput studies. Curr. Top. Microbiol. Immunol. 356:1–15 [DOI] [PubMed] [Google Scholar]
- 10. Zaret KS, Carroll JS. 2011. Pioneer transcription factors: establishing competence for gene expression. Genes Dev. 25:2227–2241 [DOI] [PMC free article] [PubMed] [Google Scholar]
- 11. Lefterova MI, Steger DJ, Zhuo D, Qatanani M, Mullican SE, Tuteja G, Manduchi E, Grant GR, Lazar MA. 2010. Cell-specific determinants of peroxisome proliferator-activated receptor gamma function in adipocytes and macrophages. Mol. Cell. Biol. 30:2078–2089 [DOI] [PMC free article] [PubMed] [Google Scholar]
- 12. Scott EW, Simon MC, Anastasi J, Singh H. 1994. Requirement of transcription factor PU.1 in the development of multiple hematopoietic lineages. Science 265:1573–1577 [DOI] [PubMed] [Google Scholar]
- 13. DeKoter RP, Singh H. 2000. Regulation of B lymphocyte and macrophage development by graded expression of PU.1. Science 288:1439–1441 [DOI] [PubMed] [Google Scholar]
- 14. Feng R, Desbordes SC, Xie H, Tillo ES, Pixley F, Stanley ER, Graf T. 2008. PU.1 and C/EBPalpha/beta convert fibroblasts into macrophage-like cells. Proc. Natl. Acad. Sci. U. S. A. 105:6057–6062 [DOI] [PMC free article] [PubMed] [Google Scholar]
- 15. Forsberg M, Carlen M, Meletis K, Yeung MS, Barnabe-Heider F, Persson MA, Aarum J, Frisen J. 2010. Efficient reprogramming of adult neural stem cells to monocytes by ectopic expression of a single gene. Proc. Natl. Acad. Sci. U. S. A. 107:14657–14661 [DOI] [PMC free article] [PubMed] [Google Scholar]
- 16. Laiosa CV, Stadtfeld M, Xie H, de Andres-Aguayo L, Graf T. 2006. Reprogramming of committed T cell progenitors to macrophages and dendritic cells by C/EBP alpha and PU.1 transcription factors. Immunity 25:731–744 [DOI] [PubMed] [Google Scholar]
- 17. Xie H, Ye M, Feng R, Graf T. 2004. Stepwise reprogramming of B cells into macrophages. Cell 117:663–676 [DOI] [PubMed] [Google Scholar]
- 18. Tontonoz P, Spiegelman BM. 2008. Fat and beyond: the diverse biology of PPARgamma. Annu. Rev. Biochem. 77:289–312 [DOI] [PubMed] [Google Scholar]
- 19. Lefterova MI, Zhang Y, Steger DJ, Schupp M, Schug J, Cristancho A, Feng D, Zhuo D, Stoeckert CJ, Jr, Liu XS, Lazar MA. 2008. PPARgamma and C/EBP factors orchestrate adipocyte biology via adjacent binding on a genome-wide scale. Genes Dev. 22:2941–2952 [DOI] [PMC free article] [PubMed] [Google Scholar]
- 20. MacQuarrie KL, Fong AP, Morse RH, Tapscott SJ. 2011. Genome-wide transcription factor binding: beyond direct target regulation. Trends Genet. 27:141–148 [DOI] [PMC free article] [PubMed] [Google Scholar]
- 21. Nielsen R, Pedersen TA, Hagenbeek D, Moulos P, Siersbaek R, Megens E, Denissov S, Borgesen M, Francoijs KJ, Mandrup S, Stunnenberg HG. 2008. Genome-wide profiling of PPARgamma:RXR and RNA polymerase II occupancy reveals temporal activation of distinct metabolic pathways and changes in RXR dimer composition during adipogenesis. Genes Dev. 22:2953–2967 [DOI] [PMC free article] [PubMed] [Google Scholar]
- 22. Waki H, Nakamura M, Yamauchi T, Wakabayashi K, Yu J, Hirose-Yotsuya L, Take K, Sun W, Iwabu M, Okada-Iwabu M, Fujita T, Aoyama T, Tsutsumi S, Ueki K, Kodama T, Sakai J, Aburatani H, Kadowaki T. 2011. Global mapping of cell type-specific open chromatin by FAIRE-seq reveals the regulatory role of the NFI family in adipocyte differentiation. PLoS Genet. 7:e1002311. 10.1371/journal.pgen.1002311 [DOI] [PMC free article] [PubMed] [Google Scholar]
- 23. Tontonoz P, Nagy L, Alvarez JG, Thomazy VA, Evans RM. 1998. PPARgamma promotes monocyte/macrophage differentiation and uptake of oxidized LDL. Cell 93:241–252 [DOI] [PubMed] [Google Scholar]
- 24. Chen Z, Vigueira PA, Chambers KT, Hall AM, Mitra MS, Qi N, McDonald WG, Colca JR, Kletzien RF, Finck BN. 2012. Insulin resistance and metabolic derangements in obese mice are ameliorated by a novel peroxisome proliferator-activated receptor gamma-sparing thiazolidinedione. J. Biol. Chem. 287:23537–23548 [DOI] [PMC free article] [PubMed] [Google Scholar]
- 25. Kanda T, Brown JD, Orasanu G, Vogel S, Gonzalez FJ, Sartoretto J, Michel T, Plutzky J. 2009. PPARgamma in the endothelium regulates metabolic responses to high-fat diet in mice. J. Clin. Invest. 119:110–124 [DOI] [PMC free article] [PubMed] [Google Scholar]
- 26. Lu M, Sarruf DA, Talukdar S, Sharma S, Li P, Bandyopadhyay G, Nalbandian S, Fan W, Gayen JR, Mahata SK, Webster NJ, Schwartz MW, Olefsky JM. 2011. Brain PPAR-gamma promotes obesity and is required for the insulin-sensitizing effect of thiazolidinediones. Nat. Med. 17:618–622 [DOI] [PMC free article] [PubMed] [Google Scholar]
- 27. Cipolletta D, Feuerer M, Li A, Kamei N, Lee J, Shoelson SE, Benoist C, Mathis D. 2012. PPAR-gamma is a major driver of the accumulation and phenotype of adipose tissue Treg cells. Nature 486:549–553 [DOI] [PMC free article] [PubMed] [Google Scholar]
- 28. Chawla A, Barak Y, Nagy L, Liao D, Tontonoz P, Evans RM. 2001. PPAR-gamma dependent and independent effects on macrophage-gene expression in lipid metabolism and inflammation. Nat. Med. 7:48–52 [DOI] [PubMed] [Google Scholar]
- 29. Ricote M, Li AC, Willson TM, Kelly CJ, Glass CK. 1998. The peroxisome proliferator-activated receptor-gamma is a negative regulator of macrophage activation. Nature 391:79–82 [DOI] [PubMed] [Google Scholar]
- 30. Nagy L, Tontonoz P, Alvarez JG, Chen H, Evans RM. 1998. Oxidized LDL regulates macrophage gene expression through ligand activation of PPARgamma. Cell 93:229–240 [DOI] [PubMed] [Google Scholar]
- 31. Roszer T, Menendez-Gutierrez MP, Lefterova MI, Alameda D, Nunez V, Lazar MA, Fischer T, Ricote M. 2011. Autoimmune kidney disease and impaired engulfment of apoptotic cells in mice with macrophage peroxisome proliferator-activated receptor gamma or retinoid X receptor alpha deficiency. J. Immunol. 186:621–631 [DOI] [PMC free article] [PubMed] [Google Scholar]
- 32. Heinz S, Benner C, Spann N, Bertolino E, Lin YC, Laslo P, Cheng JX, Murre C, Singh H, Glass CK. 2010. Simple combinations of lineage-determining transcription factors prime cis-regulatory elements required for macrophage and B cell identities. Mol. Cell 38:576–589 [DOI] [PMC free article] [PubMed] [Google Scholar]
- 33. Robinson JT, Thorvaldsdottir H, Winckler W, Guttman M, Lander ES, Getz G, Mesirov JP. 2011. Integrative genomics viewer. Nat. Biotechnol. 29:24–26 [DOI] [PMC free article] [PubMed] [Google Scholar]
- 34. Ji H, Jiang H, Ma W, Johnson DS, Myers RM, Wong WH. 2008. An integrated software system for analyzing ChIP-chip and ChIP-seq data. Nat. Biotechnol. 26:1293–1300 [DOI] [PMC free article] [PubMed] [Google Scholar]
- 35. Liu T, Ortiz JA, Taing L, Meyer CA, Lee B, Zhang Y, Shin H, Wong SS, Ma J, Lei Y, Pape UJ, Poidinger M, Chen Y, Yeung K, Brown M, Turpaz Y, Liu XS. 2011. Cistrome: an integrative platform for transcriptional regulation studies. Genome Biol. 12:R83–2011-12-8-r83. 10.1186/gb-2011-12-8-r83 [DOI] [PMC free article] [PubMed] [Google Scholar]
- 36. McLean CY, Bristor D, Hiller M, Clarke SL, Schaar BT, Lowe CB, Wenger AM, Bejerano G. 2010. GREAT improves functional interpretation of cis-regulatory regions. Nat. Biotechnol. 28:495–501 [DOI] [PMC free article] [PubMed] [Google Scholar]
- 37. Ross-Innes CS, Stark R, Teschendorff AE, Holmes KA, Ali HR, Dunning MJ, Brown GD, Gojis O, Ellis IO, Green AR, Ali S, Chin SF, Palmieri C, Caldas C, Carroll JS. 2012. Differential oestrogen receptor binding is associated with clinical outcome in breast cancer. Nature 481:389–393 [DOI] [PMC free article] [PubMed] [Google Scholar]
- 38. Tusher VG, Tibshirani R, Chu G. 2001. Significance analysis of microarrays applied to the ionizing radiation response. Proc. Natl. Acad. Sci. U. S. A. 98:5116–5121 [DOI] [PMC free article] [PubMed] [Google Scholar]
- 39. Schupp M, Cristancho AG, Lefterova MI, Hanniman EA, Briggs ER, Steger DJ, Qatanani M, Curtin JC, Schug J, Ochsner SA, McKenna NJ, Lazar MA. 2009. Re-expression of GATA2 cooperates with peroxisome proliferator-activated receptor-gamma depletion to revert the adipocyte phenotype. J. Biol. Chem. 284:9458–9464 [DOI] [PMC free article] [PubMed] [Google Scholar]
- 40. Tontonoz P, Graves RA, Budavari AI, Erdjument-Bromage H, Lui M, Hu E, Tempst P, Spiegelman BM. 1994. Adipocyte-specific transcription factor ARF6 is a heterodimeric complex of two nuclear hormone receptors, PPAR gamma and RXR alpha. Nucleic Acids Res. 22:5628–5634 [DOI] [PMC free article] [PubMed] [Google Scholar]
- 41. Siersbæk R, Nielsen R, John S, Sung MH, Baek S, Loft A, Hager GL, Mandrup S. 2011. Extensive chromatin remodelling and establishment of transcription factor ‘hotspots’ during early adipogenesis. EMBO J. 30:1459–1472 [DOI] [PMC free article] [PubMed] [Google Scholar]
- 42. Schmidt SF, Jorgensen M, Chen Y, Nielsen R, Sandelin A, Mandrup S. 2011. Cross species comparison of C/EBPalpha and PPARgamma profiles in mouse and human adipocytes reveals interdependent retention of binding sites. BMC Genomics 12:152–2164-12-152. 10.1186/1471-2164-12-152 [DOI] [PMC free article] [PubMed] [Google Scholar]
- 43. Lattin JE, Schroder K, Su AI, Walker JR, Zhang J, Wiltshire T, Saijo K, Glass CK, Hume DA, Kellie S, Sweet MJ. 2008. Expression analysis of G protein-coupled receptors in mouse macrophages. Immunome Res. 4:5–7580-4-5. 10.1186/1745-7580-4-5 [DOI] [PMC free article] [PubMed] [Google Scholar]
- 44. Graf T, Enver T. 2009. Forcing cells to change lineages. Nature 462:587–594 [DOI] [PubMed] [Google Scholar]
- 45. Ieda M, Fu JD, Delgado-Olguin P, Vedantham V, Hayashi Y, Bruneau BG, Srivastava D. 2010. Direct reprogramming of fibroblasts into functional cardiomyocytes by defined factors. Cell 142:375–386 [DOI] [PMC free article] [PubMed] [Google Scholar]
- 46. Pham TH, Minderjahn J, Schmidl C, Hoffmeister H, Schmidhofer S, Chen W, Langst G, Benner C, Rehli M. 2013. Mechanisms of in vivo binding site selection of the hematopoietic master transcription factor PU.1. Nucleic Acids Res. [Epub ahead of print.] 10.1093/nar/gkt355 [DOI] [PMC free article] [PubMed] [Google Scholar]
- 47. Caramel J, Medjkane S, Quignon F, Delattre O. 2008. The requirement for SNF5/INI1 in adipocyte differentiation highlights new features of malignant rhabdoid tumors. Oncogene 27:2035–2044 [DOI] [PubMed] [Google Scholar]
- 48. Debril MB, Gelman L, Fayard E, Annicotte JS, Rocchi S, Auwerx J. 2004. Transcription factors and nuclear receptors interact with the SWI/SNF complex through the BAF60c subunit. J. Biol. Chem. 279:16677–16686 [DOI] [PubMed] [Google Scholar]
- 49. Lin L, Pang W, Chen K, Wang F, Gengler J, Sun Y, Tong Q. 2012. Adipocyte expression of PU.1 transcription factor causes insulin resistance through upregulation of inflammatory cytokine gene expression and ROS production. Am. J. Physiol. Endocrinol. Metab. 302:E1550–E1559 [DOI] [PMC free article] [PubMed] [Google Scholar]
- 50. Bugge A, Mandrup S. 31 August 2010, posting date Molecular mechanisms and genome-wide aspects of PPAR subtype specific transactivation. PPAR Res. 2010:169506. 10.1155/2010/169506 [DOI] [PMC free article] [PubMed] [Google Scholar]
- 51. Gupta P, Gurudutta GU, Saluja D, Tripathi RP. 2009. PU.1 and partners: regulation of haematopoietic stem cell fate in normal and malignant haematopoiesis. J. Cell. Mol. Med. 13:4349–4363 [DOI] [PMC free article] [PubMed] [Google Scholar]
- 52. Meyer ME, Gronemeyer H, Turcotte B, Bocquel MT, Tasset D, Chambon P. 1989. Steroid hormone receptors compete for factors that mediate their enhancer function. Cell 57:433–442 [DOI] [PubMed] [Google Scholar]
- 53. Carroll JS, Meyer CA, Song J, Li W, Geistlinger TR, Eeckhoute J, Brodsky AS, Keeton EK, Fertuck KC, Hall GF, Wang Q, Bekiranov S, Sementchenko V, Fox EA, Silver PA, Gingeras TR, Liu XS, Brown M. 2006. Genome-wide analysis of estrogen receptor binding sites. Nat. Genet. 38:1289–1297 [DOI] [PubMed] [Google Scholar]
- 54. He HH, Meyer CA, Chen MW, Jordan VC, Brown M, Liu XS. 2012. Differential DNase I hypersensitivity reveals factor-dependent chromatin dynamics. Genome Res. 22:1015–1025 [DOI] [PMC free article] [PubMed] [Google Scholar]
Associated Data
This section collects any data citations, data availability statements, or supplementary materials included in this article.