

Abstract
H1 linker histones play a key role in facilitating higher order chromatin folding. Emerging evidence suggests that H1 and its multiple variants are important epigenetic factors in modulating chromatin function and gene expression. Ovarian cancer is a devastating disease, ranking the fifth leading cause of all women cancer death due to its poor prognosis and difficulty in early diagnosis. Although epigenetic alterations in ovarian cancers are being appreciated in general, the role of H1 has not been explored. Here, using quantitative RT-PCR assays, we systematically examined the expression of 7 H1 genes in 33 human epithelial ovarian tumors. Whereas the expression of H1.3 was markedly increased, the expression of H1°, H1.1, H1.4 and H1x were significantly reduced in malignant adenocarcinomas compared with benign adenomas. Strikingly, ovarian adenocarcinomas and adenomas exhibited characteristic expression patterns, and expression profiling of 7 H1 genes in tumor samples discriminated adenocarcinomas vs. adenomas with high accuracy. These findings indicate that the expression of H1 variants is exquisitely regulated and may serve as potential epigenetic biomarkers for ovarian cancer.
Keywords: H1 Linker Histones, H1 Variants, Gene Expression Profiling, Ovarian Cancer, Clustering
2. INTRODUCTION
Ovarian cancer has the highest mortality rate among gynecological malignancies and ranks as the fourth most common cancer in women. Each year more than 21,000 women are diagnosed with ovarian cancers and about 15,000 women die of the disease (1, 2). Due to the lack of effective screening methods and asymptomatic nature of ovarian cancers at early stages and during relapse, most women have advanced stage ovarian cancers at the time of diagnosis and the 5-year survival rate is only 25–50%. The etiology of ovarian cancers involves both genetic and epigenetic alterations. Unlike genetic mutations, epigenetic changes, such as alterations in DNA methylation and histone modifications, are reversible, thus offering an attractive avenue for therapeutic interventions. Better understanding of epigenetic changes associated with ovarian neoplasia will facilitate designing new strategies for early detection and effective therapy of ovarian cancers.
Aberrant epigenetic regulations contribute significantly to ovarian cancer development and progression (3, 4). Accumulating evidence shows that alterations in DNA methylation and/or core histone modifications are responsible for silencing of tumor suppressor genes or upregulation of cancer-promoting genes in ovarian cancers (3, 5, 6). Ovarian tumors also display genome-wide DNA hypomethylation and differential expression patterns of genes encoding histone modifying activities (4, 7). Such global changes in DNA methylation and histone modifications suggest that ovarian cancer cells adopt drastically different chromatin structure, because both DNA methylation and core histone post-translational modifications can profoundly impact on chromatin folding. However, the role of linker histones, the key factors in mediating higher order chromatin structure has not been explored in ovarian cancer. Here we take the first step to investigate a potential connection between specific linker histone variants with ovarian cancer through expression profiling of various H1 subtypes.
Linker histone H1 binds to the nucleosome core particle, the basic repeating unit of chromatin consisting an octamer of two molecules of each of the four core histones (H2A, H2B, H3 and H4) wrapped by 146 bp of DNA, and the linker DNA between nucleosomes to mediate higher order chromatin folding into a 30-nm fiber (8, 9). Consistent with its role in chromatin condensation and limiting genome accessibility, H1 acts as a general transcription repressor, repressing transcription by all three types of RNA polymerases in in vitro studies (reviewed in (8, 10)). However, recent work using in vivo systems demonstrated a rather selective role of H1 in gene regulation, such that H1 can either activate or repress specific gene transcription under various physiological contexts (11–20).
The H1 histone family is the most divergent and heterogeneous group of histones among the highly conserved histone protein families. All metazoan H1s share the same tripartite domain structure with a central globular domain flanked by N- terminal and C-terminal tail regions. The globular domain is evolutionally conserved from yeast to humans. Different H1 subtypes exhibit significant sequence divergence from one another, yet H1 subtypes are highly conserved during evolution in mammals, suggesting distinct functions for these subtypes. There are 11 H1 subtypes (H1°, H1.1, H1.2, H1.3, H1.4, H1.5, H1oo, H1t, H1x, H1t2 and H1LS1) identified in mammals that are differentially regulated during development and cellular differentiation (21). H1.1 through H1.5 are somatic H1s that are ubiquitously expressed in all cell types and tissues. The synthesis of these 5 somatic H1s is cell-cycle dependent and tightly regulated during development, such that each tissue has a characteristic composition of somatic H1 subtypes (22, 23). Although individual somatic H1 subtypes appear to be dispensable for normal mouse development, loss of three somatic H1 subtypes (H1.2, H1.3 and H1.4) by sequential gene targeting leads to embryonic lethality at mid-gestation, demonstrating that linker histones are required for mammalian development (24–29). H1x is a more distantly related H1 variant whose RNA messages are present in many somatic tissues (30,31). H1x proteins are found to accumulate in nucleoli in G1 phase and at chromosome periphery during mitosis in cultured cells, but its total protein level remains unchanged throughout cell cycle (32–33). H1x is highly expressed in neuroendocrine cells and its expression is increased in neuroendocrine tumors (34). The replacement H1 variant, H1°, is expressed mainly in differentiated and non-dividing cells (35). H1oo and H1t are oocyte- and testis- specific variants, respectively (36, 37). H1T2 and H1LS1 are two distantly related H1t-like proteins that are specifically expressed in spermatids (38, 39). Different H1 subtypes exhibit distinct in vivo binding dynamics in oocytes and during embryonic stem (ES) cell nuclear transfer (40). These properties of H1 subtypes suggest that exquisite regulation of high order chromatin compaction in various cellular processes may be achieved with different complements of H1 subtypes.
In this study, we analyzed the expression pattern of H1 subtypes as a means to probe the specific chromatin status associated with malignant ovarian cancer. The vast majority of malignant ovarian tumors are epithelial ovarian adenocarcinomas, which are derived from the ovarian surface epithelium (41). While also derived from ovarian surface epithelium, ovarian adenomas are generally benign and do not have aggressive growth, nor do they metastasize to adjacent tissues. Here, we first systematically screened 14 malignant ovarian adenocarcinomas and 11 benign ovarian adenomas of the mRNA levels of all somatic and replacement H1 subtypes by quantitative reverse transcription-polymerase chain reaction (qRT-PCR) assays. We found that several H1 subtypes displayed drastically different expression patterns in malignant ovarian cancers compared with benign adenomas. Furthermore, profiling and hierarchical clustering analysis of the expression levels of H1 subtypes accurately discriminated between benign adenomas and malignant adenocarcinomas of all 25 samples, and correctly segregated ovarian adenomas from adenocarcinomas in a blind test set of 8 tumor samples with 87.5% accuracy, suggesting a potential use of specific H1 subtypes as ovarian cancer biomarkers.
3. MATERIALS AND METHODS
3.1. Tumor samples
A total of 33 tumor samples with an initial set of 25 tumors and a second set of 8 tumors, including 18 benign serous cystadenomas and 17 malignant adenocarcinomas (Stages III and IV), were obtained from the Ovarian Cancer Institute (Atlanta, USA). Primary tumor tissues were collected from patients who underwent surgery for removal of ovarian tumors at Northside Hospital (Atlanta, USA) according to procedures approved by the Institutional Review Boards of Georgia Institute of Technology and Northside Hospital. Patients had not been pretreated with chemotherapy at the time of surgery and the tumor tissues were snap frozen in liquid nitrogen immediately at the time of surgical removal.
3.2. RNA isolation
Tissue samples (75–100mg) were ground with a PowerGen 125 homogenizer (Fisher Scientific) on ice in the presence of Trizol (Invitrogen, Carlsbad, CA) for 3 times with 15 seconds each time to obtain crude homogenates. RNAs were subsequently extracted from the crude homogenates with Trizol according to the manufacturer’s instructions. RNA samples were subsequently cleaned and concentrated using RNeasy Mini Kit (Qiagen, Valencia, CA). The concentration and quality of RNA were measured and verified with a Nanodrop ND1000 Spectrophotometer (Nanodrop, Wilmington, DE) and gel electrophoresis.
3.3. Real-time quantitative RT-PCR (qRT-PCR)
2.5ug of total RNAs extracted from ovarian tumors were reverse transcribed into cDNAs using Superscript III kit (Invitrogen, Carlsbad, CA) according to the manufacturer’s manual. Since most histone RNAs do not have long polyA tails, random hexamers (instead of oligo-dT) were used as primers in the reverse transcription reactions. cDNAs were subsequently analyzed by real-time PCR analysis to quantitatively measure the expression levels of H1 subtype genes and house-keeping genes, e.g. glyceraldehyde-3-phosphate dehydrogenase (GAPDH) gene, which served as normalization controls. Real-time quantitative PCR analysis with an RNA template was performed as RT(−) reactions to control for potential genomic DNA contamination. In all of the reactions, the amount of PCR product produced from RT(−) reactions was less than 1% of that from RT(+) samples, indicating that genomic DNA contamination, if any, was minimal. Primers used for the real-time quantitative PCR analysis of H1 genes are listed in Table 1.
Table 1.
List of primers used for qRT-PCR analysis of variant H1 genes and housekeeping genes.
| Gene name | Accession number | Sequence 5′ | Product size (bp) | Annealing temperature |
|---|---|---|---|---|
| H1.1 | HIST1H1A: NM_005325 | F′-CTCCTCTAAGGAGCGTGGTG | 192 | 57°C |
| R′-GAGGACGCCTTCTTGTTGAG | ||||
| H1.2 | HIST1H1C: NM_005319 | F′-ACACCGAAGAAAGCGAAGAA | 154 | 57°C |
| R′-GCTTGACAACCTTGGGCTTA | ||||
| H1.3 | HIST1H1D: NM_005320 | F′-GGAGACTGCTCCACTTGCTC | 75 | 57°C |
| R′-GCCTTCTTCGCCTTTTTCTT | ||||
| H1.4 | HIST1H1E: NM_005321 | F′-GTCGGGTTCCTTCAAACTCA | 171 | 57°C |
| R′-GCCTTCTTTGGGGTCTTCTT | ||||
| H1.5 | HIST1H1B: NM_005322 | F′-GTCAAAAAGGTGGCGAAGAG | 159 | 57°C |
| R′-CTTGGCCTTTGCAGCTTTAG | ||||
| H1° | H1F0: NM_005318 | F′-CTCGCAGATCAAGTTGTCCA | 127 | 57°C |
| R′-GAAGGCCACTGACTTCTTGG | ||||
| H1x | H1FX: NM_006026 | F′-GTGGTTCGACCAGCAGAATG | 115 | 57°C |
| R′-GAGCTTGAAGGAACCGTTGG | ||||
| GAPDH | GAPDH:NM_002046 | F′-GAGTCAACGGATTTGGTCGT | 185 | 57°C |
| R′-GACAAGCTTCCCGTTCTCAG | ||||
| β-actin | ACTB: NM_001101 | F′-CTCTTCCAGCCTTCCTTCCT | 116 | 57°C |
| R′-AGCACTGTGTTGGCGTACAG |
The amount of cDNAs or DNA fragments was quantified and analyzed by real-time PCR using iQ SYBR green PCR Supermix kit (Bio-Rad Laboratories, Hercules, CA) in a MyIQ Single Color real-time PCR Detection System (Bio-Rad). Each primer pair was tested by a standard curve method using serial dilutions of DNA template and the dissociation curve was measured to assure that only the expected PCR product was produced. All samples were typically analyzed in duplicate in at least 3 independent runs. Real-time data were recorded and quantified using iQ5 software provided by the manufacturer and expression values of H1 genes were normalized against that of GAPDH. The genes for somatic H1s (H1.1-H1.5), H1°, and H1x do not have introns. In order to cross-compare the relative mRNA message abundance within a tumor sample, the mRNA amount was normalized by the primer coefficiency determined by qPCR using genomic DNA as template by standard curve method. The following program was applied for the experiment: 95°C for 3 min., 95°C for 10 sec., 60°C for 20 sec., 72°C for 30 sec., 95°C for 1 min. in 40 cycles.
3.4. Statistical analysis
Statistical analysis and P values of the differences between the median of H1 expression levels in ovarian adenomas and adenocarcinomas were calculated by Mann-Whitney unpaired two-tailed test. A P value of less than 0.05 was considered to be statistically significant.
3.5. Immunoblotting
Tumor samples were homogenized with a PowerGen125 homogenizer (Fisher Scientific) in Lysis buffer (30mM Tris pH 8.0, 150mM NaCl, 0.1% SDS, 0.5% Na-deoxycholate, 0.1% NP-40, Proteinase Inhibitor tablet). Protein concentrations of the cell lysates were determined by Bradford Protein Assay (Bio-Rad). 20ug of cell lysates were boiled for 5 minutes in Loading Buffer (2% SDS, 10% Glycerol, 50mM Tris pH 7.0, 100mM DTT, 0.1% bromophenol blue) before subject to 12% SDS-PAGE. Proteins were subsequently transferred to a nitrocellulose membrane (Bio-Rad) and blotted with a monoclonal antibody against H1° (Santa Cruz, sc-56695) (42), or GAPDH (Ambion, AM4300) as a loading control, followed by a Fluor® 680 goat anti-mouse IgG secondary antibody (Invitrogen A21058). The protein bands were visualized and quantified using the Odyssey Infrared Imaging System (LI-COR Biosciences).
3.6. Cluster analysis
Hierarchical clustering analysis was performed using the cluster 3.0 software from open source clustering software (http://bonsai.hgc.jp/~mdehoon/software/cluster/software.htm#ctv) and visualized using Treeview, which was developed based on program Cluster/Treeview (43).
4. RESULTS
4.1. Analysis of the expression patterns of histone H1 subtypes using qRT-PCR
We developed a set of real-time RT-PCR assays to quantitatively measure the mRNA levels of individual H1 variants. Because mRNAs of most H1 genes contain a stem-loop structure at their 3′ untranslated regions (UTR) and lack the long polyA tails normally present in most other cellular mRNAs, we prepared cDNAs from total RNAs using random-primer based reverse transcription. By this means, we analyzed mRNA expression of all H1 subtypes, except those of the four germ cell specific H1s. The H1 genes measured include the 5 somatic H1s (H1.1-H1.5), H1° and H1x. Table 1 lists RT-PCR primers utilized in these assays.
4.2. Differential expression of the histone H1 subtype genes in ovarian tumors
To test if any of the H1 genes are differentially expressed during ovarian carcinogenesis, we measured the mRNA levels of 7 H1 genes in 11 benign ovarian adenomas and 15 malignant ovarian adenocarcinomas of stage III/IV using qRT-PCR assays. The mRNA levels of GAPDH and beta-actin remained constant across all tumor samples, indicating little variations in sample preparation and qRT-PCR analysis. Each sample was analyzed in at least three independent experiments and the expression levels of H1 subtypes were normalized by the expression level of GAPDH. Since all 7 H1s measured here are intron-less, we normalized the relative primer efficiency for individual H1 subtypes by performing PCR reactions using the genomic DNA templates. After adjusting for the relative efficiency of individual PCR reactions, we quantified relative mRNA expression levels of individual H1 subtypes (Figure 1) as well as the total H1 mRNA levels (Figure 2).
Figure 1.

qRT-PCR analysis of mRNA levels of linker histone variants in ovarian tumors. Normalized mRNA expression levels of H1 subtypes are presented individually (A) and as a group (B). Y axis represents relative expression units. Each dot represents average expression values obtained from three independent measurements from one tumor sample. Data were normalized with the expression level of GAPDH and primer efficiency factor. *: P<0.05; **: P<0.01; ***: P<0.001.
Figure 2.
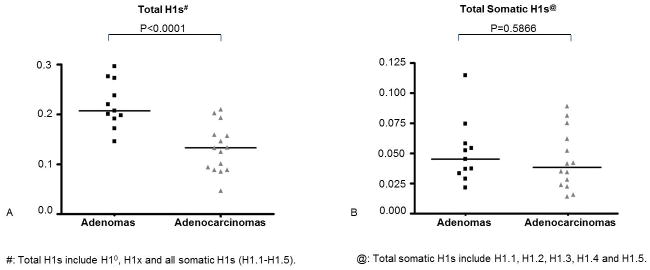
Quantification of mRNA levels of total H1s and total somatic H1s. (A) Total relative expression units for all H1s; (B) Total relative expression units for all somatic H1s (H1.1-H1.5). Y axis represents relative expression units. Each dot represents the averagevalue of the relative expression units obtained from three independent measurements of one tumor sample. Data were normalized with expression of GAPDH and primer efficiency factor. *: P<0.05; **: P<0.01; ***: P<0.001.
Among the 7 H1 genes, H1.1, H1.4, H1°, and H1x mRNA levels were significantly reduced in ovarian malignant adenocarcinomas compared with benign adenomas. The reduction in expression values was highly statistically significant, with P values less than 0.0001 for H1°, and equal to 0.006, 0.014, 0.003 for H1.1, H1.4 and H1x, respectively. In contrast, H1.3 was increased 2.5-fold in malignant tumors (P=0.0029) (Fig. 1). The average expression levels of H1.2 and H1.5 did not appear to be statistically different between adenomas and adenocarcinomas (P >0.05). Quantitation of total mRNA levels from all 7 H1 subtypes showed that, on average, the sum of total H1 mRNAs declined 40% in adenocarcinomas (P=0.0007) (Figure 2A). This decrease in total H1 mRNA messages is mainly due to the reduction of H1° mRNA levels because the total levels for S-phase dependent, stem-loop ended somatic H1 mRNAs (H1.1-H1.5 mRNAs) were similar between these two tumor types (Figure 2B), and the mRNA levels of H1x were negligible compared with other H1 subtype mRNAs (Figure 1). H1° mRNA, however, is polyadenylated, produced throughout cell cycle and processed differently than somatic H1 (H1.1-H1.5) mRNAs (23, 44, 45). Interestingly, although ovarian adenomas and adenocarcinomas have similar levels of total S-phase dependent somatic H1 mRNAs (H1.1-H1.5) (Figure 2B), the relative proportions of mRNAs expressed from different somatic H1 genes are drastically different (Figure 1). This result suggests that individual somatic H1 subtypes are transcriptionally differentially regulated in benign adenomas vs. malignant adenocarcinomas.
We next determined if the drastic differences in H1° mRNA levels in adenomas vs. adenocarcinomas resulted in changes in H1° protein levels in these two types of tumors. We analyzed H1° protein levels in two adenocarcinomas (c647 and c756) and two adenomas (a564, a670), which contained H1° mRNA levels 3-fold of that from c647 and c756 (Figure 3A). The two adenomas had significantly higher levels of H1° proteins than the two adenocarcinomas (Figure 3B), and quantitation of the protein band signals showed a 4-fold increase of H1° protein in the two adenomas. Immunostaining of the sections of these 4 tumors indicated that H1° proteins were ubiquitously present in all cells, and that the two adenomas displayed stronger signals for H1° than adenocarcinomas (data not shown). These results suggest that a higher level of H1° mRNA leads to a corresponding increase in H1° protein in adenomas.
Figure 3.
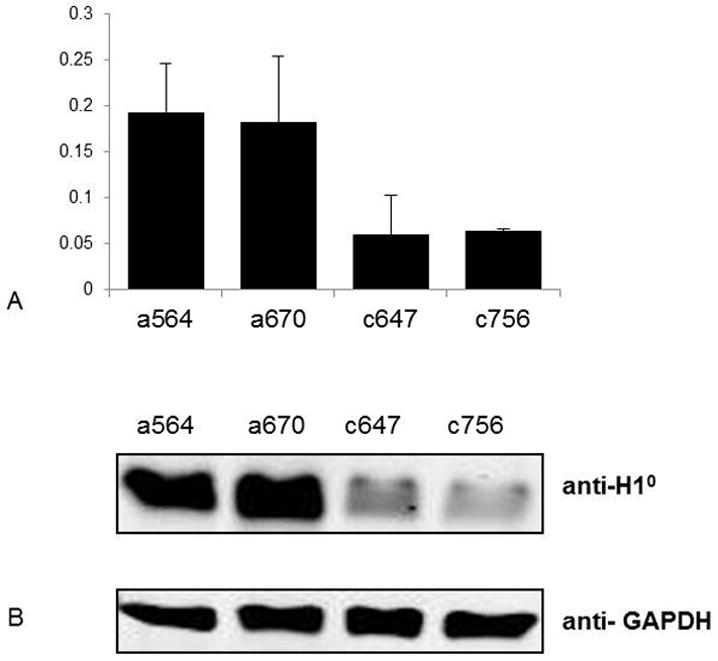
Reduced H1° expression in ovarian adenocarcinomas. (A) qRT-PCR analysis of H1° mRNA messages. Y axis: relative expression units of H1°. Expression values were normalized by the expression level of GAPDH. (B) Western blot analysis of H1° protein levels. GAPDH served as a loading control.
4.3. Expression patterns of histone H1 subtypes discriminate ovarian adenomas from adenocarcinomas
Expression profiling of H1 subtypes demonstrated that multiple H1 genes exhibit differential expression levels in adenocarcinomas compared with adenomas (Figure 1), suggesting characteristic H1 expression signatures associated with carcinogenesis. To determine whether H1 variant genes can serve as transcriptional classifier genes to discriminate ovarian adenomas from malignant adenocarcinomas, we performed hierarchical clustering analysis of expression patterns of the H1 genes for these 25 ovarian tumors. Figure 4 shows that the clustering algorithm segregated all 25 samples into adenomas and adenocarcinomas accurately based on the similarities of H1 subtype expression patterns in these samples. Expression patterns of H1 genes of all 11 adenomas were more closely related to each other, forming a group separately from that of adenocarcinomas, which also clustered in a group.
Figure 4.
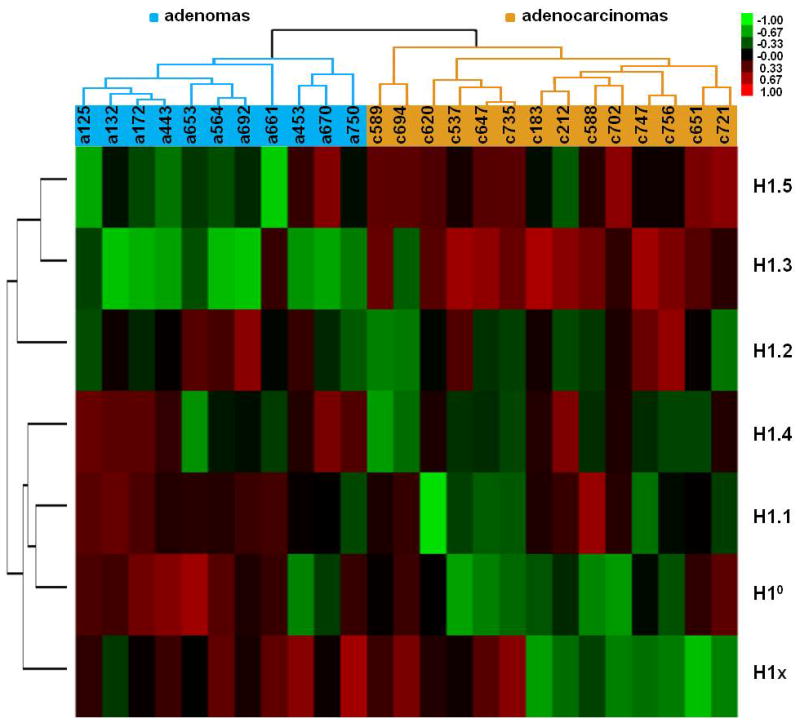
Hierarchical clustering diagram of differential expression data of 7 H1 subtypes in ovarian adenomas and adenocarcinomas. Red, green or black colors represent higher, lower, or no change in relative expression compared with the median expression level across all tumor samples, respectively. The dendrograms at the top and on the left show the clusters defined by similarities in expression patterns across the samples and genes. All adenocarcinoma samples cluster separately from adenomas.
To further test if analysis of mRNA expression patterns of H1 genes can predict ovarian adenomas vs. adenocarcinomas using these 25 tumor samples as templates, we obtained 8 additional tumor samples as a blind test set. We analyzed H1 expression levels by qRT-PCR, and performed hierarchical clustering analysis of these 8 samples together with the initial set of 25 samples. We clustered each blind test sample together with the 25 samples, and such analyses correctly clustered all but 1 (c821L) blind test samples into their corresponding tumor groups, representing an accuracy of 87.5% (7 out of 8) in discriminating adenomas vs. adenocarcinomas within this blind test set. Figure 5A shows a clustering diagram of all of the 33 samples analyzed, suggesting an overall accuracy of 97% (32 out of 33) in segregation of these two types of tumors. These results suggest that expression profiles of H1 variants can potentially serve as biomarkers to differentiate ovarian adenocarcinomas from adenomas. To identify the minimum number of H1 genes whose expression levels contribute to accurate prediction of clustering of tumor types, we re-clustered all of the 33 samples using expression patterns from any combinations of 6 H1 genes (leaving out one H1 gene at a time). Interestingly, as with clustering using all 7 H1 genes, leaving out H1° did not affect the correct discrimination of all samples but c821L (Figure 5B), whereas leaving out any of the 5 somatic H1s and H1x resulted in disruption of correct segregation of two or more tumor samples (data not shown).
Figure 5.
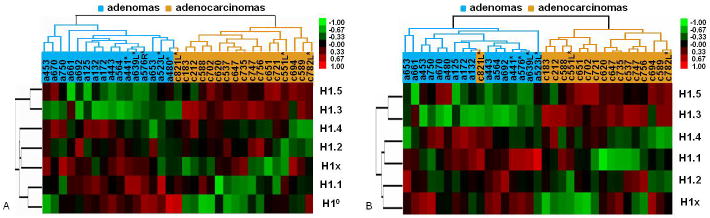
Validation of discriminating expression patterns of H1 subtypes in ovarian adenomas and adenocarcinomas. Hierarchical clustering diagrams of expression profile of all 7 H1 genes (A), or leaving out H1° (B), of all 33 samples are shown. Samples include 8 blind test samples (marked with *) and 25 tumors of the initial batch. Both (A) and (B) show correct segregation of all but one (c821L) samples into ovarian adenomas vs. adenocarcinomas.
5. DISCUSSION
Numerous gene expression microarray analyses show that malignant tumors exhibit distinct expression fingerprints compared to normal tissues or benign tumors (46–48). Changes in global and/or local chromatin structure contribute to the acquisition or maintenance of malignancy. Indeed, increased nuclear staining and nuclear size are often early cytological abnormalities found with dysplasia (49). The presence of multiple H1 histone variants provides an additional level of regulation in modulating chromatin folding, so it is likely that malignant transformation is associated with changes in the expression of various H1 subtypes. However, expression changes in mRNAs of histone genes are often missed from microarray profiling studies. This is because histone mRNAs, including that of most H1 genes, contain a stem-loop structure at their 3′ untranslated region (UTR) and lack a long polyA tail, and are thus not selected when oligo-dT based reverse transcription assays are adopted.
In the present study, we designed a set of qRT-PCR assays, coupling random primer based reverse transcription with real-time PCR, to quantitatively measure the expression of all H1 genes that are expressed in ovarian tumors. Using this set of assays, we initially analyzed a total of 25 ovarian tumors (11 adenomas and 14 adenocarcinomas), and found that benign ovarian adenomas and malignant adenocarcinomas have distinct expression patterns of several H1 genes. Specifically H1°, H1.1, H1.4 and H1x are significantly reduced in expression, whereas H1.3 has drastically increased expression in ovarian adenocarcinomas compared with adenomas. Furthermore, clustering analysis of gene expression of these 7 H1 genes or 6 H1 genes (leaving out H1°) segregates adenomas from adenocarcinomas with an overall accuracy of 97% for all 33 tumor samples (including 25 tumors of the initial batch and 8 samples of the blind test batch). These results suggest that H1 subtype genes display discriminative expression signatures which may serve as biomarkers and classifier genes to differentiate ovarian adenomas from adenocarcinomas. These highly sensitive and quantitative real-time RT-PCR assays can be an attractive alternative or auxiliary diagnostic tools to current pathological analysis. This possibility can be further investigated using a larger set of ovarian tumor samples. With a larger set of ovarian tumor samples, it will also be possible to examine if subgroups from clustering analysis correlate with tumor progression stages and/or patient prognosis.
Synthesis of somatic H1 subtypes (H1.1-H1.5) is primarily S-phase dependent, and the expression of H1 genes can be regulated at transcriptional level, post-transcriptional mRNA processing and stability, as well as protein degradation (23). Cell cycle arrest or terminal differentiation in cell culture causes a reduction in H1.1, H1.3, H1.5 mRNAs and a slight decrease of H1.2 and H1.4 mRNAs (23), thus, we surmise that an increased proliferation rate in malignant tumors may lead to a reduction of the total levels of somatic H1 mRNAs in these cells. Interestingly, careful quantification shows no difference in the combined levels of somatic H1 mRNAs (Figure 2B), instead, a change in the proportions of mRNAs from individual somatic H1 subtypes was observed in malignant adenocarcinomas compared with benign adenomas (Figure 1). Although the relative proportions of protein levels for individual H1s do not recapitulate their relative proportions of mRNA levels due to different mRNA processing efficiencies (50) and varied turn-over rate of H1 subtypes (22, 23, 51), for a specific H1 subtype, the increase or decrease in mRNA levels often leads to a corresponding change in its protein level (22, 23), as is the case for H1° shown in this study (Figure 3). We have previously observed similar fold increases in the levels of mRNAs and proteins of H1° and H1.5, in H1.2/H1.3/H1.4 triple null mouse ES cells and embryos ((12), and Zhang and Fan, unpublished observation). These studies suggest that changes in H1 subtype protein levels are likely to occur during ovarian tumor progression, and the trend of changes will probably follow the changes in the mRNA levels for a given H1 subtype. Individual somatic H1 subtypes have different DNA binding affinities and varying degrees of chromatin compacting ability (52–55), and they can be grouped into the strong condensers (H1.4 and H1.5), the intermediate condenser (H1.3) and the weak condensers (H1.1 and H1.2) in compacting minichromosomes (56). Thus, changes in the protein levels of individual somatic H1s are likely to cause alterations in chromatin folding and compaction, modulating chromatin accessibility and function.
It is noteworthy that clustering analysis using the expression levels of only 5 somatic H1 genes can segregate 23 of the initial 25 tumor samples correctly (92% accuracy) into adenomas vs. adenocarcinomas (data not shown), suggesting that the distinctive expression patterns of the somatic H1s (H1.1-H1.5) alone can discriminate ovarian adenocarcinomas from adenomas with high confidence. It will be interesting to investigate how these changes in the expression of specific H1 subtypes are brought about in malignant ovarian adenocarcinomas. Interestingly, leaving out H1.2 and H1.5, whose expression levels do not differ significantly in the two types to tumors, leads to incorrect segregation of more tumor samples by unsupervised clustering analysis (data not shown), significantly dampening the discriminative power of H1 profiling in classifying adenomas vs. adenocarcinomas. We postulate that there may be cross-regulation among the somatic H1 subtypes, and the mRNA levels of H1.2 and H1.5 are probably connected to the expression levels of the other H1 subtypes.
H1° mRNAs and proteins are significantly reduced in adenocarcinomas (Figure 1, Figure 3). H1° is considered to be a differentiation specific H1, as it accumulates in terminally differentiated and non-dividing cells (reviewed in (35)). H1° expression is low or undetectable in rapidly dividing cells or tissues, but is induced or upregulated during differentiation and senescence (22, 35, 57, 58). The significantly lower expression of H1° in ovarian adenocarcinomas is consistent with the higher proliferation rate of ovarian malignant adenocarcinomas compared with ovarian benign adenomas. As the smallest subtype with the highest percentage of positively charged amino acids among the H1 family proteins, H1° has high affinity for DNA and can strongly compact minichromosomes in vitro (56, 59). Thus, accumulation of H1° proteins would be consistent with an increased level of chromatin compaction and heterochromatin found in terminally differentiated cells (60). The reduction of H1° expression in ovarian adenocarcinomas observed in this study may indicate a reduced level of chromatin compaction in these malignant tumor cells.
Besides the potential of serving as biomarkers for discriminating ovarian adenocarcinomas vs. adenomas, the distinctive expression patterns of histone H1 subtypes may contribute to the causes for carcinogenesis of ovarian cancer. Alterations of H1 levels and chromatin compaction impact on a variety of cellular properties. Modulating levels of specific H1 subtypes can lead to changes in cell cycle and proliferation rate in a cell type specific and H1 subtype dependent manner (61, 62). Depletion of H1.2 in human breast cancer cell line T47D by inducible shRNA causes cell cycle arrest at G1-phase, although knockdown of other somatic H1 variants in T47D does not show similar effects on cell cycle (61). Interestingly, overexpression of H1°, but not H1.2, in mouse 3T3 cells, leads to a transient delay in S-phase entry (62). Although deletion of three somatic H1s, H1.2, H1.3 and H1.4, does not appear to affect cell growth rate in mouse ES cells (12), deletion of all 6 H1 genes in chicken B lymphocyte cell line DT40 significantly impairs cell growth and causes elongation of all stages of the cell cycle (63). Reduced expression of strong condensers, such as H1° and H1.4, combined with a marked increase of intermediate condenser (H1.3), may result in a more open and accessible chromatin conformation in ovarian adenocarcinomas. This is likely to cause expression changes of specific genes, which may contribute to carcinogenesis. On the other hand, it has been shown that degrees of global chromatin condensation per se impact on DNA damage response, cell migration and invasiveness (64–66). Global chromatin de-condensation, either by depletion of H1.2/H1.3/H1.4 in mouse ES cells or induced by treatment with histone deacetylase inhibitors (HDACi) in human breast cancer cell line MCF7, results in increased DNA damage response (64). Migration signals cause an increase in heterochromatin, and induction of chromatin de-condensation by HDACi in mouse melanoma cell line B16-F1 inhibits cell migration (66). Taken together, these studies indicate that the effects of H1 subtypes as well as the role of overall H1 levels and general chromatin condensation on cancer cell properties are multifaceted and context dependent. Our findings that distinctive expression patterns of H1 subtypes discriminate ovarian adenomas from adenocarcinomas extend the roles of H1 variants into ovarian cancer, and suggest that a further investigation of the functional roles of specific H1 subtypes in ovarian cancer cells is warranted.
Acknowledgments
This work is supported by Georgia Cancer Coalition Distinguished Cancer Clinicians and Scientists Program (YF), Ovarian Cancer Institute (JFM), NIH grant GM085261 (YF), and Georgia Tech. We thank L. DeEtte Walker for assistance in storage and handling of tumor samples.
Footnotes
“This is an, un-copyedited, author manuscript that has been accepted for publication in the Frontiers in Bioscience”. Cite this article as appearing in the Journal of Frontiers in Bioscience. Full citation can be found by searching the Frontiers in Bioscience (http://bioscience.org/search/authors/htm/search.htm) following publication and at PubMed (http://www.ncbi.nlm.nih.gov/entrez/query.fcgi?CMD=search&DB=pubmed) following indexing. This article may not be duplicated or reproduced, other than for personal use or within the rule of “Fair Use of Copyrighted Materials” (section 107, Title 17, U.S. Code) without permission of the copyright holder, the Frontiers in Bioscience. From the time of acceptance following peer review, the full final copy edited article of this manuscript will be made available at http://www.bioscience.org/. The Frontiers in Bioscience disclaims any responsibility or liability for errors or omissions in this version of the un-copyedited manuscript or in any version derived from it by the National Institutes of Health or other parties.”
References
- 1.Jemal A, Siegel R, Ward E, Hao Y, Xu J, Murray T, Thun MJ. Cancer statistics, 2008. CA Cancer J Clin. 2008;58:71–96. doi: 10.3322/CA.2007.0010. [DOI] [PubMed] [Google Scholar]
- 2.2010 http://documents.cancer.org/acs/groups/cid/documents/webcontent/003130-pdf.pdf.
- 3.Balch C, Fang F, Matei DE, Huang TH, Nephew KP. Minireview: epigenetic changes in ovarian cancer. Endocrinology. 2009;150:4003–11. doi: 10.1210/en.2009-0404. [DOI] [PMC free article] [PubMed] [Google Scholar]
- 4.Widschwendter M, Jiang G, Woods C, Muller HM, Fiegl H, Goebel G, Marth C, Muller-Holzner E, Zeimet AG, Laird PW, Ehrlich M. DNA hypomethylation and ovarian cancer biology. Cancer Res. 2004;64:4472–80. doi: 10.1158/0008-5472.CAN-04-0238. [DOI] [PubMed] [Google Scholar]
- 5.Kwon MJ, Kim SS, Choi YL, Jung HS, Balch C, Kim SH, Song YS, Marquez VE, Nephew KP, Shin YK. Derepression of CLDN3 and CLDN4 during ovarian tumorigenesis is associated with loss of repressive histone modifications. Carcinogenesis. 2010;31:974–83. doi: 10.1093/carcin/bgp336. [DOI] [PMC free article] [PubMed] [Google Scholar]
- 6.Cai KQ, Caslini C, Capo-chichi CD, Slater C, Smith ER, Wu H, Klein-Szanto AJ, Godwin AK, Xu XX. Loss of GATA4 and GATA6 expression specifies ovarian cancer histological subtypes and precedes neoplastic transformation of ovarian surface epithelia. PLoS One. 2009;4:e6454. doi: 10.1371/journal.pone.0006454. [DOI] [PMC free article] [PubMed] [Google Scholar]
- 7.Ozdag H, Teschendorff AE, Ahmed AA, Hyland SJ, Blenkiron C, Bobrow L, Veerakumarasivam A, Burtt G, Subkhankulova T, Arends MJ, Collins VP, Bowtell D, Kouzarides T, Brenton JD, Caldas C. Differential expression of selected histone modifier genes in human solid cancers. BMC Genomics. 2006;7:90. doi: 10.1186/1471-2164-7-90. [DOI] [PMC free article] [PubMed] [Google Scholar]
- 8.Wolffe AP. Chromatin: Structure and Function. Academic Press; San Diego, CA, San Diego, CA: 1998. [Google Scholar]
- 9.Woodcock CL, Skoultchi AI, Fan Y. Role of linker histone in chromatin structure and function: H1 stoichiometry and nucleosome repeat length. Chromosome Res. 2006;14:17–25. doi: 10.1007/s10577-005-1024-3. [DOI] [PubMed] [Google Scholar]
- 10.Vignali M, Workman JL. Location and function of linker histones. Nat Struct Biol. 1998;5:1025–8. doi: 10.1038/4133. [DOI] [PubMed] [Google Scholar]
- 11.Shen X, Gorovsky MA. Linker histone H1 regulates specific gene expression but not global transcription in vivo. Cell. 1996;86:475–83. doi: 10.1016/s0092-8674(00)80120-8. [DOI] [PubMed] [Google Scholar]
- 12.Fan Y, Nikitina T, Zhao J, Fleury TJ, Bhattacharyya R, Bouhassira EE, Stein A, Woodcock CL, Skoultchi AI. Histone H1 depletion in mammals alters global chromatin structure but causes specific changes in gene regulation. Cell. 2005;123:1199–212. doi: 10.1016/j.cell.2005.10.028. [DOI] [PubMed] [Google Scholar]
- 13.Bouvet P, Dimitrov S, Wolffe AP. Specific regulation of Xenopus chromosomal 5S rRNA gene transcription in vivo by histone H1. Genes & development. 1994;8:1147–59. doi: 10.1101/gad.8.10.1147. [DOI] [PubMed] [Google Scholar]
- 14.Gunjan A, Brown DT. Overproduction of histone H1 variants in vivo increases basal and induced activity of the mouse mammary tumor virus promoter. Nucleic Acids Res. 1999;27:3355–63. doi: 10.1093/nar/27.16.3355. [DOI] [PMC free article] [PubMed] [Google Scholar]
- 15.Lee H, Habas R, Abate-Shen C. MSX1 cooperates with histone H1b for inhibition of transcription and myogenesis. Science. 2004;304:1675–8. doi: 10.1126/science.1098096. [DOI] [PubMed] [Google Scholar]
- 16.Lee HL, Archer TK. Prolonged glucocorticoid exposure dephosphorylates histone H1 and inactivates the MMTV promoter. Embo J. 1998;17:1454–66. doi: 10.1093/emboj/17.5.1454. [DOI] [PMC free article] [PubMed] [Google Scholar]
- 17.Steinbach OC, Wolffe AP, Rupp RA. Somatic linker histones cause loss of mesodermal competence in Xenopus. Nature. 1997;389:395–9. doi: 10.1038/38755. [DOI] [PubMed] [Google Scholar]
- 18.Ushinsky SC, Bussey H, Ahmed AA, Wang Y, Friesen J, Williams BA, Storms RK. Histone H1 in Saccharomyces cerevisiae. Yeast. 1997;13:151–61. doi: 10.1002/(SICI)1097-0061(199702)13:2<151::AID-YEA94>3.0.CO;2-5. [DOI] [PubMed] [Google Scholar]
- 19.Veron M, Zou Y, Yu Q, Bi X, Selmi A, Gilson E, Defossez PA. Histone H1 of Saccharomyces cerevisiae inhibits transcriptional silencing. Genetics. 2006;173:579–87. doi: 10.1534/genetics.105.050195. [DOI] [PMC free article] [PubMed] [Google Scholar]
- 20.Kim K, Choi J, Heo K, Kim H, Levens D, Kohno K, Johnson EM, Brock HW, An W. Isolation and characterization of a novel H1.2 complex that acts as a repressor of p53-mediated transcription. The Journal of biological chemistry. 2008;283:9113–26. doi: 10.1074/jbc.M708205200. [DOI] [PMC free article] [PubMed] [Google Scholar]
- 21.Happel N, Doenecke D. Histone H1 and its isoforms: contribution to chromatin structure and function. Gene. 2009;431:1–12. doi: 10.1016/j.gene.2008.11.003. [DOI] [PubMed] [Google Scholar]
- 22.Lennox RW, Cohen LH. The histone H1 complements of dividing and nondividing cells of the mouse. The Journal of biological chemistry. 1983;258:262–8. [PubMed] [Google Scholar]
- 23.Wang ZF, Sirotkin AM, Buchold GM, Skoultchi AI, Marzluff WF. The mouse histone H1 genes: gene organization and differential regulation. J Mol Biol. 1997;271:124–38. doi: 10.1006/jmbi.1997.1166. [DOI] [PubMed] [Google Scholar]
- 24.Rabini S, Franke K, Saftig P, Bode C, Doenecke D, Drabent B. Spermatogenesis in mice is not affected by histone H1.1 deficiency. Exp Cell Res. 2000;255:114–124. doi: 10.1006/excr.1999.4767. [DOI] [PubMed] [Google Scholar]
- 25.Fan Y, Skoultchi AI. Genetic analysis of H1 linker histone subtypes and their functions in mice. Methods Enzymol. 2004;377:85–107. doi: 10.1016/S0076-6879(03)77005-0. [DOI] [PubMed] [Google Scholar]
- 26.Fan Y, Sirotkin A, Russell RG, Ayala J, Skoultchi AI. Individual somatic H1 subtypes are dispensable for mouse development even in mice lacking the H1(0) replacement subtype. Mol Cell Biol. 2001;21:7933–43. doi: 10.1128/MCB.21.23.7933-7943.2001. [DOI] [PMC free article] [PubMed] [Google Scholar]
- 27.Fan Y, Nikitina T, Morin-Kensicki EM, Zhao J, Magnuson TR, Woodcock CL, Skoultchi AI. H1 linker histones are essential for mouse development and affect nucleosome spacing in vivo. Mol Cell Biol. 2003;23:4559–72. doi: 10.1128/MCB.23.13.4559-4572.2003. [DOI] [PMC free article] [PubMed] [Google Scholar]
- 28.Fan Y, Braut SA, Lin Q, Singer RH, Skoultchi AI. Determination of transgenic loci by expression FISH. Genomics. 2001;71:66–9. doi: 10.1006/geno.2000.6403. [DOI] [PubMed] [Google Scholar]
- 29.Lin Q, Inselman A, Han X, Xu H, Zhang W, Handel MA, Skoultchi A. Reduction in linker histone levels are tolarated in developing spermatocyttes but cause changes in specific gene expression. J Biol Chem. 2004;279:23525–23535. doi: 10.1074/jbc.M400925200. [DOI] [PubMed] [Google Scholar]
- 30.Yamamoto T, Horikoshi M. Cloning of the cDNA encoding a novel subtype of histone H1. Gene. 1996;173:281–5. doi: 10.1016/0378-1119(96)00020-0. [DOI] [PubMed] [Google Scholar]
- 31.Happel N, Schulze E, Doenecke D. Characterisation of human histone H1x. Biol Chem. 2005;386:541–51. doi: 10.1515/BC.2005.064. [DOI] [PubMed] [Google Scholar]
- 32.Stoldt S, Wenzel D, Schulze E, Doenecke D, Happel N. G1 phase-dependent nucleolar accumulation of human histone H1x. Biol Cell. 2007;99:541–52. doi: 10.1042/bc20060117. [DOI] [PubMed] [Google Scholar]
- 33.Takata H, Matsunaga S, Morimoto A, Ono-Maniwa R, Uchiyama S, Fukui K. H1.X with different properties from other linker histones is required for mitotic progression. FEBS Lett. 2007;581:3783–8. doi: 10.1016/j.febslet.2007.06.076. [DOI] [PubMed] [Google Scholar]
- 34.Warneboldt J, Haller F, Horstmann O, Danner BC, Fuzesi L, Doenecke D, Happel N. Histone H1x is highly expressed in human neuroendocrine cells and tumours. BMC Cancer. 2008;8:388. doi: 10.1186/1471-2407-8-388. [DOI] [PMC free article] [PubMed] [Google Scholar]
- 35.Zlatanova J, Doenecke D. Histone H1 zero: a major player in cell differentiation? FASEB J. 1994;8:1260–8. doi: 10.1096/fasebj.8.15.8001738. [DOI] [PubMed] [Google Scholar]
- 36.Tanaka M, Hennebold JD, Macfarlane J, Adashi EY. A mammalian oocyte-specific linker histone gene H1oo: homology with the genes for the oocyte-specific cleavage stage histone (cs-H1) of sea urchin and the B4/H1M histone of the frog. Development (Cambridge, England) 2001;128:655–64. doi: 10.1242/dev.128.5.655. [DOI] [PubMed] [Google Scholar]
- 37.Lennox RW, Cohen LH. The alterations in H1 histone complement during mouse spermatogenesis and their significance for H1 subtype function. Developmental biology. 1984;103:80–4. doi: 10.1016/0012-1606(84)90009-5. [DOI] [PubMed] [Google Scholar]
- 38.Yan W, Ma L, Burns KH, Matzuk MM. HILS1 is a spermatid-specific linker histone H1-like protein implicated in chromatin remodeling during mammalian spermiogenesis. Proc Natl Acad Sci U S A. 2003;100:10546–51. doi: 10.1073/pnas.1837812100. [DOI] [PMC free article] [PubMed] [Google Scholar]
- 39.Martianov I, Brancorsini S, Catena R, Gansmuller A, Kotaja N, Parvinen M, Sassone-Corsi P, Davidson I. Polar nuclear localization of H1T2, a histone H1 variant, required for spermatid elongation and DNA condensation during spermiogenesis. Proc Natl Acad Sci U S A. 2005;102:2808–13. doi: 10.1073/pnas.0406060102. [DOI] [PMC free article] [PubMed] [Google Scholar]
- 40.Becker M, Becker A, Miyara F, Han Z, Kihara M, Brown DT, Hager GL, Latham K, Adashi EY, Misteli T. Differential in vivo binding dynamics of somatic and oocyte-specific linker histones in oocytes and during ES cell nuclear transfer. Mol Biol Cell. 2005;16:3887–95. doi: 10.1091/mbc.E05-04-0350. [DOI] [PMC free article] [PubMed] [Google Scholar]
- 41.Bell DA. Origins and molecular pathology of ovarian cancer. Mod Pathol. 2005;18(Suppl 2):S19–32. doi: 10.1038/modpathol.3800306. [DOI] [PubMed] [Google Scholar]
- 42.Gorka C, Brocard MP, Curtet S, Khochbin S. Differential recognition of histone H10 by monoclonal antibodies during cell differentiation and the arrest of cell proliferation. The Journal of biological chemistry. 1998;273:1208–15. doi: 10.1074/jbc.273.2.1208. [DOI] [PubMed] [Google Scholar]
- 43.Eisen MB, Spellman PT, Brown PO, Botstein D. Cluster analysis and display of genome-wide expression patterns. Proc Natl Acad Sci U S A. 1998;95:14863–8. doi: 10.1073/pnas.95.25.14863. [DOI] [PMC free article] [PubMed] [Google Scholar]
- 44.Alonso A, Breuer B, Bouterfa H, Doenecke D. Early increase in histone H1(0) mRNA during differentiation of F9 cells to parietal endoderm. EMBO J. 1988;7:3003–8. doi: 10.1002/j.1460-2075.1988.tb03163.x. [DOI] [PMC free article] [PubMed] [Google Scholar]
- 45.Cheng GH, Skoultchi AI. Rapid induction of polyadenylated H1 histone mRNAs in mouse erythroleukemia cells is regulated by c-myc. Mol Cell Biol. 1989;9:2332–40. doi: 10.1128/mcb.9.6.2332. [DOI] [PMC free article] [PubMed] [Google Scholar]
- 46.Zhu CQ, Pintilie M, John T, Strumpf D, Shepherd FA, Der SD, Jurisica I, Tsao MS. Understanding prognostic gene expression signatures in lung cancer. Clin Lung Cancer. 2009;10:331–40. doi: 10.3816/CLC.2009.n.045. [DOI] [PubMed] [Google Scholar]
- 47.Quackenbush J. Microarray analysis and tumor classification. N Engl J Med. 2006;354:2463–72. doi: 10.1056/NEJMra042342. [DOI] [PubMed] [Google Scholar]
- 48.Alizadeh AA, Eisen MB, Davis RE, Ma C, Lossos IS, Rosenwald A, Boldrick JC, Sabet H, Tran T, Yu X, Powell JI, Yang L, Marti GE, Moore T, Hudson J, Jr, Lu L, Lewis DB, Tibshirani R, Sherlock G, Chan WC, Greiner TC, Weisenburger DD, Armitage JO, Warnke R, Levy R, Wilson W, Grever MR, Byrd JC, Botstein D, Brown PO, Staudt LM. Distinct types of diffuse large B-cell lymphoma identified by gene expression profiling. Nature. 2000;403:503–11. doi: 10.1038/35000501. [DOI] [PubMed] [Google Scholar]
- 49.Weinberg RA. Garland Science. Taylor & Francis Group, LLC; New York: 2007. The Biology of Cancer. [Google Scholar]
- 50.Bond UM, Yario TA, Steitz JA. Multiple processing-defective mutations in a mammalian histone pre-mRNA are suppressed by compensatory changes in U7 RNA both in vivo and in vitro. Genes & development. 1991;5:1709–22. doi: 10.1101/gad.5.9.1709. [DOI] [PubMed] [Google Scholar]
- 51.Pehrson JR, Cole RD. Histone H1 subfractions and H10 turnover at different rates in nondividing cells. Biochemistry. 1982;21:456–60. doi: 10.1021/bi00532a006. [DOI] [PubMed] [Google Scholar]
- 52.Th’ng JP, Sung R, Ye M, Hendzel MJ. H1 family histones in the nucleus Control of binding and localization by the C-terminal domain. The Journal of biological chemistry. 2005;280:27809–14. doi: 10.1074/jbc.M501627200. [DOI] [PubMed] [Google Scholar]
- 53.Talasz H, Sapojnikova N, Helliger W, Lindner H, Puschendorf B. In vitro binding of H1 histone subtypes to nucleosomal organized mouse mammary tumor virus long terminal repeat promotor. The Journal of biological chemistry. 1998;273:32236–43. doi: 10.1074/jbc.273.48.32236. [DOI] [PubMed] [Google Scholar]
- 54.Orrego M, Ponte I, Roque A, Buschati N, Mora X, Suau P. Differential affinity of mammalian histone H1 somatic subtypes for DNA and chromatin. BMC Biol. 2007;5:22. doi: 10.1186/1741-7007-5-22. [DOI] [PMC free article] [PubMed] [Google Scholar]
- 55.Khadake JR, Rao MR. DNA- and chromatin-condensing properties of rat testes H1a and H1t compared to those of rat liver H1bdec; H1t is a poor condenser of chromatin. Biochemistry. 1995;34:15792–801. doi: 10.1021/bi00048a025. [DOI] [PubMed] [Google Scholar]
- 56.Clausell J, Happel N, Hale TK, Doenecke D, Beato M. Histone H1 subtypes differentially modulate chromatin condensation without preventing ATP-dependent remodeling by SWI/SNF or NURF. PLoS One. 2009;4:e0007243. doi: 10.1371/journal.pone.0007243. [DOI] [PMC free article] [PubMed] [Google Scholar]
- 57.Gabrilovich DI, Cheng P, Fan Y, Yu B, Nikitina E, Sirotkin A, Shurin M, Oyama T, Adachi Y, Nadaf S, Carbone DP, Skoultchi AI. H1(0) histone and differentiation of dendritic cells. A molecular target for tumor-derived factors. J Leukoc Biol. 2002;72:285–96. [PubMed] [Google Scholar]
- 58.Sekeri-Pataryas KE, Sourlingas TG. The differentiation-associated linker histone, H1.0, during the in vitro aging and senescence of human diploid fibroblasts. Ann N Y Acad Sci. 2007;1100:361–7. doi: 10.1196/annals.1395.039. [DOI] [PubMed] [Google Scholar]
- 59.De S, Brown DT, Lu ZH, Leno GH, Wellman SE, Sittman DB. Histone H1 variants differentially inhibit DNA replication through an affinity for chromatin mediated by their carboxyl-terminal domains. Gene. 2002;292:173–81. doi: 10.1016/s0378-1119(02)00675-3. [DOI] [PubMed] [Google Scholar]
- 60.Grigoryev SA, Bulynko YA, Popova EY. The end adjusts the means: heterochromatin remodelling during terminal cell differentiation. Chromosome Res. 2006;14:53–69. doi: 10.1007/s10577-005-1021-6. [DOI] [PubMed] [Google Scholar]
- 61.Sancho M, Diani E, Beato M, Jordan A. Depletion of human histone H1 variants uncovers specific roles in gene expression and cell growth. PLoS Genet. 2008;4:e1000227. doi: 10.1371/journal.pgen.1000227. [DOI] [PMC free article] [PubMed] [Google Scholar]
- 62.Brown DT, Alexander BT, Sittman DB. Differential effect of H1 variant overexpression on cell cycle progression and gene expression. Nucleic Acids Res. 1996;24:486–93. doi: 10.1093/nar/24.3.486. [DOI] [PMC free article] [PubMed] [Google Scholar]
- 63.Hashimoto H, Takami Y, Sonoda E, Iwasaki T, Iwano H, Tachibana M, Takeda S, Nakayama T, Kimura H, Shinkai Y. Histone H1 null vertebrate cells exhibit altered nucleosome architecture. Nucleic Acids Res. 2010;38:3533–45. doi: 10.1093/nar/gkq076. [DOI] [PMC free article] [PubMed] [Google Scholar]
- 64.Murga M, Jaco I, Fan Y, Soria R, Martinez-Pastor B, Cuadrado M, Yang SM, Blasco MA, Skoultchi AI, Fernandez-Capetillo O. Global chromatin compaction limits the strength of the DNA damage response. J Cell Biol. 2007;178:1101–8. doi: 10.1083/jcb.200704140. [DOI] [PMC free article] [PubMed] [Google Scholar]
- 65.Gerlitz G, Bustin M. The role of chromatin structure in cell migration. Trends Cell Biol. 2010 doi: 10.1016/j.tcb.2010.09.002. [DOI] [PMC free article] [PubMed] [Google Scholar]
- 66.Gerlitz G, Bustin M. Efficient cell migration requires global chromatin condensation. J Cell Sci. 2010;123:2207–17. doi: 10.1242/jcs.058271. [DOI] [PMC free article] [PubMed] [Google Scholar]