

Abstract
A critical challenge of the postgenomic era is to understand how genes are differentially regulated. Genetic and genomic approaches have been used successfully to assign genes to distinct regulatory networks in both prokaryotes and eukaryotes. However, little is known about what determines the differential expression of genes within a particular network, even when it involves a single transcription factor. The fact that coregulated genes may be differentially expressed suggests that subtle differences in the shared cis-acting regulatory elements are likely to be significant. This chapter describes a method, termed gene promoter scan (GPS), that discriminates among coregulated promoters by simultaneously considering a variety of cis-acting regulatory features. Application of this method to the PhoP/PhoQ two-component regulatory system of Escherichia coli and Salmonella enterica uncovered novel members of the PhoP regulon, as well as regulatory interactions that had not been discovered using previous approaches. The predictions made by GPS were validated experimentally to establish that the PhoP protein uses multiple mechanisms to control gene transcription and is a central element in a highly connected network.
Introduction
The two-component system constitutes a major form of bacterial signal transduction. Typically, a two-component system consists of a sensor kinase that responds to a specific signal by modifying the phosphorylated state of a cognate response regulator. The majority of response regulators are DNA-binding proteins that modulate gene transcription. Because the phosphorylated form of the response regulator binds to target promoters with higher affinity than the unphosphorylated one, sensor-promoted changes in the phosphorylated state of a response regulator can have a profound impact in the gene expression profile of an organism.
Genomic analysis revealed that there is a direct correlation between genome size and the number of two-component systems present in a given bacterial species. In addition, organisms that live in varied environments tend to have a larger number of two-component systems than those that occupy a single environment. For example, the aphid endosymbiont Buchnera aphidicola has a genome size of approximately 640 kb that does not encode two-component systems (Shigenobu et al., 2000). In contrast, Escherichia coli has a genome size of 4.5 Mb encoding 30 such systems (Blattner et al., 1997), and the environmental microbe and opportunistic pathogen Pseudomonas aeruginosa, with a genome size of 6.3 Mb, harbors 118 two-component system proteins (Stover et al., 2000).
The number of targets that a response regulator controls varies among the different systems found in a given bacterial species and between homologous systems in related bacterial species. In E. coli, for example, the response regulator KdpD appears to govern transcription of a single promoter, whereas the response regulator ArcA modulates expression of >30 operons (Georgellis et al., 1999; Salgado et al., 2004). Because the products encoded by the multiple targets of regulation of a response regulator such as ArcA are likely required in different amounts and/or for different extents of time, the corresponding genes must differ in their cis-acting promoter sequences responsible for the distinct gene expression patterns of individual members of a regulon (i.e., a group of genes that is coordinately regulated by a regulatory protein). The analysis of coregulated genes is complicated by the fact that two-component systems can control gene expression indirectly by modulating the expression and/or activity of other two-component systems, transcriptional regulators, and sigma factors. Moreover, the targets of regulation of orthologous response regulators overlap only partially in closely related species such as Salmonella and E. coli, suggesting that small changes in the amino acid sequence of a response regulator and/or in cis-acting promoter features can have a big impact on gene regulation. Cumulatively, these issues highlight the need for methods that identify the critical elements of a promoter determining gene expression and that are not heavily dependent on sequence conservation such as phylogenetic footprinting methods (Manson McGuire and Church, 2000).
The material required for analyzing the promoter features governing bacterial gene expression is widely available. It consists of genome sequences (often of multiple isolates of a given bacterial species), genome-wide transcription data (typically obtained using microarrays), and biological databases containing examples of previously explored cases. However, it is not yet possible to scan a bacterial genome sequence and readily predict the expression behavior of genes belonging to a regulon. In principle, coregulated genes could be differentiated by incorporating into the analysis quantitative and kinetic measurements of gene expression (Ronen et al., 2002) and/or considering the participation of other transcription factors (Bar-Joseph et al., 2003; Beer and Tavazoie, 2004; Conlon et al., 2003). However, there are constraints in such analyses due to systematic errors in microarray experiments, the extra work required to obtain kinetic data, and the missing information about additional signals impacting on gene expression. These constraints hitherto only allow a relatively crude classification of gene expression patterns into a limited number of classes (e.g., up-and downregulated genes [Oshima et al., 2002; Tucker et al., 2002]).
This chapter discusses a methodology designed to identify and classify promoters that are coregulated by a bacterial transcriptional regulator, such as the response regulators of two-component systems. This methodology, termed gene promoter scan (GPS), groups promoters sharing distinct sets of promoter features to generate groupings that may reflect biological properties of a system under investigation such as the time and place that a promoter is activated or silenced.
We have applied the GPS method to investigate the targets of regulation of the response regulator PhoP, which together with the sensor kinase PhoQ form a two-component system that is a major regulator of virulence and of the adaptation to low Mg2+ environments in several gram-negative species (Groisman, 2001). The PhoQ protein responds to the levels of extracytoplasmic Mg2+ by modifying the phosphorylated state of the DNA-binding protein PhoP (Castelli et al., 2000; Chamnongpol et al., 2003; Montagne et al., 2001). The PhoP/PhoQ system is a particularly interesting case study because (1) it controls the expression of a large number of genes, amounting to approximately 3% of the genes in the case of Salmonella (Zwir et al., 2005). (2) Promoters harboring a binding site for the PhoP protein may differ in the distance and orientation of the PhoP box relative to the RNA polymerase-binding site, as well as in other promoter features. (3) PhoP also controls gene expression indirectly by regulating the expressionand/or activity of other two-component systems at the transcriptional (e.g., RstA/RstB) (Minagawa et al., 2003), posttranscriptional (e.g., SsrB/SpiR) (Bijlsma and Groisman, 2005), and posttranslational (e.g., PmrA/PmrB) (Kato and Groisman, 2004) levels. In addition, PhoP regulates the levels of the alternative σ factor RpoS (Tu et al., 2006) and participates in a feed-forward loop with the regulatory protein SlyA (Shi et al., 2004) (Fig. 1).
Fig. 1.

The PhoP/PhoQ system uses a variety of mechanisms to control the expression of a large number of genes in a direct or indirect fashion. (A) The PhoP protein recognizes a direct hexanucleotide repeat separated by five nucleotides, which has been termed the PhoP box, activating the mgtA promoter of Salmonella. (B) The PhoP/PhoQ uses a transcriptional cascade mediated by the SsrB/SpiR two-component system to regulate the spiC promoter. (C) The PhoP/PhoQ system works cooperatively with the RcsB/RcsC system to activate the ugd promoter. (D) The PhoP/PhoQ system utilizes a feed-forward loop mediated by the SlyA protein to activate the ugtL promoter in Salmonella. (E) The PhoP/PhoQ system controls the pbgP promoter at the posttranslational level, where the PhoP-dependent PmrD protein activates the regulatory protein PmrA.
Challenge of Identifying Promoter Features Governing Gene Transcription
Identification of the promoter features that determine the distinct expression behavior of coregulated genes is a challenging task because of the difficulty in ascertaining the role that subtle differences in shared cis-acting regulatory elements of coregulated promoters play in gene transcription. Therefore, approaches that homogenize features among promoters (e.g., relying on consensuses to describe the various promoter features) and even across species can hamper the discovery of key differences that distinguish promoters coregulated by the same transcriptional regulator. For example, methods that look for matching of a sequence to a consensus have been successfully used to identify promoters controlled by particular transcription factors (Bailey and Elkan, 1995; Martinez-Antonio and Collado-Vides, 2003; Stormo, 2000). Although these methods often increase specificity, their strict cutoffs decrease sensitivity (Hertz and Stormo, 1999; Stormo, 2000), which makes it difficult to detect binding sites with a weak resemblance to a consensus sequence. The complexity of the analysis is exacerbated by the need to consider other sequence elements relevant to differential expression patterns, including the class and location of the RNA polymerase, the presence of binding sites for other transcription factors, and their topological location in the DNA (Beer and Tavazoie, 2004; Pritsker et al., 2004). Indeed, similar expression patterns can be generated from different features or a mixture of multiple underlying features, thus making it more difficult to discern the molecular basis for analogous gene expression.
GPS Methodology as an Integrated Algorithm
The increased availability of biological information, such as genome sequences, microarray gene expression, as well as text data stored in public databases, and knowledge-discovery techniques (or data mining) is used to currently generate hypotheses that need to be evaluated. For example, when groups of coregulated transcripts are identified by clustering the expression patterns generated by a series of microarray experiments, the promoter sequences for each transcript in a cluster may be fed to a motif discovery algorithm to find common elements implicated in transcriptional regulation among coexpressed genes. These approaches incorporate knowledge in a decision-making cascade that can be summarized as follows: find genes with similar expression patterns and then see if they have similar promoters (Holmes and Bruno, 2000).
Most of the available algorithms implemented by the approaches described earlier base their decision in cutoffs that constrain one analysis stage on the previous one. Therefore, the analysis is hampered by the need to decide whether to consider first gene expression data or promoter features. In addition, the analysis is complicated because of the noisy nature of microarray data, the possibility of cryptic promoter elements contributing to gene expression, the potential for interaction among regulatory proteins, and the existence of alternative modes of transcription regulation, which remain poorly understood.
There are simple algorithms that ignore the constraints just listed, which appear to generate interesting results and be of practical benefits (Tavazoie et al., 1999). However, identification of the promoter features that determine the distinct expression behavior of coregulated genes within a regulon requires a more detailed and integrated analysis of the regulatory features. Why is it useful to have an integrated model? One reason is that cascade algorithms and integrated algorithms are solving subtly different problems. In contrast to cascade algorithms, integrated algorithms can be summarized as finding clusters of genes that have (a) similar expression patterns and (b) similar promoters (Holmes and Bruno, 2000).
The gene promoter scan is a machine learning method (Cheeseman and Oldford, 1994; Cook et al., 2001; Cooper and Herskovits, 1992) that identifies, differentiates, and groups sets of coregulated promoters by simultaneously considering multiple cis-acting regulatory features and gene expression (Fig. 2). GPS carries out an exhaustive description of cis-acting regulatory features, including the orientation, location, and number of binding sites for a regulatory protein, the presence of binding site submotifs, and the class and number of RNA polymerase sites (Fig. 3).
Fig. 2.

The GPS method. GPS is a machine learning technique that models promoter features as well as relations between them, uses them to describe promoters, combines such characterized promoters into groups termed profiles, evaluates the resulting profiles to select the most significant ones, and performs genome-wide predictions based on such profiles. To accomplish this task, GPS carries out three basic operations: grouping observations from the data set; prototyping such groups into their most representative elements (centroid); and searching in the set of optimal solutions (i.e., Pareto optimal frontier) to retrieve the most relevant profiles, which are used to describe and identify new objects by similarity with the prototypes.
Fig. 3.

Schematics of PhoP-regulated promoters harboring different features analyzed by GPS. GPS performs an integrated analysis of promoter regulatory features, initially focusing on six types of features for describing a training set of promoters: submotifs, which model the studied transcription factor-binding motifs; RNA pol sites, which characterize the RNA polymerase motif, the class of σ70 promoter that differentiates class I from class II promoters, and the distance distributions (close, medium, and remote) between RNA polymerase and transcription factor-binding sites in activated and repressed promoters; activated/repressed, where we learn activation and repression distributions by compiling distances between binding sites for RNA polymerase and a transcription factor; interactions, where we evaluate motifs for several transcription factor-binding sites and model the distance distributions between motifs colocated in the same promoter regions; and expression, which considers gene expression levels.
The GPS method is specifically aimed at handling the variability in sequence, location, and topology that characterize gene transcription. Instead of using an overall consensus model for a feature, where potentially relevant differences are often concealed because of intrinsic averaging operations between promoters and even across species, we decompose a feature into a family of models or building blocks. This approach maximizes the sensitivity of detecting those instances that weakly resemble a consensus (e.g., binding site sequences) without decreasing the specificity. In addition, features are considered using fuzzy assignments (i.e., not precisely defined) instead of categorical entities (Bezdek, 1998; Gasch and Eisen, 2002; Ruspini and Zwir, 2002), which allow us to encode how well a particular sequence matches each of the multiple models for a given promoter feature. Individual features are then linked into more informative composite models that can be used to explain the kinetic expression behavior of genes.
It should be noted that GPS treats each of the promoter features with equal weight because it is not known beforehand which features are important. To circumvent limitations imposed by relatively few classes of gene expression levels to cis-acting features, the GPS method treats gene expression data as one feature among many (as opposed to testing it as a dependent vaiable). The various features are analyzed concurrently and recurrent relations are recognized to generate profiles, which are groups of promoters having features in common.GPS uses an unsupervised strategy (i.e., preexisting examples are not required), as well as multiobjective optimization techniques, which enhance the likelihood of recovering all optimal feature associations rather than potentially biased subsets (Deb, 2001; Ruspini and Zwir, 2002). The resulting profiles group promoters thatmay share underlying biological properties.
Exploring Targets of Regulation of a Response Regulator Using GPS
GPS Built-in Features
The GPS method performs an integrated analysis of promoter regulatory features to identify profiles, which are sets of promoters described by common sets of features. We initially focused on six types of features for describing a training set of promoters (Bar-Joseph et al., 2003; Beer and Tavazoie, 2004; Li et al., 2002; Zwir et al., 2005b): submotifs, which model the studied transcription factor-binding motifs; orientation, which characterizes the binding boxes as either in direct or opposite orientation relative to the open reading frame; RNA pol sites, which characterize the RNA polymerase motif (Cotik et al., 2005), the class of σ70 promoter (Romero Zaliz et al., 2004) that differentiates class I from class II promoters, and distance distributions (close, medium, and remote) between RNA polymerase and transcription factor-binding sites in activated and repressed promoters (Salgado et al., 2004); activated/repressed, where we learn activation and repression distributions by compiling distances between binding sites for RNA polymerase and a transcription factor; interactions, where we evaluate motifs for several transcription factor-binding sites and model the distance distributions between motifs colocated in the same promoter regions; and expression, which considers gene expression levels.
GPS Initialization Strategy
The GPS method takes a list of candidate genes obtained from the literature, gene expression experiments (e.g., microarray, ChiP, or RT-PCR), or user-based hypothesis and generates initial profiles of each individual type of feature. The generation of initial profiles increases the sensitivity of a feature without decreasing its specificity (Zwir et al., 2005a). This distinguishes GPS from methods relying on a single consensus, which often fail to describe and retrieve potentially interesting candidates that exhibit a weak resemblance to an average consensus pattern, which may be construed as a gene being indirectly regulated by a transcription factor (Zwir et al., 2005b).
Input data should be specified according to each type of feature, that is, DNA sequences for the submotifs and, if available, gene expression levels for the expression (see online manual at http://gps-tools.wustl.edu). The initial models for each feature can also be provided by the user. For example, GPS uses position weight matrices generated by the Consensus/Patser method (Stormo, 2000), but also can accept any other built-in matrix generated from other methods (Tompa et al., 2005). Indeed, the number of profiles can be a priori specified or calculated automatically using the Xie-Beni index (Zwir et al., 2005a). Although the specifications of these initial conditions are crucial for clustering algorithms (Bezdek et al., 1992), they are not critical for GPS and can be solved later by the dynamic approach followed by the method (Zwir et al., 2005a).
Two or more promoter regions containing different binding sites for a given transcription factor are considered as distinct instances, which can be later associated by the method as more features become incorporated into the analysis. Indeed, GPS considers promoters independently of phylogenetic conservation. Therefore, after dissecting direct and indirect regulation, each instance in the database is constrained to a promoter region where a binding site motif of the studied transcription factor is found. Several features describe promoters exhibiting a binding site of the studied transcription factor. For example, one or more RNA polymerase-binding sites can be predicted around that site, which can be class I or II and located at different distances termed close, medium, or remote. The subjacent models for these features were learned from experimental examples provided by the RegulonDB database (Salgado et al., 2004). However, we generated predictions from raw data rather than using original data present in RegulonDB. Additionally, GPS characterizes binding sites for a transcription factor as participating in either activation or repression by evaluating their distance from the RNA polymerase site. In this way, GPS establishes relationships between the different binding sites and their topology in a promoter region. Finally, because the expression is considered as one feature among many, promoters can be analyzed in the absence of expression data.
One of the most salient properties of the strategy followed by GPS to encode features is the use of metadata. Thus, GPS can encode features as fuzzy data (i.e., not precisely defined) instead of categorical entities (Bezdek, 1998; Gasch and Eisen, 2002; Ruspini and Zwir, 2002), where a promoter instance can be related to more than one model. This captures the variability that exists in biological systems and delays the grouping of promoters until more information (i.e., features) is added. For example, a sequence corresponding to a transcription factor-binding site can be initially similar to both submotif M1 and submotif M2. Later, it could be assigned to a profile containing M1 after adding the orientation and the RNA pol site features. Moreover, new intermediate profiles can be generated by taking advantage of the implementation of the profiles as dynamic fuzzy clusters (Bezdek, 1998).
The GPS method also uses metadata to analyze composite features. It could be the case, for example, that two or more features would not be independent of each other. Thus, GPS joins them by using fuzzy predicates [i.e., such as P(A and B) in a probabilistic interpretation]. Indeed, the distance between binding sites for RNA polymerase and for a transcription factor is meaningless if one does not consider the occurrences of the sites.
GPS Grouping Strategy
The GPS method performs an exhaustive combination of the features, which are dynamically rediscretized at each level of a lattice searching space (Fig. 4). The method allows reassignations of observations between sibling profiles, thereby solving initial misspecifications and allowing to identify cohesive sets of promoters in environments with reduced data sets and high levels of uncertainty. For example, a promoter that initially resembles both and submotifs and is initially assigned to can later be reassigned to in a level 3 profile . This happens because, unlike hierarchical clustering, GPS allows movement between sibling profiles and dynamically reformulates the initial discretization of the profiles (Zwir et al., 2005a) (Fig. 5).
Fig. 4.

Using GPS to build promoter profiles. GPS generation of the profile is shown here. It partially corresponds to the highlighted substructure of the lattice shown in Fig. 5. GPS starts by using information from databases and microarray data to construct a family of models for each feature (e.g., expression levels E1 to E3, PhoP box submotif M1 to M4, as well as other features [not shown]). The promoters are described using the modeled features, the degree of matching between features and promoters being encoded as a vector of independent values, where 1 (red color) corresponds to maximum matching and 0 (green color) corresponds to the absence of the feature. For each feature, the promoters are then grouped into subsets that share similar patterns using fuzzy clustering. Each subset shown in the initial panel is prototyped by locating the centroid that best represents the group to generate the initial, level 1 profiles (e.g., and ). The centroids are encoded as a vector and also visualized by graphical plots for the “expression” and the “interactions” features and by a sequence logo (Crooks et al., 2004) for the “submotifs” feature. These level 1 profiles are combined to generate level 2 profiles (e.g., and ) by the intersection of the ancestor profiles and then prototyped. (Blue circles represent profiles containing other subsets of promoters. The absence of a circle signifies that no promoters are classified into these profiles.) Further navigation through the featurespace lattice generates the level 3 profiles (for example, ) after incorporating the “interactions” feature (Fig. 5). Note that the vectors of the daughter profiles are built anew from the constituent promoters and are slightly different than those of their ancestors because of the refinement that takes place during the profile learning process.
Fig. 5.
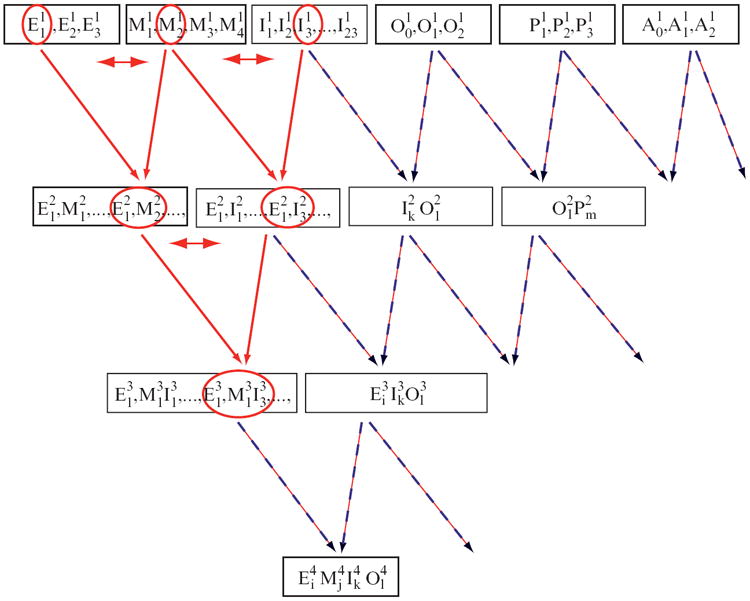
GPS navigates through the feature-space lattice, generating and evaluating profiles. For analysis of promoters regulated by the PhoP protein, we identified up to five models for each type of feature, which are used to describe the promoters. Then, GPS generates profiles, which are groups of promoters sharing common sets of features. (Subscripts denote the different profiles for each feature, whereas superscripts denote the level in the lattice of the profile.) For example, is a particular expression profile that differs from and . These level 1 profiles of each feature are combined to identify level 2 profiles; similarly, level 2 profiles are combined to create level 3 profiles. In addition, because of the fuzzy formulation of the clustering, any promoter that was initially assigned to a specific profile can participate in profile of level t (i.e., indicated as a double-headed arrow). Thus, observations can migrate from parental to offspring clusters (i.e., hierarchical clustering) and among sibling clusters (i.e., optimization clustering). Here we show a small part of the complete lattice, where the part that is highlighted in red is also described in Fig. 4.
GPS Evaluation Strategy
The profile searching and evaluation process is carried out as a multiobjective optimization problem (Deb, 2001; Rissanen, 1989; Ruspini and Zwir, 2002), which must consider conflicting criteria: the extent of the profile, the quality of matching among its members and the corresponding features, and its diversity (Cook et al., 2001; Ruspini and Zwir, 2002). This strategy allows the identification of sets of optimal, instead of single or maximum estimated, profiles as models of alternative hypotheses describing distinct regulatory scenarios.
GPS Validation Strategy
GPS is an unsupervised method that does not need the specification of output classes, which is in contrast to supervised approaches (Zwir et al., 2005a). Thus, the discovered profiles can be used for independently explaining external classes as a process often termed labeling (Mitchell, 1997). These classes can be introduced as a control in GPS, which automatically correlates them with the obtained profiles. For example, GPS uses the expression as one feature among many often derived from a constrained microarray gene expression experiment that just distinguishes between upand downregulated genes (e.g., mutant vs wild-type conditions). However, the posterior availability of more discriminating classes, such as those derived from time-dependent ChiP experiments, can be used as an external phenomenon to be explained by the learned profiles.
Technical Specifications of GPS
Programming Resources
The GPS system has been implemented to be a platform-independent method, with a flexible and fast performance. It combines various machine learning techniques, implemented in cohesive programming languages and frameworks, to satisfy these nonfunctional requirements. The software consists of a core application, which executes sequentially as well as in parallel fashion on a cluster of computers, and two remote interfaces: a light web front end user interface developed in php, which accepts user’s input and e-mails results, and a web service interface coded in java.
User Interface
Data definition and parameters are specified to the system as a single XML document (Wang et al., 2005). This standard provides the required flexibility and readability to allow specification of the database, features, and initial profiles. An XML schema is provided (http://gps-tools.wustl.edu/gps/gps.xsd) to verify the document and to facilitate its editing. Apache Tomcat and Apache Axis are used to provide Web service interface, allowing application-to-application interaction in a standardized fashion (http://gps-tools.wustl.edu:8080/gps).
The core system is coded in a java-independent platform. Advanced java virtual machines with adaptive and just-in-time compilation and other techniques now typically provide performance up to 50 to 100% the speed of C++ programs (Lindsey et al., 2005). We also encapsulated the execution of existing position weight matrice software by developing ad-hoc scripts in perl scripting language.
Parallel Execution
Components that require a large amount of processing power are executed in parallel in a high-performance computing environment provided by the Condor High throughput computing workload management system (Basney and Livny, 1999), which administers batch jobs on clusters of dedicated computing resources.
GPS Input
The GPS method captures the input specifications by an XML file that contains two parts. The first part corresponds to the specifications of the features, whereas the second corresponds to the database composed of the promoter values for the features.
Feature Specifications
Here we describe examples of several features. The complete manual is online at http://gps-tools.wustl.edu.
Purpose: representing DNA-binding site submotifs
-
Syntax
<Feature type=“sequence” name=“submotif” >
Indicates that input data can be a DNA sequence or a position weight matrix containing a motif, and its name, which must be unique.
<Bin name=“M_1” membershipFile=“gps_data/M_1.mat” file Type=“mat” />
Specifies one input bin (i.e., submotif) that was previously clustered and preprocessed as a position weight matrix and stored in a file termed M_1 with extension “mat” located in a user-defined directory.
<Bin name=“M_2”>
<InitialMember name=“mgtC_681”/>
<InitialMember name=“mgtC_718”/>
<InitialMember name=“mgtC_925”/>
</Bin>
Specifies a bin containing the name of promoters belonging to a desired submotif, which are used to automatically calculate the initial matrices if they are not available.
<Bin cluster=“n”>
If a single bin is proposed, GPS automatically clusters the instances into (“n”) bins. If the number of clusters is null (“”), GPS uses the Xie-Beni index to calculate the initial number of clusters.
Description: GPS takes initial lists of candidate promoter sequences for a specific transcription factor and clusters themusing FuzzyC-Means algorithm into bins. Each of these bins is further encoded as position weight matrices using the Consensus/Patser method and used as single-type initial profiles. If the number of clusters is not specified, GPS uses the Xie-Beni index to provide the corresponding number. Matrices provided by othermethods (e.g., MEME) can be also directly incorporated as input data. The initial bins would be dynamically reformulated when new features were aggregated.
Purpose: representing microarray gene expression
-
Syntax
<Feature type=“expression” name=“Expression” >
Indicates that input data can be a vector of continuous values corresponding to levels of gene expression resulting fromone or more experiments. The name must be unique.
<Bin name=“E_1” membershipFile=“gps_data/E_1.exp” fileType =“exp” />
Specifies one input expression bin, where columns are distinct experimental or time conditions that were previously clustered and preprocessed as a prototype (i.e., centroid or array of real numbers) and stored in a file termed E_1 with extension “exp” located in a user-defined directory.
<Bin name=“E_2”/>
<InitialMember name=“mgtC_681”/>
<InitialMember name=“mgtC_718”/>
<InitialMember name=“mgtC_925”/>
</Bin>
Specifies a bin containing the name of promoters belonging to a desired expression profile, which is used to automatically calculate the corresponding initial prototype.
<Bin cluster=“n”>
If a single bin is proposed, GPS automatically clusters the instances into (“n”) profiles. If the number of clusters is null (“”), GPS uses the Xie-Beni index to calculate the initial number of profiles.
Description: GPS takes lists of candidate genes, where columns indicate different or time-dependent experiments. GPS clusters them using Fuzzy C-Means algorithm into bins. Each of these bins is further encoded as a centroid and used as single-type initial profiles. If the number of clusters is not specified, GPS uses the Xie-Beni index to provide the corresponding number. The initial profiles would be dynamically reformulated when new features were aggregated.
Purpose: representing the orientation or topological order of a regulatory element
-
Syntax
<Feature type=“value” name=“Orientation” deviation_factor=“0.5”>
Indicates that input data can be a continuous/integer value, which represents continuous or discrete events, respectively. For example, the orientation of a binding site relative to the open reading frame (e.g., direct or opposite) or the topological order of a regulatory element regarding another (e.g., in front of or behind). The prototypes are uniformly discretized according to the deviation factor. For example, choosing a partition with three values P0, P1, and P2, GPS establishes that P1 will be the central value and P0,2 = P1 ± df × stdex.
Description: GPS takes lists of promoters characterized by a discrete or continuous values (e.g., direct = 0 and indirect=1; repressed = 0, activated = 1, and fuzzy activated or repressed = 0.5). The method clusters them using Fuzzy C-Means algorithm into bins. Each of these bins is further encoded as prototypes calculated as specified in the syntax section.
Purpose: representing fuzzy features
-
Syntax
<Feature type=“fuzzy” name=“Fuzzy_Motif” input type=“sequence” interpretation=“possibilistic∣fuzzy”>
Indicates metadata that encode the degree of matching between an instance and several profiles (i.e., the similarity between instances and the prototypes that represent the profiles). The input can accept different types of features: “sequence,” “expression,” etc. The encoding method could be fuzzy or possibilistic (i.e., membership to all profiles do not have to sum 1).
<Bin name=“MF_1” centroid=“[0.652 0.036 0.160 0.528]”wi=“ 0.5339” (default=1)/>
<Bin name=“MF_2” centroid=“[0.808 0.284 0.348 0.174]” wi=“0.1264”/>
<Bin name=“MF_3” centroid=“[0.433 0.229 0.422 0.625]” wi=“0.1015”/>
The initial profiles (e.g., submotifs) are encoded as vectors of continuous values (centroids) that represent the averaged similarity of their members to a feature submodel (e.g., the position weight matrix of submotif M_1). Indeed, the vector contains the similarity values of the profile members to all other single-type profiles. The wi values correspond to the amplitude of the fuzzy clusters defined for each centroid.
<Bin name=“MF_4” centroid=”“ wi=“ membershipFile= “gps_data/M_1.mat” … membershipFile= “gps_data/M_4.mat”/>
If the centroids are not specified, GPS calculates them based on the profiles defined in membershipFile and adjusts the amplitude of the fuzzy cluster based on the wi parameter.
Description: GPS allows each promoter instance to belong to multiple profiles in parallel by encoding into a metadata its degree of similarity to all profile prototypes. Therefore, these membership values can be considered by GPS, instead of original data, during the learning phase of the method. This codification allows representing different types of input data (e.g., expression, sequences) into the same framework composed of numeric vectors. Moreover, this approach allows encoding intermediate classes that were not initially specified (e.g., the expression class representing the concept “between high and medium” corresponding to those genes where expression is consistent with both levels of expression: high and medium).
GPS Output
The output of the program is composed of four main sections: the XML file submitted by the user, the list of explored profiles, the selected nondominated profiles, and a snapshot matrix designed to export the results into a typical spreadsheet or into the Spotfire environment (Wilkins, 2000).
List of Profiles
This section is identified by the tag “+Profiles:” and enumerates all profiles in the lattice of potential hypothesis. The name of a profile corresponds to the abbreviated names of the features contained in that profile (e.g., the profile named orientation_i.expression_ j.motif_k is composed of the rediscretized version of the original features and i, j, and k correspond to the initial single-type profiles). Values corresponding to the evaluation of the profiles are dumped as the probability of intersection (i.e., profile extent evaluated by the probability of the features intersection [PI]) and similarity degree of matching between promoters and the prototypes of the profile (SI). Finally, we describe each profile by listing its features, its prototype or centroid, and the recovered promoters, indicating name, feature values, and evaluation score.
Dominance Relationship
The start of this section is indicated by the “+Dominance tag,” where each profile is described by name, PI and SI scores, and a tag indicating if it is either dominated or nondominated. Profiles containing unique promoters are not considered. Dominated profiles also contain a list of their dominating profiles.
Snapshot Matrix
This section is identified by the “+Matrix tag,” where columns represent profiles and rows correspond to the profile name, the domination status, the PI and SI values, the number of promoters recovered by the profile, the number of features that characterize the profile, and, finally, the membership value of all of the promoters to the profile.
Uncovering Promoter Profiles Regulated by Response Regulator PhoP Using GPS
We examined the genome-wide transcription profile of wild-type and phoP E. coli strains experiencing low Mg2+, and identified genes whose expression differed statistically between the two strains (Li and Wong, 2001; Tusher et al., 2001). We used these genes, as well as Salmonella enterica promoters suspected to be regulated by PhoP, which were provided from our own laboratory knowledge and the literature to generate the initial list of promoter candidates.
We utilized this list to make the initial models of the features, which were used with relaxed thresholds (Hertz and Stormo, 1999) to describe promoters with weak matching to consensus. For example, GPS clustered these genes by their expression similarity: E1 and E2, consisting of upregulated genes, and E3, harboring downregulated genes. Then we classified all candidates based on the similarity of their expression to that of models built for each of the three expression groups, permitting individual genes to belong to more than one group (i.e., E1 and/or E2) (Bezdek, 1998; Gasch and Eisen, 2002). This enabled us to recover weakly expressed genes that would have otherwise gone undetected using strict statistical filters (Li and Wong, 2001; Tusher et al., 2001). GPS applied the same strategy to the other features. For example, the initial submotifs corresponding to the PhoPbinding site were dissected by GPS, allowing the recovery of PhoP-regulated promoters with weak matching to the PhoP box consensus, such as the Salmonella pmrD promoter, that could not be detected using consensus cutoffs (Hertz and Stormo, 1999; Stormo 2000), despite being regulated and footprinted by the PhoP protein (Kato et al., 2003; Kox et al., 2000).
We used several features for the initial profiles, including discrimination of PhoP box submotifs (M1–M4), the orientation (O1–O2) and distance of the PhoP box relative to the RNA polymerase site (P1–P3), the class of σ70 promoter (because σ70 is responsible for the transcription of PhoP-regulated genes [Yamamoto et al., 2002]) (P1–P3), the presence of potential binding sites for 60+ transcription factors (Salgado et al., 2001) (I0–I4), and whether the position of the PhoP box suggests that a promoter is activated or repressed (A1–A3). Then, GPS applied its grouping, prototyping, and searching strategy and uncovered several optimal profiles, which were validated experimentally (Zwir et al., 2005b).
One of the profiles identifies canonical PhoP-regulated promoters. This profile, , encompasses promoters (e.g., those of the phoP, mgtA, ybcU, and yhiW genes of E. coli and the slyB gene of Salmonella) that share the same RNA polymerase sites, expression patterns, PhoP box submotif, and the same pattern for other transcription factor-binding sites. The profile includes not only the prototypical phoP and mgtA promoters (Minagawa et al., 2003), but also the promoters of the yhiW gene, which was not known to be under PhoP control.
Another profile describes promoters with PhoP boxes in the opposite orientation of the canonical PhoP-regulated promoters. This profile, , (PI = 0.07, SI = 0.17), includes promoters also with the PhoP box in the opposite orientation (e.g., those of the slyB and yhiW genes of E. coli and the ybjX, mig-14, virK, mgtC, and pagC genes of Salmonella) but differs from the former profile in that the PhoP box is located further upstream from the RNA polymerase site than the typical PhoP-regulated gene. Notably, these promoters could be assigned to a profile even in the absence of expression data. Despite the unusual orientation of the PhoP box in these promoters, the identified PhoP boxes are bona fide PhoPbinding sites (Shi et al., 2004; Shin and Groisman, 2005; Zwir et al., 2005b). Curiously, it had been suggested that PhoP regulates these genes of Salmonella indirectly because a PhoP-binding site could not be identified at a location typical of other PhoP-activated genes (Lejona et al., 2003).
By using gene expression as one feature among many, GPS could distinguish between promoters of the acid resistance genes (Masuda and Church, 2003; Tucker et al., 2002) that otherwise would have stayed undifferentiated within the same expression group. These promoters were found to belong to one of three distinct profiles: , includes promoters for acid resistance structural genes lacking a recognizable PhoP box (e.g., those of the dps and gadA genes of E. coli); , comprises promoters of a different set of structural genes that include hdeD and hdeAB; and , harbors promoters of the acid resistance regulatory genes yhiE and yhiW (also termed gadE and gadW, respectively). Promoters in the latter two profiles harbor PhoP boxes but these profiles differ in the RNA polymerase sites and their distance to the PhoP box. These findings enabled the prediction that PhoP uses at least two modes of regulation to control transcription of acid resistance genes: a feed-forward loop and classical transcriptional cascade (Zwir et al., 2005b).
Conclusions
We have described an unsupervised machine learning method, termed GPS, that discriminates among coregulated promoters by simultaneously considering both cis-acting regulatory features and gene expression. The GPS method encodes regulatory features specifically aimed at handling the variability in sequence, location, and topology that characterize gene transcription. Then, the method uses an integrated approach for discovering promoter profiles, thereby uncovering an unsuspected complexity in the regulatory targets that are under direct and indirect transcriptional control of the regulatory protein.
Several characteristics of GPS contribute to its power. First, it considers gene expression as one feature among many, thereby allowing classification of promoters even in its absence (Beer and Tavazoie, 2004; Conlon et al., 2003). Particularly, GPS differs from supervised learning methods (Mitchell, 1997) that group features and observations based on explicitly defined dependent variables (Beer and Tavazoie, 2004; Conlon et al., 2003; Quinlan, 1993). Second, GPS performs a local feature selection for each profile because not every feature is relevant for all profiles (Kohavi and John, 1997), and, a priori, we do not know which feature is biologically meaningful for a given promoter. This is in contrast to approaches that filter or reduce features for all possible clusters (Yeung and Ruzzo, 2001). Third, GPS finds all optimal solutions among multiple criteria (Pareto optimality) (Deb, 2001), which avoids the biases that might result from using any specific weighing scheme (Rissanen, 1989). This can detect cohesion within a small number of promoters that would remain undetected by methods that emphasize the number of promoters in a profile (Agrawal and Shafer, 1996). Fourth, GPS has a multimodal nature that allows alternative descriptions of a system by providing several adequate solutions (Deb, 2001; Ruspini and Zwir, 2002), thus recovering locally optimal solutions, which have been shown to be biologically meaningful (Azevedo et al., 2005; Cotik et al., 2005). This differentiates GPS from methods that focus on a single optimum (Gutierrez-Rios et al., 2003; Martinez-Antonio and Collado-Vides, 2003). Finally, GPS allows promoters to be members of more than one profile by using fuzzy clustering (Bezdek, 1998; Cordon et al., 2002; Gasch and Eisen, 2002), thus explicitly treating the profiles as hypotheses, which are tested and refined during the analysis (Mitchell, 1997). This distinguishes GPS from clustering approaches that prematurely force promoters into disjointed groups (Qin et al., 2003). In addition, GPS recognizes that not every profile is meaningful (Bezdek, 1998), which avoids the constraints of methods that force membership even to uninteresting groups because the sum of membership is required to be one (Cooper and Herskovits, 1992).
The GPS method can be generalized to a method for grouping, prototyping, and searching in the lattice space of hypotheses, which can be used in different structural domains. For example, we have described the analysis of the targets of regulation of the response regulator PhoP (Zwir et al., 2005b) and it is now being applied to describe other two-components systems (e.g., PmrA/PmrB) and general regulators (e.g., CRP) in different genomes (e.g., Yersinia pestis and Vibrio cholerae). Moreover, it is being used to mine the Gene Ontology database (Ashburner et al., 2000) to discover and annotate profiles across biological processes, cellular components, and molecular functions and to identify molecular pathways that provide insight into the host response over time to systemic inflammatory insults (Calvano et al., 2005).
Acknowledgments
Our research is supported, in part, by grants from the National Institutes of Health to E.A.G., who is an Investigator of the Howard Hughes Medical Institute. I.Z. is also a member of the Computer Science Department at the University of Granada, Spain, and is supported, in part, by the Spanish Ministry of Science and Technology under project BIO2004-0270E and TIN2006-12879.
References
- Agrawal R, Shafer JC. Parallel mining of association rules. IEEE Trans Knowledge Data Engineer. 1996;8:962–969. [Google Scholar]
- Ashburner M, Ball CA, Blake JA, Botstein D, Butler H, Cherry JM, Davis AP, Dolinski K, Dwight SS, Eppig JT, Harris MA, Hill DP, et al. Gene ontology: Tool for the unification of biology. The Gene Ontology Consortium Nat Genet. 2000;25:25–29. doi: 10.1038/75556. [DOI] [PMC free article] [PubMed] [Google Scholar]
- Azevedo RB, Lohaus R, Braun V, Gumbel M, Umamaheshwar M, Agapow PM, Houthoofd W, Platzer U, Borgonie G, Meinzer HP, Leroi AM. The simplicity of metazoan cell lineages. Nature. 2005;433:152–156. doi: 10.1038/nature03178. [DOI] [PubMed] [Google Scholar]
- Bailey TL, Elkan C. The value of prior knowledge in discovering motifs with MEME. Proc Int Conf Intell Syst Mol Biol. 1995;3:21–29. [PubMed] [Google Scholar]
- Bar-Joseph Z, Gerber GK, Lee TI, Rinaldi NJ, Yoo JY, Robert F, Gordon DB, Fraenkel E, Jaakkola TS, Young RA, Gifford DK. Computational discovery of gene modules and regulatory networks. Nat Biotechnol. 2003;21:1337–1342. doi: 10.1038/nbt890. [DOI] [PubMed] [Google Scholar]
- Basney J, Livny M. Deploying a high throughput computing cluster. In: Buyya R, editor. High Performance Cluster Computing. Prentice Hall; New York: 1999. [Google Scholar]
- Beer MA, Tavazoie S. Predicting gene expression from sequence. Cell. 2004;117:185–198. doi: 10.1016/s0092-8674(04)00304-6. [DOI] [PubMed] [Google Scholar]
- Bezdek JC. Pattern analysis. In: Pedrycz W, Bonissone PP, Ruspini EH, editors. Handbook of Fuzzy Computation. Institute of Physics; Bristol: 1998. pp. F6.1.1–F6.6.20. [Google Scholar]
- Bezdek JC, Pal SK IEEE Neural Networks Council. Fuzzy Models for Pattern Recognition: Methods That Search for Structures in Data. IEEE Press; New York: 1992. [Google Scholar]
- Bijlsma JJ, Groisman EA. The PhoP/PhoQ system controls the intramacrophage type three secretion system of Salmonella enterica. Mol Microbiol. 2005;57:85–96. doi: 10.1111/j.1365-2958.2005.04668.x. [DOI] [PubMed] [Google Scholar]
- Blattner FR, Plunkett G, 3rd, Bloch CA, Perna NT, Burland V, Riley M, Collado-Vides J, Glasner JD, Rode CK, Mayhew GF, Gregor J, Davis NW, et al. The complete genome sequence of Escherichia coli K-12. Science. 1997;277:1453–1474. doi: 10.1126/science.277.5331.1453. [DOI] [PubMed] [Google Scholar]
- Calvano SE, Xiao W, Richards DR, Felciano RM, Baker HV, Cho RJ, Chen RO, Brownstein BH, Cobb JP, Tschoeke SK, Miller-Graziano C, Moldawer LL, et al. A network-based analysis of systemic inflammation in humans. Nature. 2005;437:1032–1037. doi: 10.1038/nature03985. [DOI] [PubMed] [Google Scholar]
- Castelli ME, Garcia Vescovi E, Soncini FC. The phosphatase activity is the target for Mg2+ regulation of the sensor protein PhoQ in Salmonella. J Biol Chem. 2000;275:22948–22954. doi: 10.1074/jbc.M909335199. [DOI] [PubMed] [Google Scholar]
- Chamnongpol S, Cromie M, Groisman EA. Mg2+ sensing by the Mg2+ sensor PhoQ of Salmonella enterica. J Mol Biol. 2003;325:795–807. doi: 10.1016/s0022-2836(02)01268-8. [DOI] [PubMed] [Google Scholar]
- Cheeseman P, Oldford RW. Selecting Models from Data: Artificial Intelligence and Statistics IV. Springer-Verlag; New York: 1994. [Google Scholar]
- Conlon EM, Liu XS, Lieb JD, Liu JS. Integrating regulatory motif discovery and genome-wide expression analysis. Proc Natl Acad Sci USA. 2003;100:3339–3344. doi: 10.1073/pnas.0630591100. [DOI] [PMC free article] [PubMed] [Google Scholar]
- Cook DJ, Holder LB, Su S, Maglothin R, Jonyer I. Structural mining of molecular biology data. IEEE Eng Med Biol Mag. 2001;20:67–74. doi: 10.1109/51.940050. [DOI] [PubMed] [Google Scholar]
- Cooper GF, Herskovits E. A Bayesian method for the induction of probabilistic networks from data. Machine Learn. 1992;9:309–347. [Google Scholar]
- Cordon O, Herrera F, Zwir I. Linguistic modeling by hierarchical systems of linguistic rules. IEEE Trans Fuzzy Syst. 2002;10:2–20. [Google Scholar]
- Cotik V, Zaliz RR, Zwir I. A hybrid promoter analysis methodology for prokaryotic genomes. Fuzzy Sets Syst. 2005;152:83–102. [Google Scholar]
- Crooks GE, Hon G, Chandonia JM, Brenner SE. WebLogo: A sequence logo generator. Genome Res. 2004;14:1188–1190. doi: 10.1101/gr.849004. [DOI] [PMC free article] [PubMed] [Google Scholar]
- Deb K. Multi-objective Optimization Using Evolutionary Algorithms. Wiley; New York: 2001. [Google Scholar]
- Gasch AP, Eisen MB. Exploring the conditional coregulation of yeast gene expression through fuzzy k-means clustering. Genome Biol. 2002;3 doi: 10.1186/gb-2002-3-11-research0059. RESEARCH0059. [DOI] [PMC free article] [PubMed] [Google Scholar]
- Georgellis D, Kwon O, Lin EC. Amplification of signaling activity of the arc two-component system of Escherichia coli by anaerobic metabolites: An in vitro study with different protein modules. J Biol Chem. 1999;274:35950–35954. doi: 10.1074/jbc.274.50.35950. [DOI] [PubMed] [Google Scholar]
- Groisman EA. The pleiotropic two-component regulatory system PhoP-PhoQ. J Bacteriol. 2001;183:1835–1842. doi: 10.1128/JB.183.6.1835-1842.2001. [DOI] [PMC free article] [PubMed] [Google Scholar]
- Gutierrez-Rios RM, Rosenblueth DA, Loza JA, Huerta AM, Glasner JD, Blattner FR, Collado-Vides J. Regulatory network of Escherichia coli: Consistency between literature knowledge and microarray profiles. Genome Res. 2003;13:2435–2443. doi: 10.1101/gr.1387003. [DOI] [PMC free article] [PubMed] [Google Scholar]
- Hertz GZ, Stormo GD. Identifying DNA and protein patterns with statistically significant alignments of multiple sequences. Bioinformatics. 1999;15:563–577. doi: 10.1093/bioinformatics/15.7.563. [DOI] [PubMed] [Google Scholar]
- Holmes I, Bruno WJ. Finding regulatory elements using joint likelihoods for sequence and expression profile data. Proc Int Conf Intell Syst Mol Biol. 2000;8:202–210. [PubMed] [Google Scholar]
- Kato A, Groisman EA. Connecting two-component regulatory systems by a protein that protects a response regulator from dephosphorylation by its cognate sensor. Genes Dev. 2004;18:2302–2313. doi: 10.1101/gad.1230804. [DOI] [PMC free article] [PubMed] [Google Scholar]
- Kato A, Latifi T, Groisman EA. Closing the loop: The PmrA/PmrB two-component system negatively controls expression of its posttranscriptional activator PmrD. Proc Natl Acad Sci USA. 2003;100:4706–4711. doi: 10.1073/pnas.0836837100. [DOI] [PMC free article] [PubMed] [Google Scholar]
- Kohavi R, John GH. Wrappers for feature subset selection. Artificial Intelligence. 1997;97:273–324. [Google Scholar]
- Kox LF, Wosten MM, Groisman EA. A small protein that mediates the activation of a two-component system by another two-component system. EMBO J. 2000;19:1861–1872. doi: 10.1093/emboj/19.8.1861. [DOI] [PMC free article] [PubMed] [Google Scholar]
- Lejona S, Aguirre A, Cabeza ML, Garcia Vescovi E, Soncini FC. Molecular characterization of the Mg2+-responsive PhoP-PhoQ regulon in Salmonella enterica. J Bacteriol. 2003;185:6287–6294. doi: 10.1128/JB.185.21.6287-6294.2003. [DOI] [PMC free article] [PubMed] [Google Scholar]
- Li C, Wong WH. Model-based analysis of oligonucleotide arrays: Expression index computation and outlier detection. Proc Natl Acad Sci USA. 2001;98:31–36. doi: 10.1073/pnas.011404098. [DOI] [PMC free article] [PubMed] [Google Scholar]
- Li H, Rhodius V, Gross C, Siggia ED. Identification of the binding sites of regulatory proteins in bacterial genomes. Proc Natl Acad Sci USA. 2002;99:11772–11777. doi: 10.1073/pnas.112341999. [DOI] [PMC free article] [PubMed] [Google Scholar]
- Lindsey CS, Tolliver JS, Lindblad T. JavaTech: An Introduction to Scientific and Technical Computing with Java. Cambridge University Press; New York: 2005. [Google Scholar]
- Manson McGuire A, Church GM. Predicting regulons and their cis-regulatory motifs by comparative genomics. Nucleic Acids Res. 2000;28:4523–4530. doi: 10.1093/nar/28.22.4523. [DOI] [PMC free article] [PubMed] [Google Scholar]
- Martinez-Antonio A, Collado-Vides J. Identifying global regulators in transcriptional regulatory networks in bacteria. Curr Opin Microbiol. 2003;6:482–489. doi: 10.1016/j.mib.2003.09.002. [DOI] [PubMed] [Google Scholar]
- Masuda N, Church GM. Regulatory network of acid resistance genes in Escherichia coli. Mol Microbiol. 2003;48:699–712. doi: 10.1046/j.1365-2958.2003.03477.x. [DOI] [PubMed] [Google Scholar]
- Minagawa S, Ogasawara H, Kato A, Yamamoto K, Eguchi Y, Oshima T, Mori H, Ishihama A, Utsumi R. Identification and molecular characterization of the Mg2+ stimulon of Escherichia coli. J Bacteriol. 2003;185:3696–3702. doi: 10.1128/JB.185.13.3696-3702.2003. [DOI] [PMC free article] [PubMed] [Google Scholar]
- Mitchell TM. Machine Learning. McGraw-Hill; New York: 1997. [Google Scholar]
- Montagne M, Martel A, Le Moual H. Characterization of the catalytic activities of the PhoQ histidine protein kinase of Salmonella enterica serovar Typhimurium. J Bacteriol. 2001;183:1787–1791. doi: 10.1128/JB.183.5.1787-1791.2001. [DOI] [PMC free article] [PubMed] [Google Scholar]
- Oshima T, Aiba H, Masuda Y, Kanaya S, Sugiura M, Wanner BL, Mori H, Mizuno T. Transcriptome analysis of all two-component regulatory system mutants of Escherichia coli K-12. Mol Microbiol. 2002;46:281–291. doi: 10.1046/j.1365-2958.2002.03170.x. [DOI] [PubMed] [Google Scholar]
- Pritsker M, Liu YC, Beer MA, Tavazoie S. Whole-genome discovery of transcription factor binding sites by network-level conservation. Genome Res. 2004;14:99–108. doi: 10.1101/gr.1739204. [DOI] [PMC free article] [PubMed] [Google Scholar]
- Qin ZS, McCue LA, Thompson W, Mayerhofer L, Lawrence CE, Liu JS. Identification of co-regulated genes through Bayesian clustering of predicted regulatory binding sites. Nat Biotechnol. 2003;21:435–439. doi: 10.1038/nbt802. [DOI] [PubMed] [Google Scholar]
- Quinlan JR. C4.5: Programs for Machine Learning. Morgan Kaufmann; San Mateo, CA: 1993. [Google Scholar]
- Rissanen J. Stochastic Complexity in Statistical Inquiry. World Scientific; Singapore: 1989. [Google Scholar]
- Romero Zaliz R, Zwir I, Ruspini EH. Generalized analysis of promoters: A method for DNA sequence description. In: Coello Coello CA, Lamont GB, editors. Applications of Multi-Objective Evolutionary Algorithms. World Scientific; Singapore: 2004. pp. 427–450. [Google Scholar]
- Ronen M, Rosenberg R, Shraiman BI, Alon U. Assigning numbers to the arrows: Parameterizing a gene regulation network by using accurate expression kinetics. Proc Natl Acad Sci USA. 2002;99:10555–10560. doi: 10.1073/pnas.152046799. [DOI] [PMC free article] [PubMed] [Google Scholar]
- Ruspini EH, Zwir I. Automated generation of qualitative representations of complex objects by hybrid soft-computing methods. In: Pal SK, Pal A, editors. Pattern Recognition: From Classical to Modern Approaches. World Scientific; New Jersey: 2002. pp. 454–474. [Google Scholar]
- Salgado H, Gama-Castro S, Martinez-Antonio A, Diaz-Peredo E, Sanchez-Solano F, Peralta-Gil M, Garcia-Alonso D, Jimenez-Jacinto V, Santos-Zavaleta A, Bonavides-Martinez C, Collado-Vides J. RegulonDB (version 4. 0): Transcriptional regulation, operon organization and growth conditions in Escherichia coli K-12. Nucleic Acids Res. 2004;32:D303–D306. doi: 10.1093/nar/gkh140. [DOI] [PMC free article] [PubMed] [Google Scholar]
- Salgado H, Santos-Zavaleta A, Gama-Castro S, Millan-Zarate D, Diaz-Peredo E, Sanchez-Solano F, Perez-Rueda E, Bonavides-Martinez C, Collado-Vides J. RegulonDB (version 3. 2): Transcriptional regulation and operon organization in Escherichia coli K-12. Nucleic Acids Res. 2001;29:72–74. doi: 10.1093/nar/29.1.72. [DOI] [PMC free article] [PubMed] [Google Scholar]
- Shi Y, Latifi T, Cromie MJ, Groisman EA. Transcriptional control of the antimicrobial peptide resistance ugtL gene by the Salmonella PhoP and SlyA regulatory proteins. J Biol Chem. 2004;279:38618–38625. doi: 10.1074/jbc.M406149200. [DOI] [PubMed] [Google Scholar]
- Shigenobu S, Watanabe H, Hattori M, Sakaki Y, Ishikawa H. Genome sequence of the endocellular bacterial symbiont of aphids Buchnera sp. APS. Nature. 2000;407:81–86. doi: 10.1038/35024074. [DOI] [PubMed] [Google Scholar]
- Shin D, Groisman EA. Signal-dependent binding of the response regulators PhoP and PmrA to their target promoters in vivo. J Biol Chem. 2005;280:4089–4094. doi: 10.1074/jbc.M412741200. [DOI] [PubMed] [Google Scholar]
- Stormo GD. DNA binding sites: Representation and discovery. Bioinformatics. 2000;16:16–23. doi: 10.1093/bioinformatics/16.1.16. [DOI] [PubMed] [Google Scholar]
- Stover CK, Pham XQ, Erwin AL, Mizoguchi SD, Warrener P, Hickey MJ, Brinkman FS, Hufnagle WO, Kowalik DJ, Lagrou M, Garber RL, Goltry L, et al. Complete genome sequence of Pseudomonas aeruginosa PA01, an opportunistic pathogen. Nature. 2000;406:959–964. doi: 10.1038/35023079. [DOI] [PubMed] [Google Scholar]
- Tavazoie S, Hughes JD, Campbell MJ, Cho RJ, Church GM. Systematic determination of genetic network architecture. Nat Genet. 1999;22:281–285. doi: 10.1038/10343. [DOI] [PubMed] [Google Scholar]
- Tompa M, Li N, Bailey TL, Church GM, De Moor B, Eskin E, Favorov AV, Frith MC, Fu Y, Kent WJ, Makeev VJ, Mironov AA, et al. Assessing computational tools for the discovery of transcription factor binding sites. Nat Biotechnol. 2005;23:137–144. doi: 10.1038/nbt1053. [DOI] [PubMed] [Google Scholar]
- Tu X, Latifi T, Bougdour A, Gottesman S, Groisman EA. The PhoP/PhoQ two-component system stabilizes the alternative sigma factor RpoS in Salmonella enterica. Proc Natl Acad Sci USA. 2006;103:13503–13508. doi: 10.1073/pnas.0606026103. [DOI] [PMC free article] [PubMed] [Google Scholar]
- Tucker DL, Tucker N, Conway T. Gene expression profiling of the pH response in Escherichia coli. J Bacteriol. 2002;184:6551–6558. doi: 10.1128/JB.184.23.6551-6558.2002. [DOI] [PMC free article] [PubMed] [Google Scholar]
- Tusher VG, Tibshirani R, Chu G. Significance analysis of microarrays applied to the ionizing radiation response. Proc Natl Acad Sci USA. 2001;98:5116–5121. doi: 10.1073/pnas.091062498. [DOI] [PMC free article] [PubMed] [Google Scholar]
- Wang X, Gorlitsky R, Almeida JS. From XML to RDF: How semantic web technologies will change the design of ‘omic’ standards. Nat Biotechnol. 2005;23:1099–1103. doi: 10.1038/nbt1139. [DOI] [PubMed] [Google Scholar]
- Wilkins CL. Data mining with Spotfire Pro 4. 0. Anal Chem. 2000;72:550a. [Google Scholar]
- Yamamoto K, Ogasawara H, Fujita N, Utsumi R, Ishihama A. Novel mode of transcription regulation of divergently overlapping promoters by PhoP, the regulator of two-component system sensing external magnesium availability. Mol Microbiol. 2002;45:423–438. doi: 10.1046/j.1365-2958.2002.03017.x. [DOI] [PubMed] [Google Scholar]
- Yeung KY, Ruzzo WL. Principal component analysis for clustering gene expression data. Bioinformatics. 2001;17:763–774. doi: 10.1093/bioinformatics/17.9.763. [DOI] [PubMed] [Google Scholar]
- Zwir I, Huang H, Groisman EA. Analysis of differentially-regulated genes within a regulatory network by GPS genome navigation. Bioinformatics. 2005a;21:4073–4083. doi: 10.1093/bioinformatics/bti672. [DOI] [PubMed] [Google Scholar]
- Zwir I, Shin D, Kato A, Nishino K, Latifi T, Solomon F, Hare JM, Huang H, Groisman EA. Dissecting the PhoP regulatory network of Escherichia coli and Salmonella enterica. Proc Natl Acad Sci USA. 2005b;102:2862–2867. doi: 10.1073/pnas.0408238102. [DOI] [PMC free article] [PubMed] [Google Scholar]