Abstract
Loss-of-function genetic analysis plays a pivotal role in elucidating individual gene function as well as interactions among gene networks. The ease of gene tagging and cloning provided by transfer DNA (T-DNA) insertion mutants have led to their heavy use by the Arabidopsis research community. However, certain aspects of T-DNA alleles require caution, as highlighted in this study of an intronic insertion mutant (ben1-1) in the BEN1 (BRI1-5 ENHANCED 1) gene. As a part of our analysis of brassinosteroid catabolic enzymes, we generated a genetic triple-mutant from a cross between the bas1-2 sob7-1 double-null (T-DNA exonic insertion mutants of phyB-4 ACTIVATION TAGGED SUPPRESSOR 1 and SUPPRESSOR OF phyB-4 7) and ben1-1. As previously described, the single ben1-1 line behaves as a transcript null. However, in the triple-mutant background ben1-1 was reverted to a partial loss-of-function allele showing enhanced levels of the wild-type-spliced transcript. Interestingly, the enhanced expression of BEN1 remained stable when the ben1-1 single-mutant was reisolated from a cross with the wild type. In addition, the two genetically identical pretriple and posttriple ben1-1 mutants also differed phenotypically. The previously functional NPTII (NEOMYCIN PHOSPHOTRANSFERASE II) T-DNA marker gene (which encodes kanamycin resistance) was no longer functional in the recovered ben1-1 allele, though the length of the T-DNA insertion and the NPTII gene sequence did not change in the pretriple and posttriple ben1-1 mutants. Methylation analysis using both restriction endonuclease activity and bisulfite conversion followed by sequencing showed that the methylation status of the T-DNA is different between the original and the recovered ben1-1. These observations demonstrate that the recovered ben1-1 mutant is epigenetically different from the original ben1-1 allele.
Loss-of-function mutants play an essential role in genetic analysis. Mutation-tagging approaches, such as mutagenesis by transfer DNA (T-DNA) insertion, takes advantage of Agrobacterium-mediated plant transformation where a modified Ti plasmid is integrated into the plant genome (Krysan et al. 1999). In plant species that are amenable to transformation by Agrobacterium, community projects have been undertaken to generate large collections of genomic T-DNA insertion libraries (Sessions et al. 2002; Alonso et al. 2003; An et al. 2005; Thole et al. 2011). The ease of gene tagging and cloning provided by T-DNA insertion mutants has led to their extensive use in Arabidopsis research.
Mutagenic T-DNAs could be inserted into any part of a gene, leading to an array of outcomes (Krysan et al. 1999). Exonic T-DNA insertions may create null-alleles due to the introduction of a premature stop codon or a frame-shift mutation. Intronic T-DNA insertions may generate null-alleles due to failure of proper splicing, leading to an aberrant/truncated protein (Wang 2008). However, in some cases intronic T-DNA insertions generate knock-down alleles due to RNA/RNA interaction between the extended RNA (transcribed from the gene including the inserted T-DNA) and an RNA transcribed from a part of the complementary T-DNA strand (Gao and Zhao 2012). Existence of this mechanism is supported by the observation that intronic T-DNA insertion alleles are susceptible to instability because of trans T-DNA interactions which disrupt or inhibit the RNA/RNA duplex (Gao and Zhao 2012). The trans T-DNA interactions are known to be commonly associated with DNA methylation, which might play a role in the mechanism of locus instability. For example, the instability of the intronic SALK T-DNA insertion mutation in the gene essential for cellulose synthesis, COBRA (cob-6), is shown to be dependent upon the activity of enzymes involved in DNA methylation (Xue et al. 2012).
These complications associated with T-DNA-insertion alleles require caution, as highlighted in this study of an intronic insertion mutant (ben1-1) in the BEN1 (BRI1-5 ENHANCED 1) gene. The BEN1 overexpressor mutant BRI1-5 ENHANCED1-1DOMINANT (ben1-1D) has a characteristic BR-deficient phenotype (Yuan et al. 2007). A transcript-null mutant ben1-1 with a T-DNA insertion in the second intron of BEN1 has elevated BR levels compared with the wild type. Although the mechanism of BEN1 activity is not known, genetic data support the hypothesis that BEN1 is involved in BR inactivation. BEN1 expression is up-regulated in seedlings grown in white light compared with those grown in the dark. ben1-1 seedlings are also less responsive to light-mediated inhibition of hypocotyl growth, suggesting a role in seedling photomorphogenesis (Yuan et al. 2007).
BR inactivation also involves members of the cytochrome P450 gene family, BAS1 (phyB-4 ACTIVATION TAGGED SUPPRESSOR 1) and SOB7 (SUPPRESSOR OF phyB-4 7) (Neff et al. 1999; Turk et al. 2003; Turk et al. 2005). Overexpression of either BAS1/CYP72B1/CYP734A1 or SOB7/CYP72C1 suppresses the long-hypocotyl phenotype of phyB-4 and also confers a BR-deficient phenotype (Neff et al. 1999; Turk et al. 2003; Turk et al. 2005). BAS1 transcript accumulation is strongly feedback regulated in positive manner by BR levels (Tanaka et al. 2005). BR levels are increased in the bas1-2 sob7-1 double-null mutant (first-exon T-DNA insertion alleles) compared with the wild type or either single null allele. BAS1 and SOB7 also affect developmental processes, such as hypocotyl elongation and flowering, in a synergistic/redundant fashion (Turk et al. 2005). Independent evolution of multiple BR-inactivating pathways indicates the importance of this process in plant growth and development. Therefore, identifying the contributions of enzymes and pathways related to the inactivation of these hormones is important for understanding BR-mediated development (Sandhu et al. 2012).
As a part of our analysis of BR catabolic enzymes, we generated a genetic triple-mutant from a cross between the bas1-2 sob7-1 double-null and ben1-1. Our results show that the full loss-of-function ben1-1 mutation was transformed to a partial loss-of-function mutation in the bas1-2 sob7-1 ben1-1 (triple-mutant) background showing enhanced levels of the wild-type−spliced transcript. Interestingly, the enhanced expression of BEN1 remained stable when the ben1-1 single-mutant was reisolated from a cross with the wild-type. In addition, the ben1-1 single-mutant isolated back from the triple mutant was phenotypically different than the original ben1-1 allele in terms of seedling-development. The size of T-DNA insertion and the NPTII (NEOMYCIN PHOSPHOTRANSFERASE II) gene sequence did not change in the pretriple and posttriple ben1-1 mutants. However, the previously functional NPTII T-DNA marker gene (which encodes kanamycin resistance) was no longer functional in the recovered ben1-1 allele. Methylation analysis using both restriction endonuclease activity with methylation sensitive enzymes and bisulfite conversion followed by sequencing showed that the methylation status of the T-DNA is different between the original and the recovered ben1-1. Our study shows that the ben1-1 BR-catabolism mutation is unstable due to epigenetic modifications of the intronic T-DNA insertion.
Materials and Methods
Plant material
All mutants used in this study, ben1-1 (Yuan et al. 2007), bas1-2, and sob7-1 (Turk et al. 2005), were in the Columbia (Col-0) background. ben1-1 was crossed with bas1-2 sob7-1, and multiple mutant combinations were isolated from populations of F2 individuals derived from self-pollinated F1 plants. The ben1-1 allele was characterized by amplifying genomic DNA with gene specific polymerase chain reaction (PCR) primers GSP1 and GSP2, and T-DNA−specific PCR primers LBb1.3 and PRT2 (Supporting Information, Table S1). Molecular-genetic analysis of the bas1-2 and sob7-1 alleles is described in Turk et al. (2005).
ben1-1 was isolated from the triple-mutant bas1-2 sob7-1 ben1-1 background by crossing with the wild-type (Col-0) and allowing the F1 population to self-pollinate. The subsequent F2 population was screened with PCR markers specific for the bas1-2, sob7-1, and ben1-1 T-DNA insertions. An individual F2 plant homozygous for wild-type SOB7 allele and heterozygous for bas1-2 and ben1-1 T-DNA insertions was thus identified. The F3 progeny of this individual was further screened to identify and recover multiple single ben1-1 F3 lines (#11.4 and #11.5) as well as a bas1-2 sob7-1 ben1-1 triple-mutant line. The homozygous F4 seeds derived from the identified individual F3 lines were used for quantitative RT-PCR and hypocotyl growth analysis.
Exogenous hormone treatment
The stock solution of brassinolide (BL) was dissolved in 95% ethanol (v/v). BL treatment was given by adding the BL stock solution to the seedling growth media to a final concentration of 100 nM. Equal amounts of 95% ethanol were added to the negative-hormone control media.
Hypocotyl measurement
Procedures for seed sterilization, plating, growth conditions and hypocotyl measurement were done as described in Turk et al. (2003).
Transcript analysis
Total RNA was isolated, by the use of the RNeasy Plant Kit (QIAGEN, Valencia, CA), from 5-d-old seedlings grown in continuous white light (25 µmol m−2 sec—1). On-column DNase digestion was performed using the RNase-Free DNase Set (QIAGEN) to eliminate genomic DNA contamination. Total cDNA was synthesized using SuperScriptIII First-Strand Synthesis System (Invitrogen, Carlsbad, CA). The complete BEN1 transcript was amplified using primers PRT1 and PRT2. ACTIN2 was used as an internal control in RT-PCR (Table S1). The linear range of amplification for each gene transcript was determined by comparing samples obtained using different numbers of cycles. Lack of genomic and foreign DNA contamination was ascertained by using all RNA samples and water as a template in a PCR.
Real-time quantitative RT-PCR analysis
For real-time quantitative RT-PCR analysis, Applied Biosystems 7500 Fast Real-Time PCR System (Applied Biosystems, Foster City, CA) was used. BEN1 transcript was amplified using primers PQ1 and PQ2. BAS1 transcript was amplified using primers PQ3 and PQ4 (Table S1). Internal control ubiquitin gene (At5g15400) was amplified using PCR Primers UBQ1 and UBQ2 (Table S1). PCR thermocycling program profile used was as following: initial denaturation at 95º for 20 sec, followed by 40 cycles of 95º for 3 sec, and 60º for 30 sec. Melt curve profile used melt curve analysis was as following: 95º for 15 sec, 60º for 1 min, 95º for 30 sec, and 60º for 15 sec.
Amplification of T-DNA insertion
The T-DNA insertion fragment was amplified using PrimeSTAR GXL polymerase (Clonetech, Mountain View, CA). PCR thermocycling program profile used was as following: 35 cycles of 98º for 10 sec, 64º for 15 sec, and 68º for 10 min.
Bisulfite conversion and DNA sequencing
DNA was converted using the EZ DNA Methylation-Lightning kit (Zymo Research, Irvine, CA). Converted DNA was amplified using ZymoTaq DNA polymerase (Zymo research) using primers listed in Table S1. The gel-purified PCR product was directly used for sequencing.
Results
The ben1-1 T-DNA insertion mutation is unstable in the bas1-2 sob7-1 background
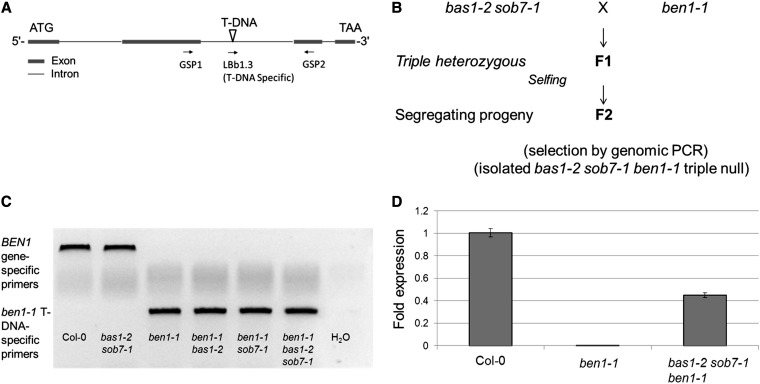
A bas1-2 sob7-1 ben1-1 triple mutant line was isolated from a cross between bas1-2 sob7-1 double- and ben1-1 single-mutants (Figure 1, A–C). Transcript levels of all three genes were examined to confirm that the triple mutant was a transcript-accumulation-null at all three loci. Surprisingly, quantitative RT-PCR showed that the triple mutant had significantly enhanced levels of BEN1 transcript compared with the single ben1-1 parental line, which showed very low levels of BEN1 transcript accumulation (Figure 1D). Sequencing confirmed that the BEN1 cDNA from both the wild type and the triple mutant was identical, indicating that the T-DNA containing second intron in the ben1-1 allele in the triple mutant had spliced in a wild-type manner. These observations show that the ben1-1 null mutation is unstable in the bas1-2 sob7-1 background.
Figure 1.
ben1-1 mutation is unstable in the bas1-2 sob7-1 background. (A) Graphical depiction of BEN1 gene structure and location of T-DNA insertion in the ben1-1 allele. (B) Depiction of the crossing scheme used to isolate bas1-2 sob7-1 ben1-1 triple-mutant. (C) Example of the genetic analysis of ben1-1 allele. (D) Quantitative RT-PCR analysis of BEN1 expression in the wild type, ben1-1 and triple mutant. Error bars indicate SEM.
The BEN1 transcript levels stay steady in the reisolated ben1-1 single mutant lines
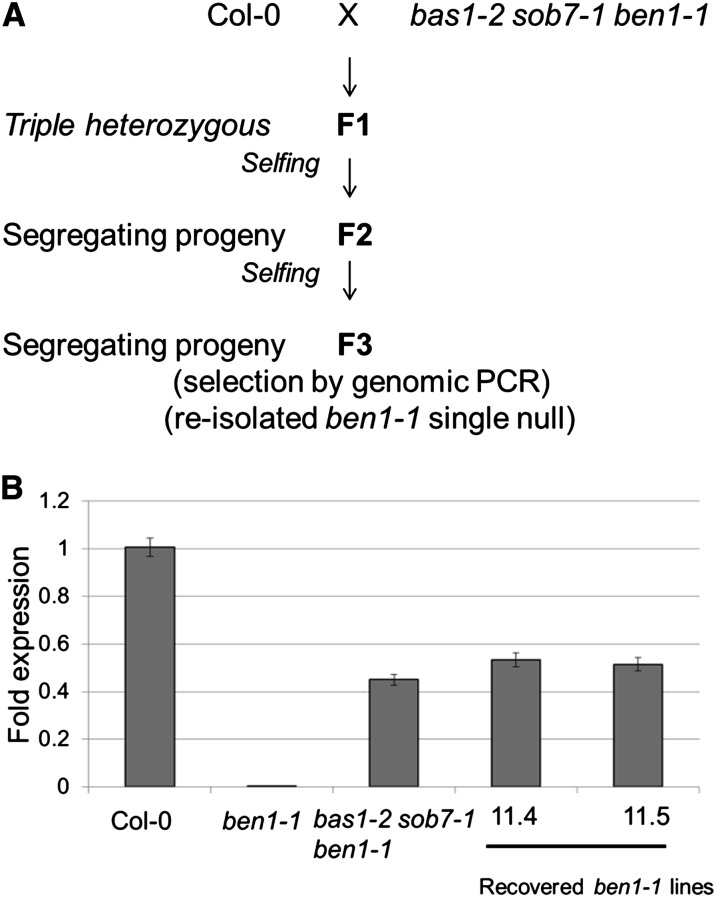
The bas1-2 sob7-1 ben1-1 triple mutant was back crossed to the wild type and in the segregating F3 progeny single ben1-1 mutant lines (# 11.4 and # 11.5) were reisolated (Figure 2A). Interestingly, BEN1 transcript levels in the two reisolated ben1-1 lines were still enhanced relative to the original ben1-1 line and similar to the bas1-2 sob7-1 ben1-1 triple mutant (Figure 2B). The unstable nature of the ben1-1 mutation in the bas1-2 sob7-1 ben1-1 background, and the persistence of this phenotype in the reisolated ben1-1 single-mutant lines, suggests that the ben1-1 locus was modified either genetically or epigenetically in a heritable manner during the creation of the triple mutant.
Figure 2.
The BEN1 transcript levels stay steady in the reisolated ben1-1 single-null lines. (A) Depiction of the crossing scheme used to reisolate ben1-1. (B) Quantitative RT-PCR analysis of the BEN1 transcript in the 5-d-old seedlings of Col-0, original ben1-1, bas1-2 sob7-1 ben1-1, F3# 11.4 (reisolated line), and F3# 11.5 (reisolated line) shows that the transcript accumulation levels in the reisolated lines (F3# 11.4 and F3# 11.5) remain stable at the same level as that of triple mutant line. Error bars indicate SEM.
Reisolated ben1-1 single-null lines are phenotypically different from the original ben1-1 lines
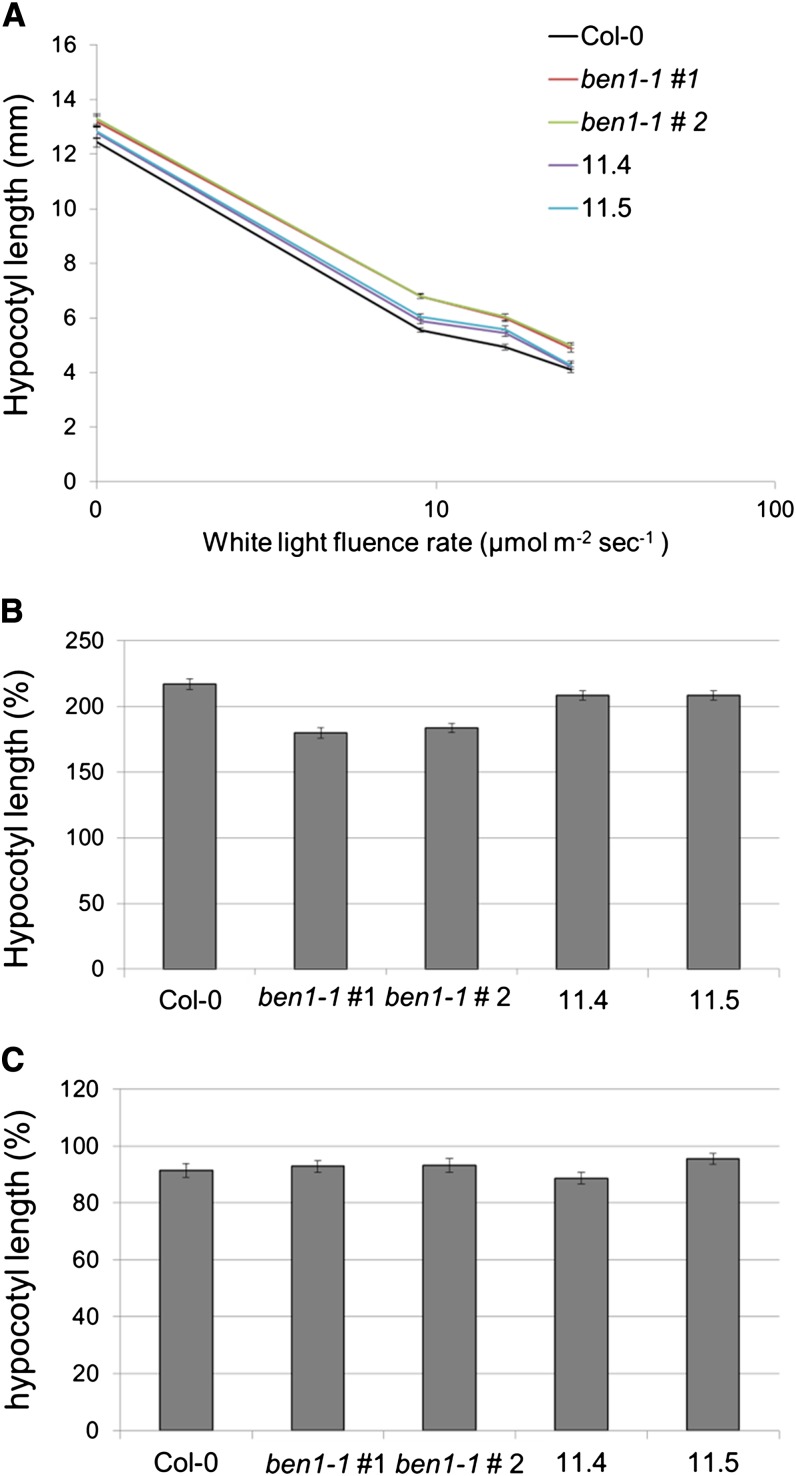
To test the hypothesis that the reisolated ben1-1 mutant lines are also phenotypically different from the original ben1-1 allele, fluence-rate response analysis of the hypocotyl-elongation response was studied in these lines (Figure 3A). The two reisolated ben1-1 lines showed attenuated hypocotyl-elongation phenotypes compared with the two original ben1-1 lines (Figure 3A). At all three fluence rates of white light the reisolated lines displayed significantly shorter hypocotyls than the original ben1-1 lines (P < 0.05). There were no significant differences in hypocotyl-length between the original and the reisolated ben1-1 lines in the dark (P > 0.05). Hypocotyl-elongation responses to exogenous BL treatments were also examined in these lines (Figure 3, B and C). In white light, two original ben1-1 lines showed reduced hypocotyl-elongation compared with the wild type, whereas the behavior of the two reisolated ben1-1 lines was similar to the wild type (Figure 3B). The two original and reisolated ben1-1 lines did not respond differently to BL treatment in darkness (Figure 3C). To test the hypothesis that the epigenetically modified ben1-1 locus is stably inherited, the attenuated hypocotyl-elongation phenotype associated with this locus was also analyzed in the next generation in various genotypic lines. These results indicated that the attenuated hypocotyl-elongation phenotype of the reisolated ben1-1 lines was stably inherited to the next generation (Figure S1).
Figure 3.
Reisolated ben1-1 single-null lines are phenotypically different from the original ben1-1 lines. (A) Fluence-rate analysis of the Col-0, original ben1-1 line #1 and #2, and reisolated ben1-1 lines at three different white-light fluence rates. The hypocotyl length of the reisolated ben1-1 is not significantly different from original ben1-1 (P > 0.05) in the dark. At all three white-light fluence rates, the hypocotyl length of the reisolated ben1-1 is significantly different from original ben1-1 lines (P < 0.05 in all cases). (B) Hypocotyl-elongation response of the reisolated and original ben1-1 lines to the exogenous BL treatment (100 nm BL) in white-light. In white light (24 µmol m−2 sec−1) the hypocotyl-elongation response of the reisolated ben1-1 is similar to the wild-type. The hypocotyl elongation is suppressed by BL treatment in the original ben1-1 lines compared with the wild type. (C) In the dark the hypocotyl-elongation response of the reisolated ben1-1 is not significantly different from original ben1-1 (P > 0.05). To calculate the percentage of BL-negative-control hypocotyl length (as in B and C), each seedling value in BL treatment experiment was normalized to the average of the same genotype in BL negative control experiment. The resulting group of values was used to calculate SEM.
BEN1 transcript accumulation is not feedback regulated by BRs
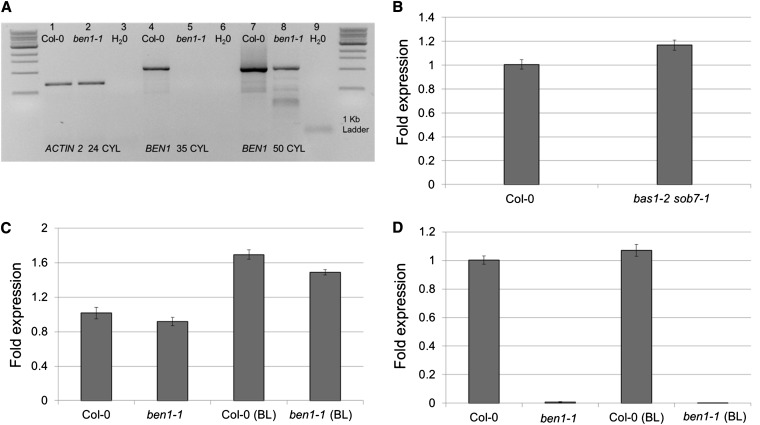
It is possible that the original ben1-1 was a leaky mutation to start with and that the elevated BR levels in the bas1-2 sob7-1 genetic background further increased BEN1 transcript accumulation which amplified the leakiness of ben1-1. To test this hypothesis first, a modified RT-PCR approach was used to detect the rare wild-type-spliced BEN1 transcripts in the original ben1-1 line. As was previously published, after 35 PCR cycles no product was detected in the ben1-1 line (Yuan et al. 2007; Figure 4A). However after 50 PCR cycles, a BEN1 amplification product could be detected, showing the presence of low level wild-type-spliced BEN1 transcript in the original ben1-1 line (Figure 4A).
Figure 4.
The ben1-1 is a leaky mutant based on RT-PCR analysis and the enhanced T-DNA-containing-intron splicing in recovered ben1-1 is not induced by BR feedback regulation. (A) Primer pair, PRT1, and PRT2 was used to amplify full-length coding region of BEN1 transcript. Amplification of ACTIN2 transcript was used as a cDNA loading control (Lane 1 and 2). At 35 cycles no product is detected in the ben1-1 lane (Lane 5) compared with the Col-0 lane (Lane 4). After 50 cycles, the BEN1 transcript is detectable in the ben1-1 lane (Lane 8). Primer sequence information is given in Table S1. (B) BEN1 expression is not affected in the bas1-2 sob7-1 double-null background relative to the wild type background. (C) Exogenous BL treatment induces BAS1 expression in Col-0 and ben1-1 background. (D) Exogenous BL treatment does not induces BEN1 expression in Col-0 and ben1-1 background. Error bars indicate the standard error of the mean (SE).
To further test the hypothesis that the BR feed-back regulation in the bas1-2 sob7-1 background was causing the instability of the ben1-1 mutation, BEN1 transcript levels were examined in the wild-type and the bas1-2 sob7-1 double-null line using quantitative RT-PCR (Figure 4B). BEN1 transcript levels were also examined in response to exogenous BL treatment in the wild type and the original ben1-1 line (Figure 4D). Results showed that compared with the wild type, BEN1 transcript levels were not significantly enhanced in the bas1-2 sob7-1 background (Figure 4B). Moreover, unlike BAS1 (Figure 4C) exogenous BL treatment did not result in any increase in BEN1 transcript accumulation levels in the wild type (Figure 4D). In addition, exogenous BL treatment also did not result in an increased accumulation of wild-type spliced BEN1 transcript in the original ben1-1 line. These observations clearly show that BR-mediated feed-back regulation in the bas1-2 sob7-1 background is not responsible for the ben1-1 mutation instability in the triple mutant.
T-DNA trans-interactions likely cause ben1-1 instability
Given that BEN1 transcript accumulation is not feedback regulated by changing levels of BRs, it is possible that T-DNA trans-interactions between T-DNA insertions located in the bas1-2, sob7-1 and ben1-1 alleles can also lead to ben1-1 mutation instability in the triple-mutant. Epigenetic silencing of the T-DNA-located resistance markers often indicates the presence of T-DNA trans-interactions (Daxinger et al. 2008).
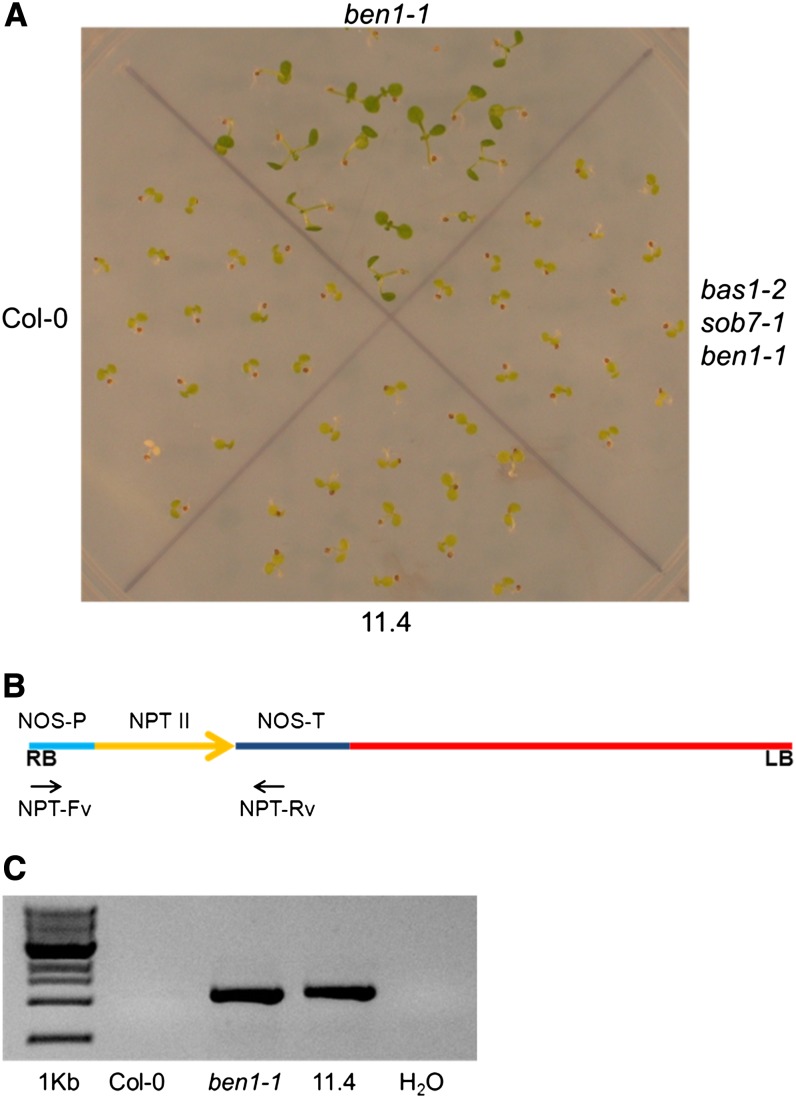
To test this hypothesis, NPTII resistance marker gene function in the ben1-1 T-DNA was examined by planting seeds of the wild type, original ben1-1, triple-mutant and the reisolated ben1-1 (# 11.4) lines on kanamycin containing plant growth media. Seedlings of all the lines except the original ben1-1 line showed complete kanamycin sensitivity (Figure 5A). This observation suggests the presence of T-DNA trans-interactions resulting in silencing of the resistance marker in the triple- and the reisolated ben1-1 single-mutant lines. Another possible explanation for these observations is that the NPTII locus had been mutated during the crossing and recombination process. To test this second possibility, the NPTII gene was amplified and sequenced from both the original and the reisolated ben1-1 lines (Figure 5, B and C). The NPTII gene sequence was found to be unaltered in the original and the reisolated ben1-1 lines (Figure S2). These observations confirm that the loss of the kanamycin resistance marker in the triple-mutant and the reisolated ben1-1 lines is the effect of the presence of T-DNA trans-interactions in the triple-mutant.
Figure 5.
The kanamycin resistance trait, conferred by the T-DNA resistance marker NPTII, is absent in the bas1-2 sob7-1 ben1-1 and the recovered ben1-1 line. (A) Seedlings were grown on the plant media containing kanamycin for 7 d before photographing. (B) The graphic depiction of the location of the primers used to amplify NPTII from the T-DNA. (C) The gel image shows that genomic PCR amplifies bands of equal size from original ben1-1 and the recovered ben1-1 lines.
The ben1-1 T-DNA is differentially methylated in the original and the reisolated ben1-1 lines
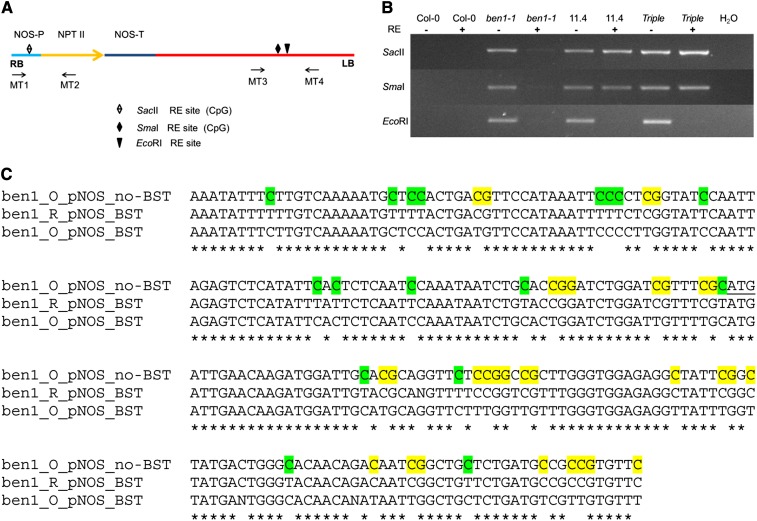
Silencing of the NPTII resistance marker gene in the triple-mutant and reisolated ben1-1 lines suggest that this genomic region has been differentially modified by methylation in the triple-mutant and the reisolated ben1-1 T-DNAs. To test this hypothesis, genomic DNA from the wild type, triple-, original, and reisolated ben1-1 single-mutant lines was digested with CpG methylation sensitive and insensitive restriction enzymes (REs). The restriction site−specific sequences for the CpG methylation sensitive enzymes SacII and SmaI are present in the NPTII promoter and in proximity to the left border of the ben1-1 inserted T-DNA respectively (Figure 6A). The restriction site−specific sequence for the CpG methylation insensitive enzyme EcoRI is located adjacent to the SmaI RE site (Figure 6A). After digestion with REs, genomic DNA was used as a PCR template in which primers flanking the corresponding RE sites were used to prime the amplification (Figure 6A). Results of the PCR amplification showed that the triple mutant and reisolated ben1-1 T-DNA were more resistant to RE digestion by both the CpG methylation sensitive REs compared with the original ben1-1 T-DNA (Figure 6B), whereas there were no differences among these genotypes with regard to EcoRI digestion (Figure 6B). These observations demonstrate that the ben1-1 T-DNA in the triple- and the reisolated ben1-1 single-mutant is differentially methylated in both the promoter region of NPTII gene as well as in the adjacent regions.
Figure 6.
Genomic DNA in the NOS Promoter region of the T-DNA insertion in the recovered ben1-1 shows methylation. (A) Graphic depiction of RE sites and the primer pair locations in the T-DNA used for the methylation study. (B) Genomic PCR amplification from the undigested and the restriction digested DNA of the Col-0, original ben1-1, recovered ben1-1 (11.4), and the bas1-2 sob7-1 ben1-1 (triple). Primer pairs MT1 and MT2 were used to test methylation at the SacII site. Primer pairs MT3 and MT4 were used to test methylation at the SmaI site. Primer pairs MT3 and MT4 were also used to amplify genomic DNA digested with nonmethylation-sensitive EcoRI. PCR amplification, by using SacII site and SmaI/EcoRI flanking PCR primers (Table S1), is seen only from the digested genomic DNA of the recovered ben1-1. (C) NOS promoter and adjacent NPTII DNA was amplified using primers pNOS-BS-F and pNOS-BS-F (Table S1) from the bisulfite converted genomic DNA of the pretriple and the posttriple ben1-1 lines. The nonbisulfite-treated pretriple ben1-1 genomic DNA also was amplified and sequenced for comparison. The differentially methylated cytosine nucleotides are color coded (Yellow are differentially methylated in posttriple ben1-1 and green are differentially demethylated in the posttriple ben1-1 line compared with the pretriple ben1-1 line). Guanine nucleotides are also color coded when they follow methylated cytosine nucleotides to show the CG context. The translation initiation codon ATG for NPTII gene is underlined. BST, bisulfite treatment; ben1_O, pretriple ben1-1; and ben1_R, posttriple ben1-1.
To further understand the genomic context of cytosine methylation, bisulfite conversion and sequencing was performed on the genomic DNA of the pretriple and posttriple ben1-1 lines. The results demonstrated that cytosine nucleotides in the NOS (NOPALINE SYNTHASE) promoter and the adjacent NPTII genomic DNA were differentially methylated (in the CG and CCG context) in the posttriple ben1-1 compared with the pretriple ben1-1 (Figure 6C). Interestingly, many cytosine nucleotides were also differentially demethylated (in a non CG and CCG context) in the posttriple ben1-1 compared with the pretriple ben1-1 line (Figure 6C). Genomic DNA in the part of the BEN1 promoter (immediately upstream of the translation start codon) and second exon-intron junction of the BEN1 gene were also studied for cytosine methylation. The sequencing results showed that cytosine nucleotides in these regions were not methylated in both the pretriple and the bas1-2 sob7-1 ben1-1 triple-mutant lines (Figure S3).
T-DNA size and structure remains unchanged in the original and the reisolated ben1-1 lines
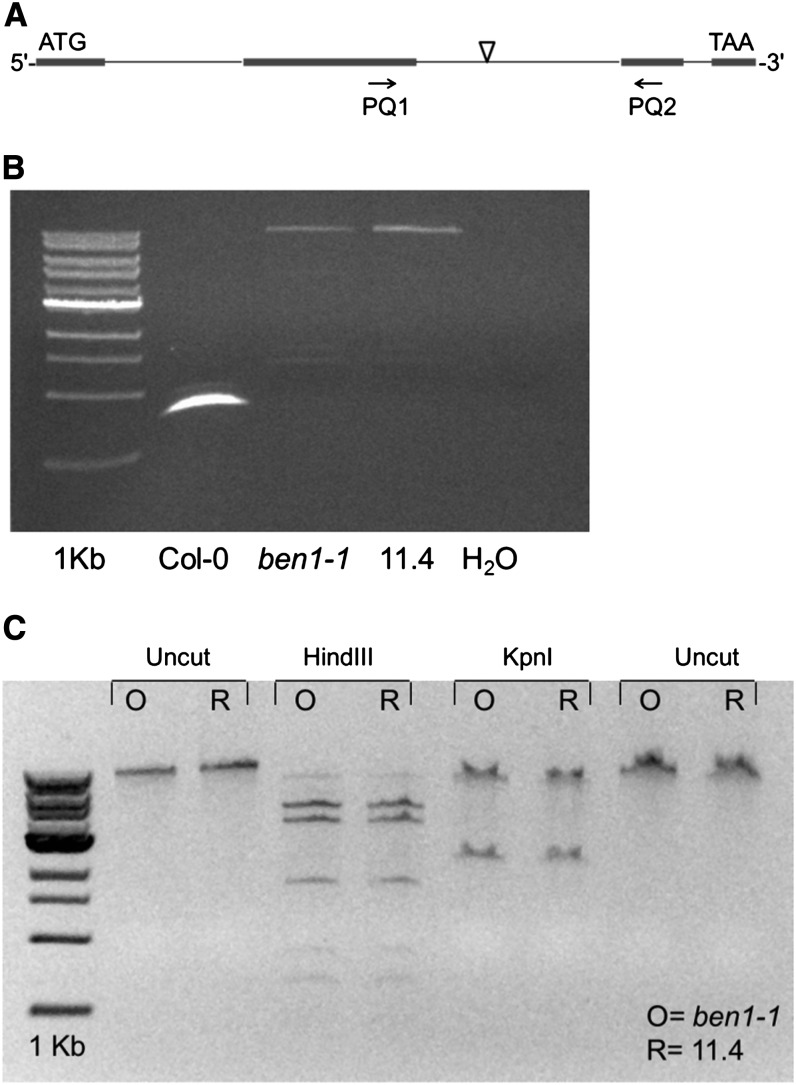
In another scenario, a shortening of T-DNA insertion due to unequal recombination during the creation of the triple-mutant could also result in enhanced BEN1 transcript levels compared with the original ben1-1 line. To test this hypothesis, the inserted T-DNA was amplified from the original and the reisolated ben1-1 lines using primers anchored in the second and third exons of the BEN1 gene (Figure 7A). The PCR results show that, using wild-type DNA as a PCR template gave a band of the size expected in the case of no T-DNA insertion (Figure 7B). On the other hand, both the original and reisolated ben1-1 lines showed a large band of the same size, indicating the presence of approximately two T-DNA insertions in each case (Figure 7B). To further test the possibility of any re-arrangement of the T-DNA in original vs. the reisolated ben1-1, the large T-DNA containing amplification product of the extended PCR (Figure 7B) was purified and cut using two different REs. Identical restriction pattern of the two amplification products showed the absence of any T-DNA rearrangement between the original and the reisolated T-DNA insertions (Figure 7C). These experiments suggest that the T-DNA size and structure have not changed between the original and the reisolated ben1-1 lines.
Figure 7.
The size and sequence of the T-DNA insertion remains unchanged in the pretriple and posttriple ben1-1 lines. (A) Graphic depiction of the location of the second intron flanking primer pair used for amplification in the ben1-1 allele. (B) The genomic PCR using the second intron flanking primers amplify equal size band from the original ben1-1 and the recovered ben1-1 line. (C) The original and the recovered ben1-1 alleles show identical restriction digestion pattern. The PCR amplification product from gel image (B) was gel purified and restriction digested with HindIII and KpnI.
Discussion
As a part of our analysis of BR catabolic enzymes, we generated a genetic triple mutant from a cross between the bas1-2 sob7-1 double-null and ben1-1. Surprisingly, the originally stable ben1-1 mutation was converted to a partial loss-of-function mutation in the triple mutant background (Figure 1D). In addition to this report, the phenomenon of T-DNA mutant instability due to trans T-DNA interactions was also recently described by two groups with different sets of mutants (Gao and Zhao 2012; Xue et al. 2012). To study the genetics of ben1-1 instability, we reisolated the ben1-1 mutation by back crossing the triple mutant with the wild type (Figure 2). Molecular analysis of reisolated ben1-1 lines showed that the unstable state of the ben1-1 mutation in the triple mutant is maintained in an otherwise wild-type background. The BEN1 expression in the triple and the reisolated ben1-1 was intermediate between the wild type and the original ben1-1 mutant. These observations reflect a known phenomenon, that the strength of T-DNA trans-interactions can be locus specific (Xue et al. 2012).
The original and the reisolated ben1-1 single lines also differed phenotypically (Figure 3). The original ben1-1 single-mutant line displays an aberrant hypocotyl-elongation phenotype in white light (Yuan et al. 2007). Compared with the original ben1-1 allele, the reisolated ben1-1 lines displayed significantly different hypocotyl-elongation phenotypes in white-light fluence-rate response experiments as well as in a BL dose-response treatment (Figure 3, A–C). These genetic and molecular observations suggest that the changes in the reisolated ben1-1 are of an epigenetic nature. However, the exact mechanism leading to the enhanced T-DNA-containing intron-splicing is unknown.
In the case of intronic T-DNA insertion mutations, presence of wild-type-spliced transcript is not uncommon (Wang 2008). Additionally, conditional mutant instability has been observed in an intronic T-DNA insertion mutation in the OPR3 (OPDA REDUCTASE 3) gene (Chehab et al. 2011). opr3 is an intronic T-DNA insertion mutant of OPR3 which does not produce any detectable jasmonic acids (JAs) and acts as a complete loss-of-function allele under normal conditions. However, the opr3 allele becomes unstable when mutant plants are infected with a fungus (Chehab et al. 2011). This suggests that environment may play a role in the phenomenon of T-DNA insertion mutant instability.
To test the hypothesis that the epigenetic transformation of ben1-1 in the triple mutant could be due to elevated BR content in the bas1-2 sob7-1 genetic background, we studied BEN1 expression in the bas1-2 sob7-1 double-null. BEN1 expression was not significantly affected in the bas1-2 sob7-1 background (Figure 4B), suggesting that BEN1 is not strongly feedback regulated by changes in BR levels. This finding suggests that increased levels of BR in bas1-2 sob7-1 (Turk et al. 2005) did not result in ben1-1 instability in the triple-mutant background (Figure 4B). Another possible explanation is that BEN1 is not expressed in the same tissues where both BAS1 and SOB7 are expressed. bas1-2 and sob7-1 single-null mutants do not have altered BR levels. Because BAS1 and SOB7 expression patterns do not overlap completely (Sandhu et al. 2012), it is possible that all tissues in the bas1-2 sob7-1 double-null do not have altered BR levels. Analysis of the publically available microarray data suggests that BEN1 transcript accumulation is not significantly affected by BL treatment (Winter et al. 2007). To complement the microarray data analysis, we also studied BEN1 expression in the wild type and the original ben1-1 single-mutant in response to exogenous BL (Figure 4D). BAS1 expression was also studied in the same experiment to compare BEN1 gene expression response to a known BR-feedback regulated gene. The results of gene expression analysis also showed that BEN1 expression is not affected by BL treatment and hence it is highly unlikely that BR feed-back regulation is responsible for the ben1-1 instability (Figure 4, C and D).
Because the mutagenic T-DNA is the same in bas1-2, sob7-1, and ben1-1 (Alonso et al. 2003), a possible cause of ben1-1 instability could be the effect of T-DNA trans-interactions. As documented previously, T-DNA trans-interactions can result in the loss of antibiotic resistance (Daxinger et al. 2008). In fact, the original ben1-1 mutant seedlings showed kanamycin resistance, whereas the reisolated lines as well as the triple were completely sensitive to kanamycin (Figure 5A). Interestingly, the loss of kanamycin resistance also showed an epigenetic pattern of inheritance. Similar loss of kanamycin resistance is observed in the case of yuc1-1 (yucca1-1) and ag-TD (agamous-TDNA insertion mutant) interactions (Gao and Zhao 2012).
Silencing of homologous genes is known to be an effect of T-DNA trans-interactions (Daxinger et al. 2008). The silencing of a GUS reporter gene in activation tagging lines with multiple insertions was also found to be associated with methylation of the CaMV35S enhancer elements in those T-DNAs (Chalfun-Junior et al. 2003). Homology-induced silencing is also associated with a phenomenon known as RNA-directed DNA methylation in the region of RNA-DNA homology (Wasseneger 2000). In fact, the promoter region of the reisolated ben1-1 line T-DNA showed cytosine methylation, which is not the case with the original ben1-1 T-DNA (Figure 6B). The T-DNA methylation was also observed in the region adjacent to the NPTII locus (Figure 6B). The spread of DNA methylation to adjacent parts of the RNA-DNA homology region has previously been documented (Wasseneger 2000). Another possibility is that apart from the NPTII gene, the mRNA transcribed from other parts of the T-DNA is also present in the ben1-1 mutant.
T-DNA trans-interactions have also been associated with instability of an intronic T-DNA insertion mutant (Gao and Zhang 2012; Xue et al. 2012). However, currently there is no direct evidence which supports that the mutant instability is caused directly by T-DNA trans-interactions. The most significant difference in the original and the reisolated ben1-1 lines is the presence of methylation in the reisolated ben1-1 T-DNA region (Figure 6). Methylation has also been shown to be responsible for the instability of the cobra SALK T-DNA mutant (Xue et al. 2012). The epicob-6 (epigenetic cob-6) mutant phenotype was reverted back to the cob-6 phenotype, when grown on media containing methylation inhibitors. In addition, the epicob-6 reversion phenomenon was shown to happen in genetic backgrounds lacking enzymes required for CG and CHG DNA methylation (Xue et al. 2012). In agreement with Xue et al. (2012), our bisulfite sequencing analysis also showed that cytosine methylation in the unstable ben1-1 T-DNA was in the CG and CCG context (Figure 6C). Interestingly, cytosine de-methylation (in the non CG context) was also observed in the posttriple ben1-1 line suggesting that this phenomenon may also contribute to epigenetic instability of the ben1-1 T-DNA insertion.
One mechanism that can explain this epigenetic suppression is RNA/RNA interactions between a long transcribed RNA from the gene and the T-DNA and a complementary RNA from the T-DNA (Gao and Zhao 2012). Our observation that cytosine methylation is located only in the ben1-1 T-DNA region and absent in other parts of the ben1-1 locus (Figure 6 and Figure S3) supports this hypothesis. This phenomenon is similar to the epigenetic changes in gene expression caused by long intronic non-coding RNAs (Heo and Sung 2010). This mechanism may also cause instability for exonic T-DNA insertion mutations.
Another possible mechanism is that methylation of the T-DNA region is altering the splicing efficiency of the T-DNA containing intron. The splicing efficiency could be affected by a change in the size of the T-DNA insertion due to events such as unequal recombination. However, the size of T-DNA insertion and structure is unchanged in the pre- and posttriple ben1-1 mutant lines (Figure 7). The most significant difference in the original and the reisolated ben1-1 lines is the presence of methylation in the reisolated ben1-1 T-DNA region (Figure 6).
RNA-induced DNA methylation has been associated with chromatin modification (Aufsatz et al. 2002a,b). Chromatin modifications in turn have been linked to the regulation of pre-mRNA splicing by many studies (for review, see Hnilicová and Staněk 2011). For example, alternative splicing in the CD44 gene required proper recruitment of argonaute RNAi proteins to the CD44 transcribed regions (Ameyar-Zazoua et al. 2012). Therefore, it is possible that the methylation of the T-DNA region is altering the splicing efficiency of the T-DNA containing intron. However, more studies are required to test the association between T-DNA methylation and the T-DNA containing intron splicing. Primarily, this study indicates the need for more caution while using T-DNA insertional mutants. Ultimately, this study also highlights a need for an alternative high-throughput technology for generating and cataloging genetic mutants. In the future, EMS mutagenesis coupled with improved low-price, high-throughput sequencing technologies may provide additional alleles for genetic analysis. Future directions for this study will include isolation of additional mutations in the BEN1 locus. An EMS mutagenesis approach (Street et al. 2008) using the activation-tagged mutant ben1-D will be used to isolate true null-alleles of BEN1.
Supplementary Material
Acknowledgments
We thank Dr. Jia Li for providing ben1-1 seeds on our request. We also thank William R. Buckley and other Neff lab members for their critical review of this manuscript. This research was supported by the National Science Foundation 0758411 (to M.M.N.).
Footnotes
Communicating editor: J. Dekker
Literature Cited
- Alonso J. M., Stepanova A. N., Leisse T. J., Kim C. J., Chen H., et al. , 2003. Genome-wide insertional mutagenesis of Arabidopsis thaliana. Science 301: 653–657 [DOI] [PubMed] [Google Scholar]
- Ameyar-Zazoua M., Rachez C., Souidi M., Robin P., Fritsch L., et al. , 2012. Argonaute proteins couple chromatin silencing to alternative splicing. Nat. Struct. Mol. Biol. 19: 998–1004 [DOI] [PubMed] [Google Scholar]
- An G., Lee S., Kim S. H., Kim S. R., 2005. Molecular genetics using T-DNA in rice. Plant Cell Physiol. 46: 14–22 [DOI] [PubMed] [Google Scholar]
- Aufsatz W., Mette M. F., Van Der Winder J., Matzke A. J. M., Matzke M., 2002a RNA-directed DNA methylation in Arabidopsis. Proc. Natl. Acad. Sci. USA 99: 16499–16506 [DOI] [PMC free article] [PubMed] [Google Scholar]
- Aufsatz W., Mette M. F., Van Der Winder J., Matzke M., Matzke A. J. M., 2002b HDA6, a putative histone deacetylase needed to enhance DNA methylation induced by double-stranded RNA. EMBO J. 21: 6832–6841 [DOI] [PMC free article] [PubMed] [Google Scholar]
- Chalfun-Junior A., Mes J. J., Mlynarova L., Aarts M. G., Angenent G. C., 2003. Low frequency of T-DNA based activation tagging in Arabidopsis is correlated with methylation of CaMV 35S enhancer sequences. FEBS Lett. 555: 459–463 [DOI] [PubMed] [Google Scholar]
- Chehab E. W., Kim S., Savchenko T., Kliebenstein D., Dehesh K., et al. , 2011. Intronic T-DNA insertion renders Arabidopsis opr3 a conditional jasmonic acid-producing mutant. Plant Physiol. 156: 770–778 [DOI] [PMC free article] [PubMed] [Google Scholar]
- Daxinger L., Hunter B., Sheikh M., Jauvion V., Gasciolli V., et al. , 2008. Unexpected silencing effects from T-DNA tags in Arabidopsis. Trends Plant Sci. 13: 4–6 [DOI] [PubMed] [Google Scholar]
- Gao Y., Zhao Y., 2012. Epigenetic Suppression of T-DNA Insertion Mutants in Arabidopsis. Mol. Plant. 6: 539−545 [DOI] [PMC free article] [PubMed] [Google Scholar]
- Heo J. B., Sung S., 2010. Vernalization-mediated epigenetic silencing by a long intronic noncoding RNA. Science 331: 76–79 [DOI] [PubMed] [Google Scholar]
- Hnilicová J., Staněk D., 2011. Where splicing joins chromatin. Nucleus 2: 182–188 [DOI] [PMC free article] [PubMed] [Google Scholar]
- Krysan P. J., Young J. C., Sussman M. R., 1999. T-DNA as an insertional mutagen in Arabidopsis. Plant Cell 11: 2283–2290 [DOI] [PMC free article] [PubMed] [Google Scholar]
- Neff M. M., Nguyen S. M., Malancharuvil E. J., Fujioka S., Noguchi T., et al. , 1999. BAS1: A gene regulating brassinosteroid levels and light responsiveness in Arabidopsis. Proc. Natl. Acad. Sci. USA 96: 15316–15323 [DOI] [PMC free article] [PubMed] [Google Scholar]
- Sandhu K. S., Hagely K., Neff M. M., 2012. Genetic interactions between brassinosteroid-inactivating P450s and photomorphogenic photoreceptors in Arabidopsis thaliana. G3 2: 1585–1593 [DOI] [PMC free article] [PubMed] [Google Scholar]
- Sessions A., Burke E., Presting G., Aux G., McElver J., et al. , 2002. A high-throughput Arabidopsis reverse genetics system. Plant Cell 14: 2985–2994 [DOI] [PMC free article] [PubMed] [Google Scholar]
- Street I. H., Shah P. K., Smith A. M., Avery N., Neff M. M., 2008. The AT-hook-containing proteins SOB3/AHL29 and ESC/AHL27 are negative modulators of hypocotyl growth in Arabidopsis. Plant J. 54: 1–14 [DOI] [PubMed] [Google Scholar]
- Tanaka K., Asami T., Yoshida S., Nakamura Y., Matsuo T., et al. , 2005. Brassinosteroid homeostasis in Arabidopsis is ensured by feedback expressions of multiple genes involved in its metabolism. Plant Physiol. 138: 1117–1125 [DOI] [PMC free article] [PubMed] [Google Scholar]
- Thole V., Peraldi A., Worland B., Nicholson P., Doonan J. H., et al. , 2011. T-DNA mutagenesis in Brachypodium distachyon. J. Exp. Bot. 63: 567–576 [DOI] [PubMed] [Google Scholar]
- Turk E. M., Fujioka S., Seto H., Shimada Y., Takatsuto S., et al. , 2003. CYP72B1 inactivates brassinosteroid hormones: an intersection between photomorphogenesis and plant steroid signal transduction. Plant Physiol. 133: 1643–1653 [DOI] [PMC free article] [PubMed] [Google Scholar]
- Turk E. M., Fujioka S., Seto H., Shimada Y., Takatsuto S., et al. , 2005. BAS1 and SOB7 act redundantly to modulate Arabidopsis photomorphogenesis via unique brassinosteroid inactivation mechanisms. Plant J. 42: 23–34 [DOI] [PubMed] [Google Scholar]
- Wang Y. H., 2008. How effective is T-DNA insertional mutagenesis in Arabidopsis. J. Bioch. Tech. 1: 11–20 [Google Scholar]
- Wassenegger M., 2000. RNA-directed DNA methylation. Plant Mol. Biol. 43: 203–220 [DOI] [PubMed] [Google Scholar]
- Winter D., Vinegar B., Nahal H., Ammar R., Wilson G. V., et al. , 2007. An “Electronic Fluorescent Pictograph” browser for exploring and analyzing large-scale biological data sets. PLoS ONE 2: e718. [DOI] [PMC free article] [PubMed] [Google Scholar]
- Xue W., Ruprecht C., Street N., Hematy K., Chang C., et al. , 2012. Paramutation-like interaction of T-DNA loci in Arabidopsis. PLoS ONE 7: e51651. [DOI] [PMC free article] [PubMed] [Google Scholar]
- Yuan T., Fujioka S., Takatsuto S., Matsunoto S., Gou X., et al. , 2007. BEN1, a gene encoding a dihydroflavonol 4-reductase (DFR)-like protein, regulates the levels of brassinosteroids in Arabidopsis thaliana. Plant J. 51: 220–233 [DOI] [PubMed] [Google Scholar]
Associated Data
This section collects any data citations, data availability statements, or supplementary materials included in this article.


