Abstract
Obesity is consistently increasing in prevalence and can trigger insulin resistance and type 2 diabetes. Many lines of evidence have shown that macrophages play a major role in inflammation associated with obesity. This study was conducted to determine metformin, a widely prescribed drug for type 2 diabetes, would regulate inflammation through down-regulation of scavenger receptors in macrophages from obesity-induced type 2 diabetes. RAW 264.7 cells and peritoneal macrophages were stimulated with LPS to induce inflammation, and C57BL/6N mice were fed a high-fat diet to generate obesity-induced type 2 diabetes mice. Metformin reduced the production of NO, PGE2 and pro-inflammatory cytokines (IL-1β, IL-6 and TNF-α) through down-regulation of NF-κB translocation in macrophages in a dose-dependent manner. On the other hand, the protein expressions of anti-inflammatory cytokines, IL-4 and IL-10, were enhanced or maintained by metformin. Also, metformin suppressed secretion of TNF-α and reduced the protein and mRNA expression of TNF-α in obese mice as well as in macrophages. The expression of scavenger receptors, CD36 and SR-A, were attenuated by metformin in macrophages and obese mice. These results suggest that metformin may attenuate inflammatory responses by suppressing the production of TNF-α and the expressions of scavenger receptors.
Keywords: Metformin, Obesity-induced inflammation, TNF-α, Scavenger receptors
INTRODUCTION
The prevalence obesity is rapidly increasing all over the world (1,2). Obesity triggers many diseases, such as type 2 diabetes, atherosclerosis, hypertension, fatty liver and osteoarthritis (3,4). Diabetes mellitus is a chronic metabolic disease, and its incidence is consistently increasing (5). Type 2 diabetes is positively correlated with impaired insulin sensitivity (6). Insulin resistance is strongly associated with obesity and many studies have shown that inflammatory responses by macrophages can induce insulin resistance in obese subjects (7-9).
Macrophages account for 10% of all cells in lean adipose tissues (10,11). Macrophages maintain a low inflammatory state as stimulated by anti-inflammatory cytokines, such as interleukin (IL)-4 and IL-10. Anti-inflammatory cytokines regulate excessive inflammation and improve insulin sensitivity (12,13). However, the percentage of macrophages in obese adipose tissue is increased by 40% through macrophage infiltration promoted by chemokines from adipocytes (10,11). Infiltrated macrophages attract other macrophages and accumulated macrophages secrete pro-inflammatory cytokines such as IL-1β, IL-6 and tumor necrosis factor (TNF)-α. Pro-inflammatory cytokines promote unnecessary inflammation and trigger insulin resistance (14,15).
Macrophages express many types of scavenger receptors which bind and internalize modified low-density lipoprotein (LDL) (16). Scavenger receptors have been well-known to be implicated in the development of atherosclerosis by contributing to macrophage foam cell formation (17,18). Numerous studies have subsequently reported that scavenger receptors can recognize and clear modified host component, apoptotic cells and pathogens, indicating that scavenger receptors play an essential role in innate immunity and inflammatory responses (18-20). Scavenger receptors enhance NF-κB activity through the uptake of lipopolysaccharide (LPS) and oxidized LDL (oxLDL), leading to pro-inflammatory cytokine production (21,22).
Metformin (1, 1-dimethylbiguanide) is a widely prescribed drug for the type 2 diabetes (23). Metformin has anti-hyperglycemic effects by suppressing gluconeogenesis and glycogenolysis in the liver, enhancing glucose uptake in muscle and inhibiting glucose absorption from the small intestine (24,25). Metformin also has anti-hyperlipidemic effects by reducing free fatty acids, triglycerol and very low-density lipoproteins (VLDL) in blood (26). The main molecular target of metformin is AMP-activated protein kinase (AMPK) and this anti-diabetic effect improves insulin sensitivity (27-29). It has been shown that metformin can serve as potential drug to treat inflammation-related disorders (30-33). However, the mechanism of action of metformin on inflammation is not clearly understood. This study was conducted to determine whether metformin would regulate inflammation through down-regulation of scavenger receptors in macrophages from mice with high-fat diet induced type 2 diabetes.
MATERIALS AND METHODS
Reagents
Metformin (Diabex®) was obtained from Daewoong Pharm. Co., Ltd. (Seoul, Republic of Korea) and dissolved in dimethylsulfoxide (DMSO, Sigma-Aldrich Co, St. Louis, MO, USA). Dulbecco's Modified Eagle's Medium (DMEM)-1640, fetal bovine serum (FBS) and penicillin/streptomycin solution were obtained from Hyclone (Logan, UT, USA) and used for cell culture. Anti-inducible nitric oxide synthase (iNOS), anti-cyclooxygenase-2 (COX-2), anti-IL-1β, anti-IL-6 and anti-phosphorylated form of inhibitors of κB alpha (pIκBα) were purchased from Santa Cruz Biotechnology, Inc. (Santa Cruz, CA, USA), anti-TNF-α from eBioscience (San Diego, CA, USA), anti-IL-4 and anti-IL-10 from BD Pharmingen (San Jose, CA, USA), anti-p65 from Enzo Life Science Inc. (Farmingdale, LY, USA), and anti-phosphorylated form of AMPK (pAMPK) and anti-AMPK from Cell Signaling Technology, Inc. (Danvers, MA, USA). The enhanced chemiluminescence solution kit was purchased from DAEILLAB SERVICE Co., Ltd. (Seoul, Republic of Korea). Untill specified otherwise, all other chemicals were purchased from Sigma-Aldrich Co.
Animals
Male ICR mice (6~8 weeks) were purchased from Samtaco Inc. (Gyeonggi-Do, Republic of Korea), and male C57BL/6N mice (4 weeks) were purchased from Orient Bio Inc. (Gyeonggi-Do, Republic of Korea). The mice were kept in a temperature-controlled animal facility under a 12-hr light-dark cycle at 22±2℃ and 55±5% humidity and were fed rodent laboratory chow with sterile water ad libitum. The mice were treated in accordance with the guidelines for the care and use of laboratory animals issued by Sahmyook University.
Cell culture
RAW 264.7 cells, a murine macrophage cell line, were obtained from American Type Culture Collection (ATCC, Rockville, MD, USA). The cells were maintained in DMEM, supplemented with 10% heat-inactivated FBS, 10,000 U/ml penicillin and 10,000 µg/ml streptomycin at 37℃ with 5% CO2.
Isolation of peritoneal macrophages
To stimulate peritoneal macrophages, 3% thioglycollate broth was intraperitoneally injected into ICR mice. After 4 days, the mice were sacrificed, and cold phosphate-buffered saline (PBS) was applied to the peritoneal cavity using a syringe. The abdominal site was gently kneaded for 3 minutes. Peritoneal macrophages were collected using a syringe and treated with ACK buffer (50 mM NH4Cl, 1 M KHCO3, 0.1 mM Na2EDTA, pH 7.2-7.4) to lyse erythrocytes. Peritoneal macrophages were incubated in DMEM, supplemented with 10% heat-inactivated FBS, 10,000 U/ml penicillin and 10,000 µg/ml streptomycin at 37℃ with 5% CO2.
Diets and experimental design
C57BL/6N mice were randomly assigned to 3 groups. One group was given a regular diet (Open Source diets #D12450B; Research Diets Inc., New Brunswick, NJ, USA) containing 10% fat, while the other 2 groups were given a high-fat diet (Open Source diets #D12492; Research Diets Inc.) containing 60% fat to induce obesity for 16 weeks. After 16 weeks, the group of mice fed a the high-fat diet was administered 250 mg/kg metformin for 8 weeks using a feeding needle. At the completion of the experiment, the mice were sacrificed and blood samples were taken from the heart and centrifuged at 3,700 rpm for 7 minutes in order to isolate serum. The isolated serum was stored at -80℃ and used for cytokine assays. White adipose tissues (WATs) were removed from periepididymal and perirenal fat, frozen immediately in liquid nitrogen and stored at -70℃. WATs were used the detection of protein and mRNA expression.
Measurement of NO production
The concentration of nitric oxide (NO) produced by LPS-stimulated macrophages was measured by NO assay. RAW 264.7 cells and peritoneal macrophages (2×10⁵ cells/well) were incubated with various concentrations of metformin in the presence of LPS overnight at 37℃ with 5% CO2. The culture medium of each sample was mixed with same volume of Griess reagent (stock I: 0.2% n-1-naphthylenediamine dihydrochloride, stock II: 2% sulfanilamide in 5% H3PO4). Light absorbance was measured at 540 nm.
Cytokine assay
Production of IL-1β, IL-6, TNF-α and prostaglandin E2 (PGE2) was measured using commercially available enzyme-linked immunosorbent assay (ELISA) kits from eBioscience Inc., BD Pharmingen and Enzo Life Sciences Inc. Macrophages were treated with LPS and different concentrations of metformin for 24 hours at 37℃ with 5% CO2. The supernatant was collected and assayed according to the manufacturer's instructions. Serum TNF-α levels were also measured in DIO mice using the ELISA kit (BD Pharmingen). Stored serum was used in assays according to the manufacturer's instructions.
Total RNA isolation and RT-PCR
Total RNA was extracted from macrophages and WAT in mice using the RiboEx™ RNA purification kit (GeneAll Biotechnology Co., Ltd., Seoul, Republic of Korea) in an RNase-free environment. The reverse transcription of quantified RNA was carried out by using M-MLV reverse transcriptase (Invitrogen, Carlsbad, CA, USA), an oligo (dT) 16 primer, dNTP (10 mM each) and 0.1 M DTT. After incubation at 65℃ for 5 minutes and 37℃ for 60 minutes, M-MLV reverse transcriptase was inactivated by heating at 70℃ for 15 minutes. The polymerase chain reaction (PCR) was performed with 25 mM MgCl2, dNTP mix (2.5 mM each), 2.5 U/µl of Taq DNA polymerase and 10 pM of each primer set for iNOS, COX-2, IL-1β, IL-6, TNF-α, scavenger receptor A (SR-A) and CD36. The cDNA was amplified by 30 cycles of denaturing at 94℃ for 45 seconds, annealing at 60℃ for 45 seconds, and extension at 72℃ for 1 minutes. The final extension was performed at 72℃ for 5 minutes. The PCR products were then electrophoresed on 1% agarose gels and visualized with ethidium bromide (EtBr). The primer sequences were as follows: 5' AGCTCCTCCCAGGACCACAC 3' (forward) and 5' ACGCTGAGTACCTCATTGGC 3' (reverse) for iNOS, 5' AAGAAGAAAGTTCATTCCTGATCCC 3' (forward) and 5' TGACTGTGGGAGGATACATCTCTC 3' (reverse) for COX-2, 5' CAGGATGAGACATGACACC 3' (forward) and 5' CTCTGCAGACTCAAACTCCAC 3' (reverse) for IL-1β, 5' GTACTCCAGAAGACCAGAGG 3' (forward) and 5' TGCTGGTGACAACCACGGCC 3' (reverse) for IL-6, 5' TTGACCTCAGCGCTGAGTTG 3' (forward) and 5' CCTGTAGCCCACGTCGTAGC 3' (reverse) for TNF-α, 5' AGTAGGCGTGGGTCTGAAGG 3' (forward) and 5' CTTGCTTGCCCAGTCACAGG 3' (reverse) for CD36, 5' GGAGACAGAGGGCTTACTGG 3' (forward) and 5' GTTGATCCGCCTACACTCCC 3' (reverse) for SR-A, 5' GTGGGCCGCCCTAGGACCAG 3' (forward) and 5' GGAGGAAGAGGATGCGGCAGT 3' (reverse) for β-actin and 5' CAACTTTGGCATTGTGGAAGG 3' (forward) and 5' ATGGAAATTGTGAGGGAGATGC 3' (reverse) for GAPDH. GAPDH and β-actin were used as an internal control.
Western blot analysis
Macrophages were lysed with buffer (150 mM NaCl, 0.02% sodium azide, 1% Triton X-100, 100 µg/ml phenylmethylsulfonyl fluoride (PMSF), and 1 µg/ml aprotinin, 50 mM Tris-Cl buffer, pH 8.0). Stored WAT also lysed with buffer after being frozen in liquid nitrogen. The samples were centrifuged at 4℃, 13,000 rpm for 30 minutes and protein concentrations of the supernatant were determined by BCA assay (Thermo Fisher Scientific Inc., Rockford, IL, USA). Then 20 µg of protein from cell lysates was electrophoresed on 12~15% SDS-polyacrylamide gels and transferred to nitrocellulose membranes. The membranes were blocked with 5% skim milk in 0.1% Tween-20 in Tris-buffered saline (TBST) for 1 hour. After blocking, the membranes were incubated with anti-iNOS, anti-IL-1β, anti-IL-6, anti-pIκBα, anti-TNF-α, anti-IL-4, anti-IL-10, anti-p65, anti-pAMPK, and anti-AMPK monoclonal antibodies for 16 hours. The membranes were washed with TBST for 1 hour and incubated with alkaline phosphatase (AP) or horseradish peroxidase (HRP)-labeled secondary antibody for 2 hours. The bands of the membranes incubated with AP-conjugated secondary antibody were visualized using AP buffer containing BCIP and NBT, or the bands on membranes incubated with HRP-conjugated secondary antibody were visualized using an ECL solution kit.
Statistical analysis
All data are presented as the mean±SEM. Significant differences (p<0.05) between the groups were evaluated using one-way analysis of variance in SPSS for windows (SPSS Inc., Chicago, IL, USA).
RESULTS
Effects of metformin on the production of NO and PGE2
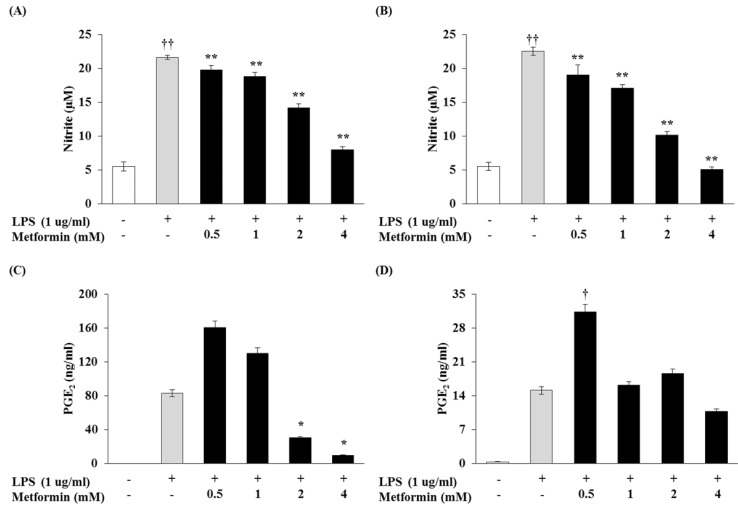
The effect of metformin on NO production in LPS-induced macrophages were examined. RAW 264.7 cells and peritoneal macrophages did not release NO in control group (medium alone); LPS (1 µg/ml) was used as a positive control for macrophage activation (Fig. 1A and B). Various concentrations of metformin (0.5, 1, 2, and 4 mM) reduced NO production in a dose-dependent manner. We investigated whether metformin would reduce PGE2 production. Metformin at concentrations of 2 and 4 mM significantly reduced LPS-induced PGE2 production in RAW 264.7 cells (Fig. 1C), though there was no significant difference in PGE2 production between RAW 264.7 cells and peritoneal macrophages (Fig. 1D).
Figure 1.
Metformin reduces the productions of NO and PGE2 in macrophages. RAW 264.7 cells (A and C) and peritoneal macrophages (B and D) were cultured with different concentrations of metformin (0.5, 1, 2, and 4 mM) in the presence of LPS (1 µg/ml) overnight (A and C) or 24 hrs (B and D). NO production was confirmed by NO assay and PGE2 production was detected by ELISA. The results were reported as the mean±S.D. of three independent experiments. ††p<0.01 and †p<0.05 compared with cells only. **p<0.01 and *p<0.05 compared with LPS only.
Production of pro-inflammatory cytokines inhibited by metformin
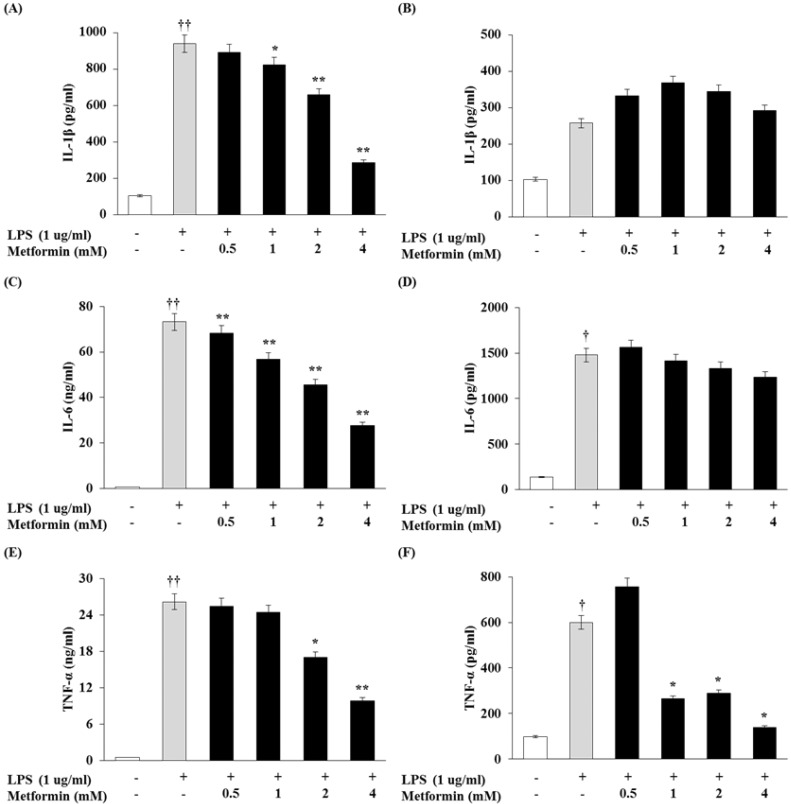
To determine whether metformin would have an effect on cytokine production, the levels of IL-1β, IL-6, and TNF-α were measured in the macrophages by ELISA. As shown in Fig. 2A, C and E, metformin dose-dependently inhibited IL-1β, IL-6, and TNF-α production in RAW 264.7 cells. In peritoneal macrophages, production of TNF-α was significantly inhibited by metformin (Fig. 2F) whereas production of IL-1β and IL-6 levels was not (Fig. 2B and D).
Figure 2.
Metformin decreases proinflammatory cytokine production in macrophages. RAW 264.7 cells (A, C and E) and peritoneal macrophages (B, D and F) were cultured with different concentrations of metformin (0.5, 1, 2, 4 mM) in the presence of LPS (1 µg/ml) for 24 hrs. IL-1β, IL-6 and TNF-α production were detected by ELISA. The results were reported as the mean±S.D. of three independent experiments. ††p<0.01 and †p<0.05 compared with cells only. **p<0.01 and *p<0.05 compared with LPS only.
Protein and mRNA expressions of inflammatory mediators modulated by metformin
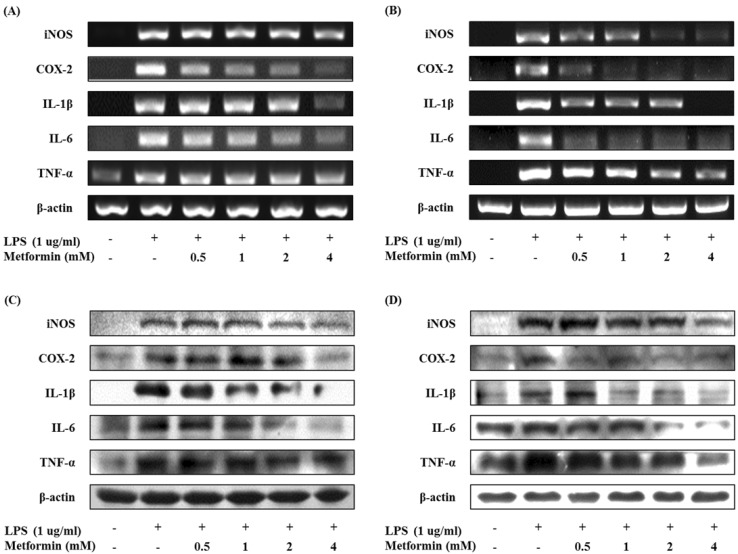
The mRNA expression of inflammatory mediators were assessed by RT-PCR. Metformin dose-dependently down-regulated the mRNA levels of iNOS, COX-2, IL-1β, IL-6 and TNF-α in LPS-stimulated RAW 264.7 cells and peritoneal macrophages (Fig. 3A and B). Western blot analysis revealed that the protein levels of iNOS, COX-2, IL-1β, IL-6 and TNF-α also suppressed by metformin (Fig. 3C and D). These results suggest that metformin inhibited production of NO, PGE2 and pro-inflammatory cytokines through impaired protein and mRNA expressions in LPS-induced macrophages.
Figure 3.
Metformin down-regulates the expressions of iNOS, COX-2, and proinflammatory cytokines in macrophages. RAW 264.7 cells (A and C) and peritoneal macrophages (B and D) were cultured with different concentrations of metformin (0.5, 1, 2, and 4 mM) in the presence of LPS (1 µg/ml) for 24 hours. The mRNA expressions of iNOS, COX-2, IL-1β, IL-6, and TNF-α were analyzed by RT-PCR (A and B). The protein expressions of iNOS, COX-2, IL-1β, IL-6, and TNF-α were analyzed by Western blotting (C and D).
Effects of metformin on the expression of anti-inflammatory cytokines
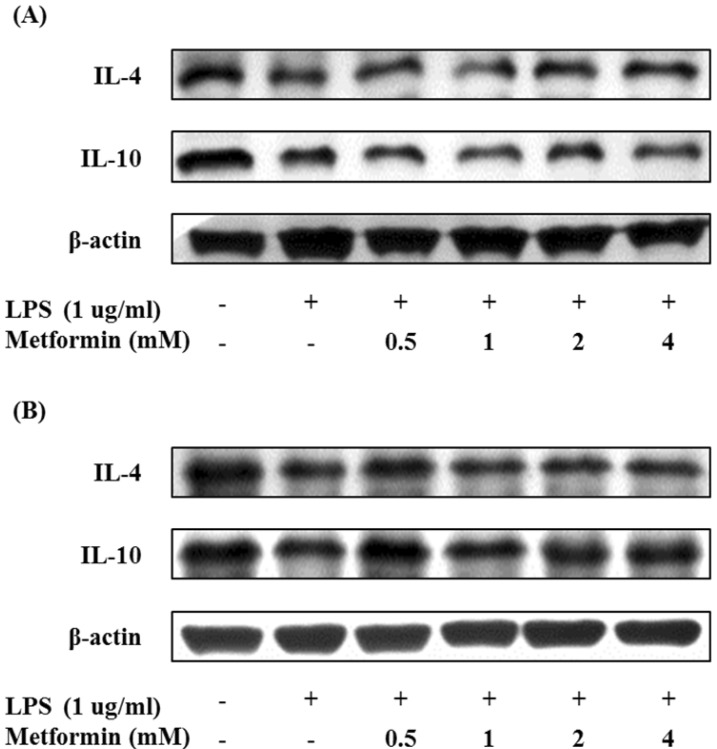
In order to investigate the effect of metformin on the expression of anti-inflammatory cytokines in macrophages, the levels of IL-4 and IL-10 were measured by Western blotting. Metformin enhanced or maintained the protein expression of IL-4 and IL-10 in RAW 264.7 cells and peritoneal macrophages (Fig. 4). These results suggest that metformin could prevent inflammation by inducing IL-4 and IL-10.
Figure 4.
Metformin enhances the expressions of anti-inflammatory cytokines in macrophages. RAW 264.7 cells (A) and peritoneal macrophages (B) were cultured with different concentrations of metformin (0.5, 1, 2, and 4 mM) in the presence of LPS (1 µg/ml) for 24 hours. The expression of IL-4 and IL-10 were analyzed by Western blotting.
Suppression of NF-κB activation by metformin
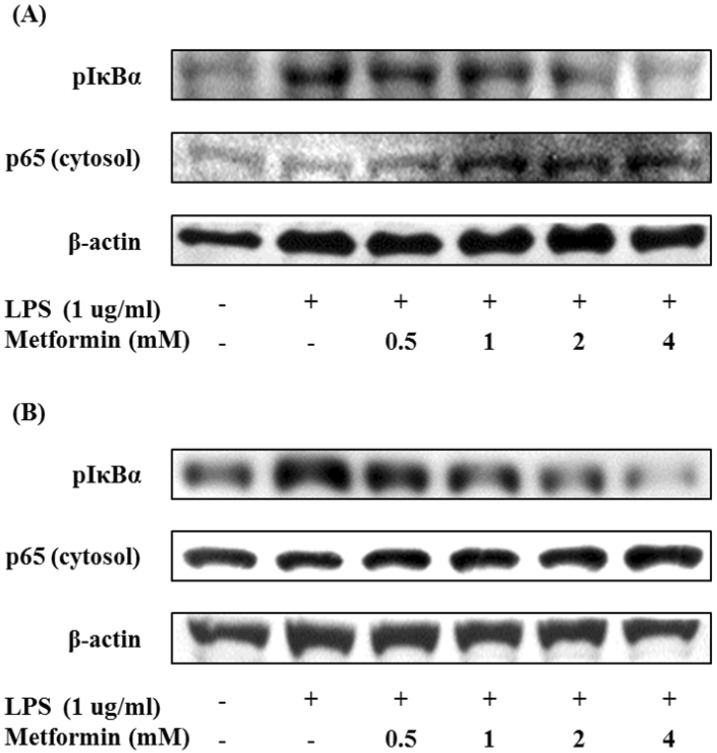
We also studied the effects of metformin on the activation of the nuclear factor kappa B (NF-κB) by Western blot analysis. Metformin suppressed phosphorylation of IκBα and translocation of cytosolic NF-κB p65 subunit in macrophages (Fig. 5). These results imply that metformin may attenuate LPS-induced NF-κB activation.
Figure 5.
Metformin inhibits translocation of NF-κB in macrophages. RAW 264.7 cells (A) and peritoneal macrophages (B) were cultured with different concentrations of metformin (0.5, 1, 2, and 4 mM) in the presence of LPS (1 µg/ml) for 24 hours. The protein expression of pIκBα and cytosol NF-κB p65 were analyzed by Western blotting.
Metformin reduces TNF-α secretion in vivo
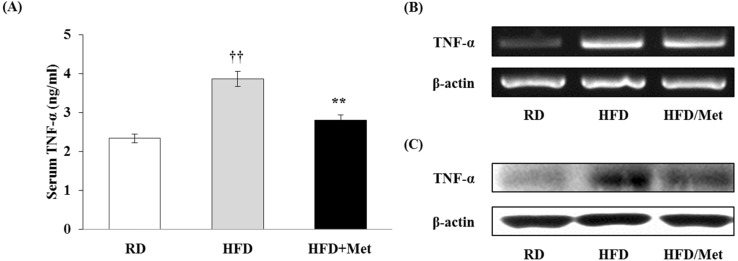
Metformin effectively attenuated the production of pro-inflammatory cytokines; especially TNF-α, in macrophages. Thus, we measured the serum TNF-α level by ELISA in blood samples taken from mice fed a regular diet (RD) and a high-fat diet (HFD) supplemented with metformin (HFD/Met). As shown in Fig. 6A, HFD was able to markedly induce TNF-α production compared to RD. Metformin significantly decreased production of TNF-α in HFD-fed mice. The protein and mRNA expressions of TNF-α in WAT isolated from the mice were analyzed by RT-PCR and Western blotting. These results mean that metformin may significantly down-regulated the levels of TNF-α mRNA and protein (Fig. 6B and C). These results show that metformin could reduce TNF-α production in obese mice as well as in macrophages.
Figure 6.
Metformin reduces TNF-α secretion in obese mice. Male C57BL/6N mice were fed with a regular diet (RD) or a high-fat diet (HFD) for 16 weeks to induce the DIO phenotype. HFD-fed mice were administered either saline or metformin (250 mg/kg; HFD/Met) for 8 weeks with free access to the high-fat diet. (A) After the end of the 8-week experimental period, blood samples were taken from RD, HFD, and HFD/Met-fed mice. SerumTNF-α levels were measured by ELISA. Data are expressed as mean±S.D. of the 3 independent experiments. ††p<0.01 compared with RD-fed mice. **p<0.01 compared with HFD-fed mice. (B and C) WAT was isolated from the mice. The mRNA expression of TNF-α was analyzed by RT-PCR, and the protein expression of TNF-α was analyzed by Western blotting.
Effects of metformin on the expression of scavenger receptors
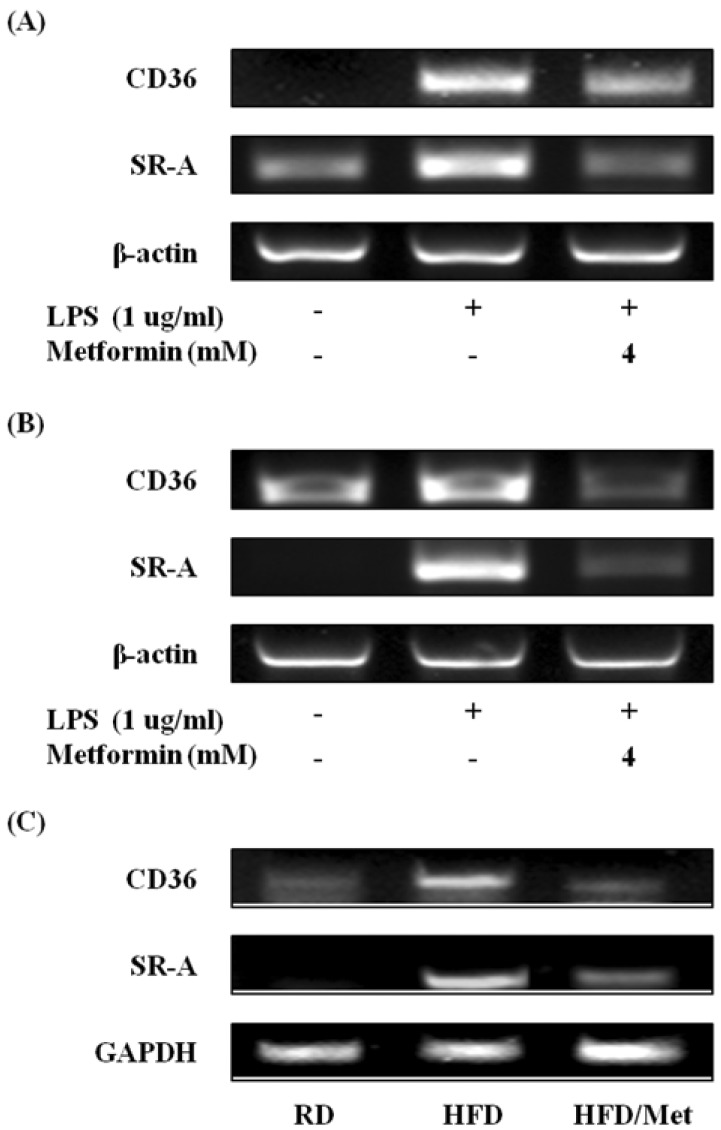
To find out the effects of metformin on the induction of scavenger receptors, the gene expression of scavenger receptors was detected by RT-PCR. The expressions of CD36 and SR-A was increased after exposure to LPS alone in RAW 264.7 cells (Fig. 7A), but metformin effectively decreased the expressions of CD36 and mRNA. Metformin also significantly suppressed CD36 and SR-A in peritoneal macrophages (Fig. 7B) and WAT from HFD-fed mice (Fig. 7C). These results indicate that metformin could inhibit the expression of scavenger receptors in macrophages and obese mice.
Figure 7.
Metformin attenuates the expression of scavenger receptors in macrophages and WAT from obese mice. RAW 264.7 cells (A) and peritoneal macrophages (B) were cultured with 4 mM metformin in the presence of LPS (1 µg/ml) for 24 hours. The mRNA expression of CD36 and SR-A were analyzed by RT-PCR. (C) Male C57BL/6N mice were fed on a regular diet (RD) or a high-fat diet (HFD) for 16 weeks to induce DIO phenotype. HFD-fed mice were administered either saline or metformin (250 mg/kg; HFD/Met) for 8 weeks with free access to the high-fat diet. After the end of the 8-week experimental period, WAT were isolated from RD, HFD, and HFD/Met-fed mice. The mRNA expressions of CD36 and SR-A were analyzed by RT-PCR.
DISCUSSION
Western diet-induced obesity triggers type 2 diabetes. It is well known that impaired insulin sensitivity induces type 2 diabetes (6). Many studies have reported that inflammatory responses in the obese subjects can induce insulin resistance, and that macrophages play an important role in this process (7-9). Macrophages infiltrated obese adipose tissue secrete pro-inflammatory cytokines rather than anti-inflammatory cytokines and induce infiltration and activation of other macrophages in blood. Accumulated macrophages cause unnecessary inflammation by pro-inflammatory response and trigger insulin resistance (12-15). In this study, we attempted to elucidate the mechanism by which metformin modulate inflammation in macrophages and a DIO mice.
NO and PGE2 are important inflammatory mediators (34,35). Because iNOS and COX-2 are expressed only after induction of infection and NO and PGE2 synthesis catalyzed by iNOS and COX-2 can be the hallmarks of inflammation (36-38). In this study, metformin dose-dependently reduced the production of NO and PGE2 and suppressed the mRNA and protein levels of iNOS and COX-2 in LPS-activated macrophages.
Cytokines are the modulatory protein or glycoprotein released by immune cells or other cells in response to various stimuli (39). Pro-inflammatory cytokines promote inflammation by activating macrophages and other immune cells, while anti-inflammatory cytokines inhibit excessive inflammation and maintain homeostasis. Immune balance is regulated by antagonism between pro-inflammatory and anti-inflammatory cytokines (40,41). However, the balance is broken due to increased pro-inflammatory cytokine production by macrophages in the obese subject (12-15). In this study, metformin reduced the production of pro-inflammatory cytokines (IL-1β, IL-6, and TNF-α) by inhibiting protein and mRNA expression in a dose-dependent manner. However, the protein expression of anti-inflammatory cytokines (IL-4 and IL-10) was up-regulated or maintained by metformin.
TNF-α exerts pleiotropic effects in the host; it stimulates immune cells and activates inflammatory responses to protect against infection whereas it mediates septic shock, rheumatoid arthritis and cancer (42-46). TNF-α is a very important cytokine that affects not only inflammation but also metabolic diseases (47). The TNF-α level is very high in the adipose tissues of obese rodents and humans (48,49), and increased TNF-α causes insulin resistance by inhibiting insulin signaling pathways, impairing expression of glucose transporter 4 and altering adipokine levels; down-regulates adiponectin whereas enhances leptin (50,51). TNF-α interferes with the lipid metabolism by increasing triglycerol and free-fatty acid concentrations in blood and altering composition of lipoprotein such as LDL and VLDL (51). Elevated TNF-α level is also associated with cardiovascular diseases like recurrent myocardial infarction and atherosclerosis (52). TNF-α-stimulated endothelial cells express chemokines and adhesion molecules (intercellular adhesion molecule 1 (ICAM-1), vascular cell adhesion molecule 1 (VCAM-1), E-selectin and P-selectin) to attract circulating monocytes (53). Monocyte-derived macrophages and vascular endothelial cells increase inflammatory responses in the atherosclerotic lesions by releasing chemoattractants and pro-inflammatory cytokines (52,54), and TNF-α induces cholesterol accumulation in macrophages by increasing expression of scavenger receptors (55). On the other hand, cholesterol efflux is decreased because TNF-α attenuates expression of ATP binding cassette transporter A1 (ABCA1), which leads to foam cell formation (54). Lipid-laden foam cells play a critical role in pathogenesis of atherosclerosis by accumulated in the intima (53,56). In particular, metformin significantly suppressed the production of TNF-α and attenuated gene and protein expression of TNF-α in macrophages and obese mice. This suggests that metformin inhibits inflammation in DIO mice and macrophages by attenuating TNF-α production.
The transcription factor NF-κB plays an important role in inflammatory responses. When inflammatory stimuli activate IκB kinase (IKK), IKK phosphorylates the α subunit of IκB, and the p65 subunit of NF-κB is activated by IκB degradation. NF-κB p65 subunit induces expression of pro-inflammatory cytokines through nuclear translocation (57). In our study, metformin exerted anti-inflammatory effects by concentration-dependently reducing the production of pro-inflammatory cytokines via suppression of IκBα phosphorylation and translocation of NF-κB p65 from cytosol to the nucleus.
Scavenger receptors constitute a large family with structurally diverse patterns of recognition receptors and they have been implicated in the development of atherosclerosis by contributing to macrophage foam cell formation through their interaction with oxLDL (17,18). The receptors are also implicated in inflammatory responses and the production of pro-inflammatory cytokines by the uptake of LPS and oxLDL (21,22). In our study, the gene expression of scavenger receptors, such as CD36 and SR-A, were effectively suppressed by metformin in macrophages and WAT.
In conclusion, metformin can modulate inflammatory responses in LPS-stimulated macrophages and in mice with high-fat diet induced type 2 diabetes through suppression of TNF-α production and impaired expression of scavenger receptors.
ACKNOWLEDGEMENTS
This paper was supported by the Sahmyook University Research fund.
Abbreviations
- LPS
lipopolysaccharides
- TNF-α
tumor necrosis factor-alpha
- IL
interleukin
Footnotes
The authors have no financial conflict of interest.
References
- 1.Flegal KM, Carroll MD, Ogden CL, Curtin LR. Prevalence and trends in obesity among US adults, 1999-2008. JAMA. 2010;303:235–241. doi: 10.1001/jama.2009.2014. [DOI] [PubMed] [Google Scholar]
- 2.Bae NK, Kwon IS, Cho YC. Ten year change of body mass index in Korean: 1997-2007. Korean J Obes. 2009;18:24–30. [Google Scholar]
- 3.Mokdad AH, Ford ES, Bowman BA, Dietz WH, Vinicor F, Bales VS, Marks JS. Prevalence of obesity, diabetes, and obesity-related health risk factors, 2001. JAMA. 2003;289:76–79. doi: 10.1001/jama.289.1.76. [DOI] [PubMed] [Google Scholar]
- 4.Grundy SM. Obesity, metabolic syndrome, and cardiovascular disease. J Clin Endocrinol Metab. 2004;89:2595–2600. doi: 10.1210/jc.2004-0372. [DOI] [PubMed] [Google Scholar]
- 5.Shaw JE, Sicree RA, Zimmet PZ. Global estimates of the prevalence of diabetes for 2010 and 2030. Diabetes Res Clin Pract. 2010;87:4–14. doi: 10.1016/j.diabres.2009.10.007. [DOI] [PubMed] [Google Scholar]
- 6.Alberti KG, Zimmet PZ. Definition, diagnosis and classification of diabetes mellitus and its complications. Part 1: diagnosis and classification of diabetes mellitus provisional report of a WHO consultation. Diabet Med. 1998;15:539–553. doi: 10.1002/(SICI)1096-9136(199807)15:7<539::AID-DIA668>3.0.CO;2-S. [DOI] [PubMed] [Google Scholar]
- 7.Shoelson SE, Herrero L, Naaz A. Obesity, inflammation, and insulin resistance. Gastroenterology. 2007;132:2169–2180. doi: 10.1053/j.gastro.2007.03.059. [DOI] [PubMed] [Google Scholar]
- 8.Qatanani M, Lazar MA. Mechanisms of obesity-associated insulin resistance: many choices on the menu. Genes Dev. 2007;21:1443–1455. doi: 10.1101/gad.1550907. [DOI] [PubMed] [Google Scholar]
- 9.McArdle MA, Finucane OM, Connaughton RM, McMorrow AM, Roche HM. Mechanisms of obesity-induced inflammation and insulin resistance: insights into the emerging role of nutritional strategies. Front Endocrinol (Lausanne) 2013;4:52. doi: 10.3389/fendo.2013.00052. [DOI] [PMC free article] [PubMed] [Google Scholar]
- 10.Olefsky JM, Glass CK. Macrophages, inflammation, and insulin resistance. Annu Rev Physiol. 2010;72:219–246. doi: 10.1146/annurev-physiol-021909-135846. [DOI] [PubMed] [Google Scholar]
- 11.Kim JY. Patho-/physiological roles of adipose tissue macrophages. BioWave. 2010;12:1–12. [Google Scholar]
- 12.Chawla A, Nguyen KD, Goh YP. Macrophage-mediated inflammation in metabolic disease. Nat Rev Immunol. 2011;11:738–749. doi: 10.1038/nri3071. [DOI] [PMC free article] [PubMed] [Google Scholar]
- 13.Osborn O, Olefsky JM. The cellular and signaling networks linking the immune system and metabolism in disease. Nat Med. 2012;18:363–374. doi: 10.1038/nm.2627. [DOI] [PubMed] [Google Scholar]
- 14.Lumeng CN, Bodzin JL, Saltiel AR. Obesity induces a phenotypic switch in adipose tissue macrophage polarization. J Clin Invest. 2007;117:175–184. doi: 10.1172/JCI29881. [DOI] [PMC free article] [PubMed] [Google Scholar]
- 15.Patel PS, Buras ED, Balasubramanyam A. The role of the immune system in obesity and insulin resistance. J Obes. 2013:616193. doi: 10.1155/2013/616193. [DOI] [PMC free article] [PubMed] [Google Scholar]
- 16.Goldstein JL, Ho YK, Basu SK, Brown MS. Binding site on macrophages that mediates uptake and degradation of acetylated low density lipoprotein, producing massive cholesterol deposition. Proc Natl Acad Sci U S A. 1979;76:333–337. doi: 10.1073/pnas.76.1.333. [DOI] [PMC free article] [PubMed] [Google Scholar]
- 17.Ley K, Miller YI, Hedrick CC. Monocyte and macrophage dynamics during atherogenesis. Arterioscler Thromb Vasc Biol. 2011;31:1506–1516. doi: 10.1161/ATVBAHA.110.221127. [DOI] [PMC free article] [PubMed] [Google Scholar]
- 18.Kzhyshkowska J, Neyen C, Gordon S. Role of macrophage scavenger receptors in atherosclerosis. Immunobiology. 2012;217:492–502. doi: 10.1016/j.imbio.2012.02.015. [DOI] [PubMed] [Google Scholar]
- 19.Baranova IN, Kurlander R, Bocharov AV, Vishnyakova TG, Chen Z, Remaley AT, Csako G, Patterson AP, Eggerman TL. Role of human CD36 in bacterial recognition, phagocytosis, and pathogen-induced JNK-mediated signaling. J Immunol. 2008;181:7147–7156. doi: 10.4049/jimmunol.181.10.7147. [DOI] [PMC free article] [PubMed] [Google Scholar]
- 20.Chen Y, Wermeling F, Sundqvist J, Jonsson AB, Tryggvason K, Pikkarainen T, Karlsson MC. A regulatory role for macrophage class A scavenger receptors in TLR4-mediated LPS responses. Eur J Immunol. 2010;40:1451–1460. doi: 10.1002/eji.200939891. [DOI] [PubMed] [Google Scholar]
- 21.Yu H, Ha T, Liu L, Wang X, Gao M, Kelley J, Kao R, Williams D, Li C. Scavenger receptor A (SR-A) is required for LPS-induced TLR4 mediated NF-κB activation in macrophages. Biochim Biophys Acta. 2012;1823:1192–1198. doi: 10.1016/j.bbamcr.2012.05.004. [DOI] [PMC free article] [PubMed] [Google Scholar]
- 22.Cai L, Wang Z, Ji A, Meyer JM, van der Westhuyzen DR. Scavenger receptor CD36 expression contributes to adipose tissue inflammation and cell death in diet-induced obesity. PLoS ONE. 2012;7:e36785. doi: 10.1371/journal.pone.0036785. [DOI] [PMC free article] [PubMed] [Google Scholar]
- 23.Bailey CJ, Turner RC. Metformin. N Engl J Med. 1996;334:574–579. doi: 10.1056/NEJM199602293340906. [DOI] [PubMed] [Google Scholar]
- 24.Hundal RS, Krssak M, Dufour S, Laurent D, Lebon V, Chandramouli V, Inzucchi SE, Schumann WC, Petersen KF, Landau BR, Shulman GI. Mechanism by which metformin reduces glucose production in type 2 diabetes. Diabetes. 2000;49:2063–2069. doi: 10.2337/diabetes.49.12.2063. [DOI] [PMC free article] [PubMed] [Google Scholar]
- 25.Hundal RS, Inzucchi SE. Metformin: new understandings, new uses. Drugs. 2003;63:1879–1894. doi: 10.2165/00003495-200363180-00001. [DOI] [PubMed] [Google Scholar]
- 26.Correia S, Carvalho C, Santos MS, Seiça R, Oliveira CR, Moreira PI. Mechanisms of action of metformin in type 2 diabetes and associated complications: an overview. Mini Rev Med Chem. 2008;8:1343–1354. doi: 10.2174/138955708786369546. [DOI] [PubMed] [Google Scholar]
- 27.Zhou G, Myers R, Li Y, Chen Y, Shen X, Fenyk-Melody J, Wu M, Ventre J, Doebber T, Fujii N, Musi N, Hirshman MF, Goodyear LJ, Moller DE. Role of AMP-activated protein kinase in mechanism of metformin action. J Clin Invest. 2001;108:1167–1174. doi: 10.1172/JCI13505. [DOI] [PMC free article] [PubMed] [Google Scholar]
- 28.Musi N, Hirshman MF, Nygren J, Svanfeldt M, Bavenholm P, Rooyackers O, Zhou G, Williamson JM, Ljunqvist O, Efendic S, Moller DE, Thorell A, Goodyear LJ. Metformin increases AMP-activated protein kinase activity in skeletal muscle of subjects with type 2 diabetes. Diabetes. 2002;51:2074–2081. doi: 10.2337/diabetes.51.7.2074. [DOI] [PubMed] [Google Scholar]
- 29.Lee SK, Lee JO, Kim JH, Kim SJ, You GY, Moon JW, Jung JH, Park SH, Uhm KO, Park JM, Suh PG, Kim HS. Metformin sensitizes insulin signaling through AMPK-mediated PTEN down-regulation in preadipocyte 3T3-L1 cells. J Cell Biochem. 2011;112:1259–1267. doi: 10.1002/jcb.23000. [DOI] [PubMed] [Google Scholar]
- 30.Nath N, Khan M, Paintlia MK, Singh I, Hoda MN, Giri S. Metformin attenuated the autoimmune disease of the central nervous system in animal models of multiple sclerosis. J Immunol. 2009;182:8005–8014. doi: 10.4049/jimmunol.0803563. [DOI] [PMC free article] [PubMed] [Google Scholar]
- 31.Tsoyi K, Jang HJ, Nizamutdinova IT, Kim YM, Lee YS, Kim HJ, Seo HG, Lee JH, Chang KC. Metformin inhibits HMGB1 release in LPS-treated RAW 264.7 cells and increases survival rate of endotoxaemic mice. Br J Pharmacol. 2011;162:1498–1508. doi: 10.1111/j.1476-5381.2010.01126.x. [DOI] [PMC free article] [PubMed] [Google Scholar]
- 32.Kalariya NM, Shoeb M, Ansari NH, Srivastava SK, Ramana KV. Antidiabetic drug metformin suppresses endotoxin-induced uveitis in rats. Invest Ophthalmol Vis Sci. 2012;53:3431–3440. doi: 10.1167/iovs.12-9432. [DOI] [PMC free article] [PubMed] [Google Scholar]
- 33.Yuan H, Li L, Zheng W, Wan J, Ge P, Li H, Zhang L. Antidiabetic drug metformin alleviates endotoxin-induced fulminant liver injury in mice. Int Immunopharmacol. 2012;12:682–688. doi: 10.1016/j.intimp.2012.01.015. [DOI] [PubMed] [Google Scholar]
- 34.Kim HK, Lee IK. Endoplasmic reticulum (ER) stress and vascular complication. J Korean Diabetes Assoc. 2006;30:145–150. [Google Scholar]
- 35.Serhan CN, Levy B. Success of prostaglandin E2 in structure-function is a challenge for structure-based therapeutics. Proc Natl Acad Sci U S A. 2003;100:8609–8611. doi: 10.1073/pnas.1733589100. [DOI] [PMC free article] [PubMed] [Google Scholar]
- 36.Nathan C. Inducible nitric oxide synthase: what difference does it make? J Clin Invest. 1997;100:2417–2423. doi: 10.1172/JCI119782. [DOI] [PMC free article] [PubMed] [Google Scholar]
- 37.Sun L, Liu J, Cui D, Li J, Yu Y, Ma L, Hu L. Anti-inflammatory function of Withangulatin A by targeted inhibiting COX-2 expression via MAPK and NF-kappaB pathways. J Cell Biochem. 2010;109:532–541. doi: 10.1002/jcb.22430. [DOI] [PubMed] [Google Scholar]
- 38.Vila-del Sol V, Fresno M. Involvement of TNF and NF-kappa B in the transcriptional control of cyclooxygenase-2 expression by IFN-gamma in macrophages. J Immunol. 2005;174:2825–2833. doi: 10.4049/jimmunol.174.5.2825. [DOI] [PubMed] [Google Scholar]
- 39.Dinarello CA. Proinflammatory cytokines. Chest. 2000;118:503–508. doi: 10.1378/chest.118.2.503. [DOI] [PubMed] [Google Scholar]
- 40.Chi H, Barry SP, Roth RJ, Wu JJ, Jones EA, Bennett AM, Flavell RA. Dynamic regulation of pro- and anti-inflammatory cytokines by MAPK phosphatase 1 (MKP-1) in innate immune responses. Proc Natl Acad Sci U S A. 2006;103:2274–2279. doi: 10.1073/pnas.0510965103. [DOI] [PMC free article] [PubMed] [Google Scholar]
- 41.Opal SM, DePalo VA. Anti-inflammatory cytokines. Chest. 2000;117:1162–1172. doi: 10.1378/chest.117.4.1162. [DOI] [PubMed] [Google Scholar]
- 42.Ma X. TNF-alpha and IL-12: a balancing act in macrophage functioning. Microbes Infect. 2001;3:121–129. doi: 10.1016/s1286-4579(00)01359-9. [DOI] [PubMed] [Google Scholar]
- 43.Locksley RM, Killeen N, Lenardo MJ. The TNF and TNF receptor superfamilies: integrating mammalian biology. Cell. 2001;104:487–501. doi: 10.1016/s0092-8674(01)00237-9. [DOI] [PubMed] [Google Scholar]
- 44.Maini RN, Taylor PC. Anti-cytokine therapy for rheumatoid arthritis. Annu Rev Med. 2000;51:207–229. doi: 10.1146/annurev.med.51.1.207. [DOI] [PubMed] [Google Scholar]
- 45.Aggarwal BB. Signalling pathways of the TNF superfamily: a double-edged sword. Nat Rev Immunol. 2003;3:745–756. doi: 10.1038/nri1184. [DOI] [PubMed] [Google Scholar]
- 46.Charles KA, Kulbe H, Soper R, Escorcio-Correia M, Lawrence T, Schultheis A, Chakravarty P, Thompson RG, Kollias G, Smyth JF, Balkwill FR, Hagemann T. The tumor-promoting actions of TNF-alpha involve TNFR1 and IL-17 in ovarian cancer in mice and humans. J Clin Invest. 2009;119:3011–3023. doi: 10.1172/JCI39065. [DOI] [PMC free article] [PubMed] [Google Scholar]
- 47.Ji ZZ, Dai Z, Xu YC. A new tumor necrosis factor (TNF)-α regulator, lipopolysaccharides-induced TNF-α factor, is associated with obesity and insulin resistance. Chin Med J (Engl) 2011;124:177–182. [PubMed] [Google Scholar]
- 48.Hotamisligil GS, Murray DL, Choy LN, Spiegelman BM. Tumor necrosis factor alpha inhibits signaling from the insulin receptor. Proc Natl Acad Sci U S A. 1994;91:4854–4858. doi: 10.1073/pnas.91.11.4854. [DOI] [PMC free article] [PubMed] [Google Scholar]
- 49.Ziccardi P, Nappo F, Giugliano G, Esposito K, Marfella R, Cioffi M, D'Andrea F, Molinari AM, Giugliano D. Reduction of inflammatory cytokine concentrations and improvement of endothelial functions in obese women after weight loss over one year. Circulation. 2002;105:804–809. doi: 10.1161/hc0702.104279. [DOI] [PubMed] [Google Scholar]
- 50.Simons PJ, van den Pangaart PS, Aerts JM, Boon L. Pro-inflammatory delipidizing cytokines reduce adiponectin secretion from human adipocytes without affecting adiponectin oligomerization. J Endocrinol. 2007;192:289–299. doi: 10.1677/JOE-06-0047. [DOI] [PubMed] [Google Scholar]
- 51.Popa C, Netea MG, van Riel PL, van der Meer JW, Stalenhoef AF. The role of TNF-alpha in chronic inflammatory conditions, intermediary metabolism, and cardiovascular risk. J Lipid Res. 2007;48:751–762. doi: 10.1194/jlr.R600021-JLR200. [DOI] [PubMed] [Google Scholar]
- 52.Kleemann R, Zadelaar S, Kooistra T. Cytokines and atherosclerosis: a comprehensive review of studies in mice. Cardiovasc Res. 2008;79:360–376. doi: 10.1093/cvr/cvn120. [DOI] [PMC free article] [PubMed] [Google Scholar]
- 53.Skoog T, Dichtl W, Boquist S, Skoglund-Andersson C, Karpe F, Tang R, Bond MG, de Faire U, Nilsson J, Eriksson P, Hamsten A. Plasma tumour necrosis factor-alpha and early carotid atherosclerosis in healthy middle-aged men. Eur Heart J. 2002;23:376–383. doi: 10.1053/euhj.2001.2805. [DOI] [PubMed] [Google Scholar]
- 54.Mei CL, Chen ZJ, Liao YH, Wang YF, Peng HY, Chen Y. Interleukin-10 inhibits the down-regulation of ATP binding cassette transporter A1 by tumour necrosis factor-alpha in THP-1 macrophage-derived foam cells. Cell Biol Int. 2007;31:1456–1461. doi: 10.1016/j.cellbi.2007.06.009. [DOI] [PubMed] [Google Scholar]
- 55.Hashizume M, Mihara M. Atherogenic effects of TNF-α and IL-6 via up-regulation of scavenger receptors. Cytokine. 2012;58:424–430. doi: 10.1016/j.cyto.2012.02.010. [DOI] [PubMed] [Google Scholar]
- 56.Spagnoli LG, Bonanno E, Sangiorgi G, Mauriello A. Role of inflammation in atherosclerosis. J Nucl Med. 2007;48:1800–1815. doi: 10.2967/jnumed.107.038661. [DOI] [PubMed] [Google Scholar]
- 57.Tak PP, Firestein GS. NF-kappaB: a key role in inflammatory diseases. J Clin Invest. 2001;107:7–11. doi: 10.1172/JCI11830. [DOI] [PMC free article] [PubMed] [Google Scholar]


