

Abstract
In ophthalmology, detecting the biomechanical properties of the cornea can provide valuable information about various corneal pathologies, including keratoconus and the phototoxic effects of ultraviolet radiation on the cornea. Also, the mechanical properties of the cornea can be used to evaluate the recovery from corneal refractive surgeries. Therefore, noninvasive and high-resolution estimation of the stiffness distribution in the cornea is important in ophthalmic diagnosis. The present study established a method for high-resolution acoustic-radiation-force-impulse (ARFI) imaging based on a dual-frequency confocal transducer in order to obtain a relative stiffness map, which was used to assess corneal sclerosis. An 11-MHz pushing element was used to induce localized displacements of tissue, which were monitored by a 48-MHz imaging element. Since the tissue displacements are directly correlated with the tissue elastic properties, the stiffness distribution in a tiny region of the cornea can be found by a mechanical B/D scan. The experimental system was verified using tissue-mimicking phantoms that included different geometric structures. Ex vivo cornea experiments were carried out using fresh porcine eyeballs. Corneas with localized sclerosis were created artificially by the injection of a formalin solution. The phantom experiments showed that the distributions of stiffness within different phantoms can be recognized clearly using ARFI imaging, and the measured lateral and axial resolutions of this imaging system were 177 and 153 μm, respectively. The ex vivo experimental results from ARFI imaging showed that a tiny region of localized sclerosis in the cornea could be distinguished. All of the obtained results demonstrate that high-resolution ARFI imaging has considerable potential for the clinical diagnosis of corneal sclerosis.
Index Terms: Acoustic-radiation-force-impulse (ARFI), imaging, cornea, elastic properties, elastography, high-frequency ultrasound
I. Introduction
The cornea is the principal refracting component of the eye, and the maintenance of its transparency in the visible spectrum is crucial to normal vision. Because the lamellar structure of the cornea exhibits a high elasticity, its physical shape can be easily varied in order to change its refraction properties [1]. Disorders of the biomechanical properties of the cornea may change its transparency to light and thereby adversely influence vision. Many ophthalmic pathologies affect corneal elastic properties, such as keratoconus [2] and the phototoxic effects of ultraviolet radiation [3], [4]. In addition, the elastic properties of the cornea are changed after most types of refractive surgery. For instance, laser-assisted in situ keratomileusis (LASIK) is currently considered a successful and popular method of refractive surgery due to less pain on the corneal surface and the short recovery time [5]. Although complications are very rare, dramatic cases of ectasia and keratitis may occur in refractive surgery [6], [7]. In LASIK, a flap of anterior corneal tissue is cut by laser for ablating the stroma, after which the corneal shape relaxes to a new equilibrium state that is affected by the corneal elasticity [8], [9]. Therefore, measuring the stiffness distribution in the cornea is important for estimating the risk factors before and for evaluating the recovery after corneal refractive surgery. In ophthalmology, tonometry is normally used to evaluate the corneal stiffness by estimating the intraocular pressure (IOP), especially for understanding the recovery situation after LASIK surgery. An ocular response analyzer (ORA) based on the IOP has been developed to measure the mechanical properties of the cornea in vivo [10]. The principle of the ORA is based on measuring two applanation pressures induced by a transient puff of air onto the surface of the cornea. Currently it is the only available method for evaluating the mechanical properties of the cornea, but it may be inaccurate since the IOP is affected by various factors such as the corneal thickness and the curvature of the pathological cornea [11]. Furthermore, the ORA cannot provide the distributions of corneal stiffness in a small region, particularly during the early stages of corneal sclerosis. These drawbacks may be overcome by using ultrasound modalities. For instance, the stiffness of eye tissue can be evaluated indirectly by measuring ultrasonic attenuation [12], [13], velocity [14], and backscattering statistical parameters [15]. Nevertheless, a method for directly measuring the stiffness distribution of eye tissues is still needed.
In the past two decades, ultrasound techniques have been widely proposed for assessing the mechanical properties of soft tissues. In 1991, Ophir et al. developed an imaging technology called elastography to measure the elastic properties of soft tissue based on applying an external force to the tissue and measuring its deformation at different depths. This method can be used to reconstruct the stiffness distributions within the tissue according to its internal strain profile along the transducer axis [16]. However, the usefulness of a compressional elastography examination is highly dependent on operator skill, particularly for deeper organs. An acoustic-radiation-force technique based on “remote palpation” has recently been developed for assessing the elastic properties of tissues [17]. This technique creates an acoustic radiation force by the absorption of an applied ultrasound wave by soft tissue, and it induces localized tissue vibrations, with the dynamic tissue responses being directly correlated with the localized variations of tissue elastic properties [17]-[19]. Several imaging modalities have been developed based on acoustic radiation forces to detect the elastic properties of tissues, such as vibroacoustic imaging [20], shear-wave elasticity imaging [21], harmonic motion imaging [22]-[24], and acoustic-radiation-force-impulse (ARFI) imaging [25]. However, few studies have used ultrasound to assess the elastic properties of the cornea due to the need for a high image resolution. High-frequency ultrasound exhibits a good sensitivity and resolution for detecting the microstructure of tissues [26], [27], and high-frequency ultrasound biomicroscopy (>30 MHz) has been developed for imaging superficial tissues [28]. Hollman et al. used 50-MHz compressional elastography to detect the strain distribution of the normal porcine cornea [8]. The stiffness of the normal cornea was found to be uniform, reflecting its homogeneous mechanical properties. However, the possibility of direct compressional elastography causing slight damage to the cornea means that it is not viewed favorably by patients, which prompted the concept of “remote palpation” for assessing the elastic properties of the cornea. A novel method called supersonic shear imaging (SSI) used a 15-MHz array transducer to measure the quantitative shear modulus of the porcine cornea [9], but the relatively low frequency limited the spatial resolution of the obtained images. Moreover, no study has assessed the feasibility of using the system to differentiate the localized stiffness distribution between the normal and sclerosis cornea, and SSI requires super-fast imaging that is not compatible with current commercial high-frequency ultrasound scanners.
ARFI imaging has been used widely to assess the elastic properties of several types of soft tissue, such as a breast tumor, hepatic fibrosis, and vascular thrombosis [29]-[31]. The lesion locations of ovine cardiac tissue [32] and carotid and popliteal arteries [33] have also been detected by ARFI imaging using a modified commercial scanner. ARFI imaging involves applying a short-duration impulsive acoustic radiation force to the tissue, and the resulting tissue displacement can be directly related to the mechanical properties of tissue, including the stiffness distribution [17]. Most of the above-mentioned studies used an ultrasound probe for both generating the radiation force and detecting the tissue displacement at a central frequency of around 7.5 MHz. Such an operating frequency is suitable for detecting the elastic properties of deeper organs, but its spatial resolution is insufficient for imaging the cornea. The typical ultrasound frequency range of 40–60 MHz is adequate for ophthalmology applications, particularly for cornea imaging [34], and hence the ultrasound operating frequency needs to be increased to provide ARFI images with resolution sufficient for revealing the stiffness distribution in the sclerosis cornea.
The purpose of this study was to develop a high-resolution ARFI imaging method for detecting localized stiffness changes in the cornea. A dual-frequency confocal ultrasound transducer with both 11- and 48-MHz elements was designed in this study: the 11-MHz element was used to generate the acoustic radiation force that would induce tissue displacements, while the 48-MHz element was used to detect these displacements in order to reconstruct high-resolution images. The system was verified using tissue-mimicking gelatin-based phantoms of different types. Corneal experiments were carried out using fresh porcine eyeballs ex vivo and corneas with localized sclerosis that was induced artificially. The experimental results showed the feasibility of using high-resolution ARFI imaging for clinical diagnosis.
II. Materials and Methods
A. Confocal Transducer
A dual-frequency confocal transducer with two elements was fabricated in this study (NIH Ultrasonic Transducer Resource Center, University of Southern California, Los Angeles, CA, USA), as shown in Fig. 1. Both elements had a focal depth of 7.2 mm. The 11-MHz outer element (pushing element) was designed to be hollow to allow the placement of the 48-MHz inner element (imaging element). Two connectors were designed individually to reduce the interference between the two frequencies. The 11-MHz element was used to generate the acoustic radiation force to induce localized tissue displacement, and this displacement was detected by the 48-MHz element to reconstruct the ARFI image. The characteristics of the dual-frequency confocal transducer are listed in Table I. The acoustic pressure levels of the 11-MHz element were measured using a calibrated hydrophone (HNP-0200, Onda, Sunnyvale, CA, USA). The measured ISPTA was 14.8 mW/cm2 when the element was excited by a sinusoidal tone burst with a peak-to-peak amplitude of 80 V (corresponding to the maximum setting power in this study) and a duration of 1 ms. The measured waveform of 11 MHz element from the hydrophone was plotted in Fig. 2.
Fig. 1.
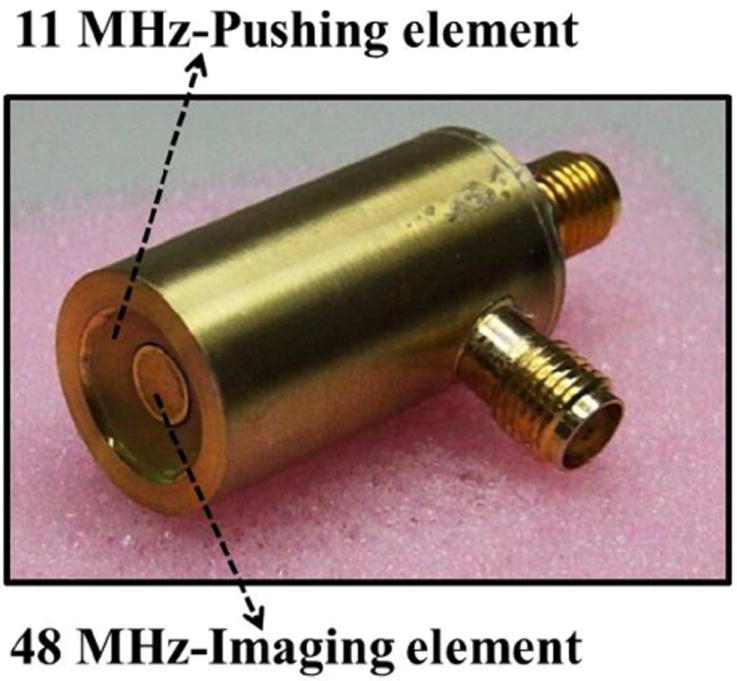
Photograph of the dual-frequency confocal transducer.
TABLE I.
Parameters of the High-Frequency Dual-Frequency Confocal Transducer
| Pushing element | Imaging element | |
|---|---|---|
| Material | PT (lead titanate) | lithium niobate |
| Central frequency | 11 MHz | 48 MHz |
| Focal length | 7.21 mm | 7.19 mm |
| f number | 0.8 | 1.6 |
Fig. 2.

Measured waveform of 11 MHz element from a hydrophone at the focal depth of 7.2 mm.
B. Experimental Setup for High-Resolution ARFI Imaging
The experimental system is shown in Fig. 3. The 11-MHz element of the dual-frequency confocal transducer was excited by a function generator (AFG3252, Tektronix, Beaverton, OR, USA) connected to an RF power amplifier (25A250, Amplifier Research, Souderton, PA, USA). Sinusoidal 11-MHz tone bursts with durations from 0.2 to 1 ms were provided by the function generator. The peak-to-peak amplitude of the output burst was amplified to between 50 and 80 V by the power amplifier. A pulser-receiver (5900PR, Panametrics, Waltham, MA, USA) with a 200-MHz bandwidth was used to drive the 48-MHz element of the dual-frequency confocal transducer for transmitting and receiving ultrasound signals with a pulse repetition frequency (PRF) of 10 kHz. The ultrasonic signals backscattered from the tissue were amplified and filtered using a built-in variable-gain amplifier and band-pass filter, respectively. The pulser-receiver was triggered by the function generator. The PRF trigger of the function generator was also used to synchronize the acquisition of the backscattered signals at a maximum sampling frequency of 2 GHz by an 8-bit analog-to-digital converter (ADC) (PXI-5152, National Instruments, Austin, TX, USA). The pulser-receiver, function generator, and ADC were all synchronized using an internal trigger from the function generator while the imaging and pushing elements were operated continuously.
Fig. 3.

Block diagram of the experimental system.
A representative timing diagram for the two transducer elements is shown in Fig. 4. The acoustic radiation force was applied by the pushing element at 0.1 ms after the imaging element started to receive the signals backscattered from the tissue. The backscatter signal before tissue motion was recorded in order to compute the initial position of the tissue. In total, 100 A-lines were recorded for monitoring the tissue motions. The tissue displacement at each detectable position as a function of time was measured using a cross-correlation tracking algorithm [35]. To obtain a 2-D high-resolution ARFI image, the dual-frequency confocal transducer was attached on the motor platform for mechanical scanning under multiple axial depths (B/D scan) [36], as shown in Fig. 5. This scanning ensured that all detectable positions within the tissue were excited and detected in the focal zone of the transducer. The lateral step size of each B-scan was 40 μm. At each scanning position, the length of recorded backscatter signal was 0.38 mm, and the scanned area was divided into five windows. Since a 50% overlap between successive windows was used to calculate the tissue displacements, the transducer was moved down by 0.19 mm to perform a deeper B-scan after a former B-scan was completed at a fixed depth. Finally, the displacements measured at different positions were used to reconstruct the high-resolution ARFI image. The displacement was presented zero as the backscattering signals in the correlation window are smaller than a threshold. Data analyses were performed on a personal computer using MATLAB (The MathWorks, Natick, MA, USA).
Fig. 4.

Representative timing diagram for the experiments. Pushing pulses fired by the 11-MHz element were synchronized (with a 0.1-ms delay) with the initial imaging pulses of the 48-MHz element.
Fig. 5.
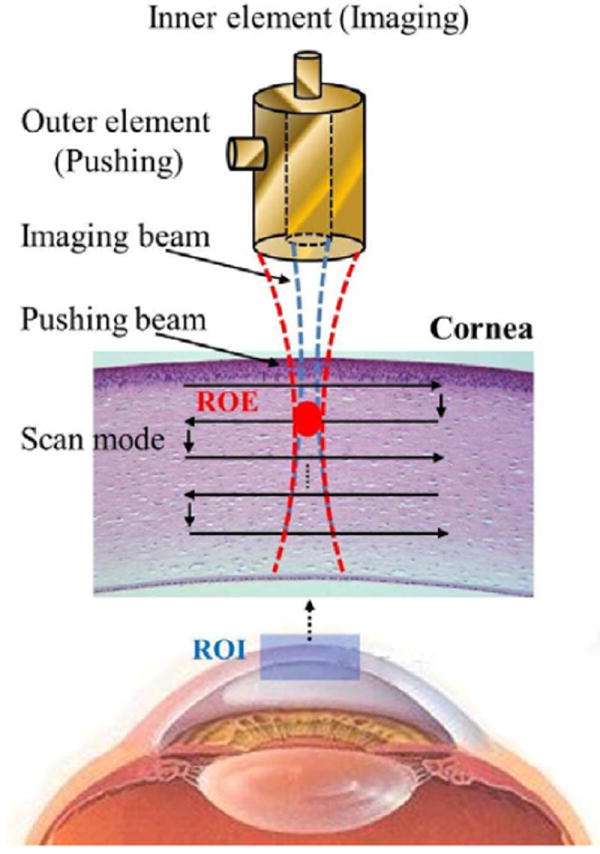
Scanning scheme of the high-resolution ARFI imaging system. Both the pushing and imaging elements were focused at the same zone [region of excitation (ROE)]. The distributions of stiffness within a region of interest (ROI) for the cornea or phantom were mapped by the B/D scan.
C. Gelatin-Phantom Experiments
The system was verified by constructing tissue-mimicking phantoms with different gelatin concentrations (type A, Sigma-Aldrich, St. Louis, MO, USA) to simulate soft tissues of various stiffnesses. The same concentration of graphite powder (Sigma-Aldrich) was added to all gelatin phantoms as particles. Three types of phantom comprising gelatin at concentrations of 2%, 5%, and 6% were used in this study. Diagrams of the gelatin phantoms are shown in Fig. 6. Phantom type 1 consisted of gelatin at concentrations on the left and right sides of 6% and 2%, respectively [Fig. 6(a)]; phantom type 2 consisted of gelatin at concentrations on the top and below sides of 2% and 6%, respectively [Fig. 6(b)]; and phantom type 3 was manufactured by embedding a 5%-gelatin inclusion into a 2%-gelatin background [Fig. 6(c)]. The shape of the inclusion was an ellipse for phantom type 3 and the long and short axes were 1.8 and 1.4 mm, respectively. Because the stiffness of gelatin phantoms can be affected by the temperature, all of the experiments were performed at a room temperature of 25 °C [19].
Fig. 6.

Sketches of the three types of gelatin phantoms: the two-sides (right-left) phantom (type 1) (a), the two-layers (top-below) phantom (type 2) (b), and the inclusion phantom (type 3) (c).
D. Cornea Samples
The cornea experiments were performed on porcine corneas. Fresh porcine eyeballs were collected from a local slaughterhouse, with all experiments being performed within 12 h of their collection. For scanning the cornea, the eyeball was immersed with saline solution (sodium chloride, Sigma-Aldrich) and fixed by a hollow sponge attached to the tank at a room temperature of 25 °C. The intra-ocular pressure of the ex vivo eyes was at atmospheric pressure. The cornea experiments involved scanning both healthy corneas and corneas with artificially induced sclerosis. In order to create a localized region in the cornea with sclerosis, the healthy cornea was injected with 0.05 cc of formalin solution [formaldehyde solution 10% (w/v), Mallinckrodt Chemicals, St. Louis, MO, USA] via a 1-cc disposable syringe with a 30-gauge needle. Fig. 7 shows the cornea with localized sclerosis obtained after 30 min.
Fig. 7.

Photograph of a cornea with artificially induced sclerosis.
III. Results and Discussion
The excitation parameters of the pushing element need to be determined before forming a high-resolution ARFI image. Fig. 8 shows the particle displacements within the focal zone of the pushing element in a homogeneous 2%-gelatin phantom. The excitation voltage applied to the pushing element was varied from 50 to 80 V while the duration was kept fixed at 1.0 ms; this induced maximum displacements from 1.5 to 4.0 μm, as shown in Fig. 8(a). Although the maximum displacement increased with the excitation amplitude, the times at which the peak occurred were almost identical in all cases. Similar results were observed in our previous embedded-sphere-based acoustic-radiation-force study [31], where the time at which the displacement peaked appeared to be independent of the magnitude of a fixed-duration force.
Fig. 8.

Measured dynamic displacement curves from a 2%-gelatin phantom for excitation voltages from 50 to 80 V at a fixed excitation duration of 1 ms (a), and from the same phantom for excitation durations from 0.2 to 1 ms at a fixed excitation voltage of 80 V (b). Measured dynamic displacement curves from 2%- and 6%-gelatin phantoms using a 1-ms excitation duration at 80 V (c).
In a second series of experiments the excitation duration of the radiation force was varied from 0.2 to 1.0 ms at a fixed excitation amplitude of 80 V. Both the maximum displacement and the time to reach it increased with the excitation duration, as shown in Fig. 8(b). This phenomenon has also previously been found for spheres embedded in blood clots [31]. Fig. 8(c) shows the displacement curves for a radiation force with an excitation amplitude of 80 V and a duration of 1 ms for homogeneous 2%- and 6%-gelatin phantoms. The maximum displacement was lower for a higher tissue stiffness, but the displacement peaked at the same time in the phantoms with two gelatin concentrations. It has been reported previously that both the maximum displacement and the time of its occurrence can be used for ARFI imaging [21], [25], but the experimental results obtained using the present system seem to imply that the maximum displacement is more suitable. Since larger displacements were easy to detect and analyze, the excitation parameters were set as 80 V and 1 ms for the subsequent experiments of high-resolution ARFI imaging.
Fig. 9 shows the B-mode images and their corresponding high-resolution ARFI images for the multilayer phantoms (types 1 and 2). The stiffness and the boundary between the two gelatin concentrations (2% and 6% on the left and right sides, respectively) cannot be recognized in the B-mode image in Fig. 9(a), with both sides exhibiting a homogeneous speckle pattern. However, the difference in the stiffness between the two sides is apparently in the ARFI image in Fig. 9(b). The blue color in the figure (for 6% gelatin) indicates a greater stiffness than the red color (for 2% gelatin), with the relative stiffness depending on the measured maximum displacement. The images correspond to an area of 1.5 × 1.5 mm. The experimentally obtained B-mode and ARFI images for phantom type 2 are shown in Fig. 9(e) and (f), respectively. The differences between the stiffnesses in the entire phantom are unclear in the B-mode image, but the regions containing different gelatin concentrations can be clearly distinguished in the ARFI image. Bright speckles in the B-mode image appeared at the boundaries due to the graphite powder settling down while the gelatin was liquid, particularly for the lower concentration gelatin. The quantitative horizontal displacement profiles across the type-1 phantom at depths of 0, 0.6, 0.9, and 1.2 mm are plotted in Fig. 9(c). The curves indicate that the horizontal distributions of tissue displacement were similar at all depths. In addition, the displacement increased between widths of 0.7 and 0.8 mm, which corresponds to the boundary between 2% and 6% gelatin. The maximum displacements on the left and right sides from the junction were approximately 0.5 and 2.2 μm, respectively. As expected, the stiffness distributions within the individual regions comprising 2% and 6% gelatin were uniform. The quantitative vertical displacement profiles across the type-2 phantom at widths of 0, 0.5, 1.0, and 1.5 mm are plotted in Fig. 9(g). Again, the stiffness distributions within the individual regions comprising 2% and 6% gelatin were uniform. In order to evaluate the actual resolutions of ARFI imaging, phantoms type 1 and 2 were used for estimating the lateral and axial resolution of image, respectively. The spatial resolution was estimated by fitting the measured displacement profile (D(x) across two layers (phantoms type 1 and 2) using a function expressed as the product of sigmoid function to model the soft-hard displacement profile [37]
| (1) |
where x is the lateral or axial position, d1 and d2 are the measured displacements in different layers, respectively, x1 is the location of the layer boundary, and λ represents the width of the transition from one layer into another layer. Given a displacement profile, the four parameters d1, d2, x1 and λ can be obtained using standard nonlinear least squares fitting procedures. The resolution R2080 of ARFI image which defined as the distance between the 20% and 80% transition of displacement profile was then estimated quantitatively using [37]
| (2) |
where N is the total displacement profiles across two layers in phantoms type 1 (N is 20 for horizontal direction) or type 2 (N is 38 for vertical direction), λi is the width for ith transition of displacement profile which was evaluated from (1). The average displacement profile of horizontal direction and its fitting curve as well as the vertical direction are shown in Fig. 9(d) and (h), respectively. The measured lateral and axial resolutions of ARFI imaging were 177 and 153 μm, respectively.
Fig. 9.

B-mode image (a), high-resolution AFRI image (b), quantitative horizontal displacement profiles across the phantom at depths of 0, 0.6, 0.9, and 1.2 mm (c), mean horizontal displacement profile and its fitting curve (d) for the type-1 phantom. B-mode image (e), high-resolution AFRI image (f), quantitative vertical displacement profiles across the phantom at widths of 0, 0.5, 1.0, and 1.5 mm (g), mean vertical displacement profile and its fitting curve (h) for the type-2 phantom.
Fig. 10 shows the B-mode image and its corresponding high-resolution ARFI image for the inclusion phantom (type 3). Both the location and stiffness of the inclusion are clearly evident in the high-resolution ARFI image in Fig. 10(b), in which the stiffer inclusion (5% gelatin) and the softer background (2% gelatin) are indicated by the blue and red regions, respectively. In contrast, it is not possible to distinguish either the location or stiffness of the inclusion region in the B-mode image shown in Fig. 10(a). The experimental results from phantoms verified that the stiffness variations within microstructure tissues can be detected by the high-resolution ARFI imaging system. The horizontal and vertical displacement profiles across the short and long axis were fitted respectively by sigmoid functions, as shown in Fig. 10(c) and (d), respectively. The dimensions of short and long axis were found by measuring the distance between two steeps (the half between the highest and lowest). The measured long and short axes of inclusion were approximately 2.0 and 1.7 mm, respectively.
Fig. 10.
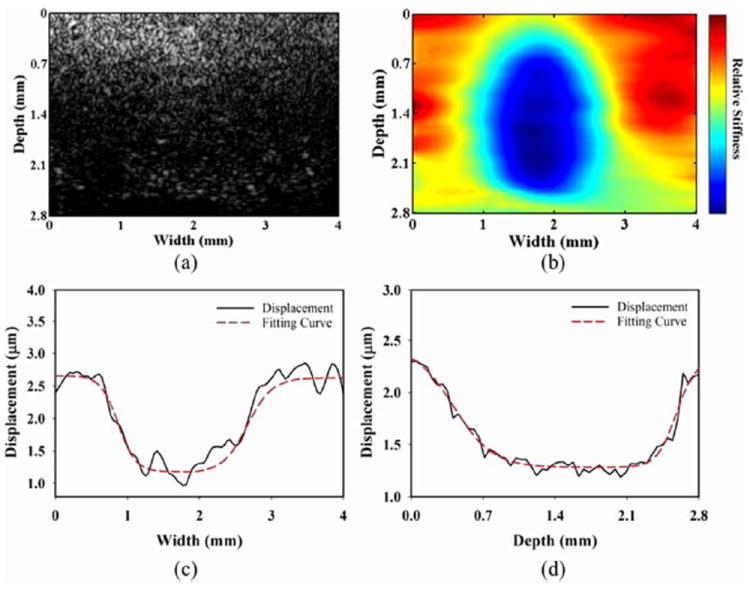
B-mode image (a), high-resolution ARFI image (b), quantitative horizontal displacement profile and its fitting curve across the phantom at a depth of 1.5 mm (c), quantitative vertical displacement profile and its fitting curve across the phantom at a width of 1.8 mm (d) for the type-3 phantom.
B-mode and ARFI images obtained for three healthy porcine corneas are shown in Fig. 11; these were obtained from 1.5 × 4.0- and 2.0 × 4.0-mm regions, respectively, by scanning the center top of the cornea. The structure of the cornea was clearly evident in all of the B-mode images. The upper brightly reflecting surface in the images (at a depth of about 0.5 mm) represents the boundary between the saline solution (coupling medium) and the epithelial surface. The stromal tissue, which comprises regularly oriented bundles of collagen fibrils with a network of stromal cells, appeared as a pattern of uniform speckles between two bright surfaces, constituting approximately 90% of the corneal thickness. The endothelium (at a depth of about 1.5 mm) is clearly evident as the lower brightly reflecting surface in the B-mode images. The corneal structures evident in B-mode images are in a good agreement with the results of previous studies [34], [38]. Experimental ARFI images are also shown in Fig. 11, in which lower stiffness is indicated in red and the saline solution is indicated by dark blue. The stromal tissue appears to have uniform elasticity. These observations are consistent with the results obtained in a previous study [8] using compression elastography. Fig. 12 displays the quantitative vertical displacement profiles across the midline of the cornea from the ARFI images in Fig. 11. The regions exhibiting zero displacement indicate the saline solution, and the maximum displacement of the healthy stroma was around 1.5–2.0 μm in these three samples. Fig. 12 indicates that the posterior stroma is stiffer than the anterior stroma, which is in good agreement with the previous study. The strain of the cornea decreased from anterior (3.0%) to posterior (1.5%) when measured by the compression-elastography method [8]. This indicates that high-resolution ARFI imaging is a feasible method of noncontact remote palpation for detecting corneal properties. The radiation force may be decreased with depth in soft tissues. According to the previous literature [39], the attenuation coefficient of cornea is approximately 0.12 dB/mm at 11 MHz. In addition, the type 1 phantom experiment [Fig. 9(c)] shows that the displacement profiles from different depths (from 0 to 1.2 mm) exhibited similar displacement values. Even though the applied force was affected slightly by ultrasonic attenuation, the B/D scan still provided a good performance in estimating the stiffness of tissue at different depths. In other words, the effect of attenuation introducing significant gradients in radiation force for this experimental setup seems limited. In present experimental setting, each cornea sample was scanned 4 mm in width and 2–2.5 mm in depth. The axial and lateral step sizes of motor were 0.19 mm and 40 μm, respectively. Therefore, the total number of interrogations per sample was approximately 1300. In order to ensure the image quality for this preliminary study, the delay time interval between steps was set to be 0.3 s. A total of 6.5 min are required for scanning an entire cornea. However, the scan speed can be increased using a shorter delay time interval between steps.
Fig. 11.
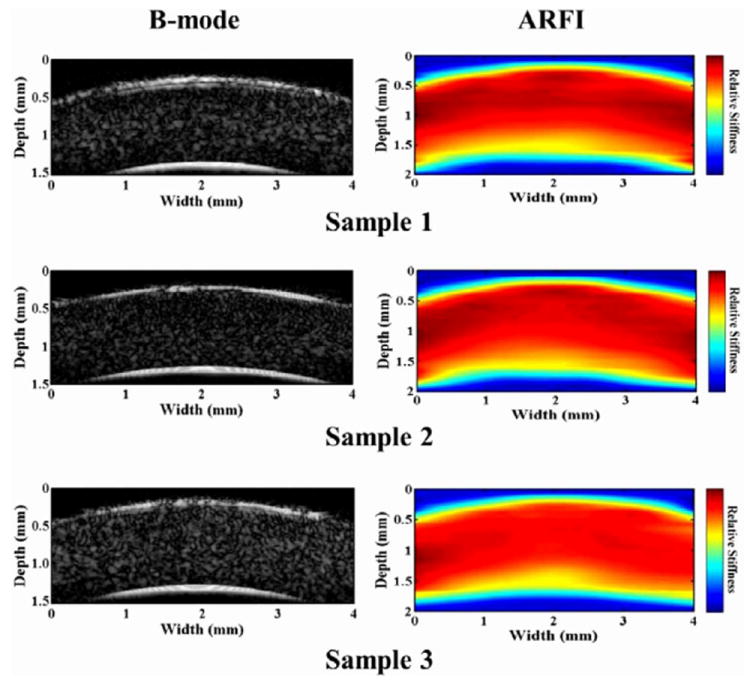
B-mode images and their corresponding high-resolution ARFI images from three healthy porcine corneas.
Fig. 12.

Quantitative vertical displacement profiles across the midline of three healthy corneas from the AFRI images in Fig. 11.
Fig. 13 shows three typical B-mode images and their corresponding high-resolution ARFI images for corneas with localized sclerosis. The artificial induction of sclerosis in the cornea by formalin injection results in significant deformation and expansion (compared with normal corneas), and the corneal surfaces were also damaged slightly due to the needle insertion, as shown in B-mode images in Fig. 13. While the use of high-frequency ultrasound to produce a conventional B-mode image is helpful for identifying the corneal structure, the speckle pattern cannot be directly related to the elastic properties [15]. In contrast, the distribution of stiffness in a localized region can be observed clearly in ARFI images, as also shown in Fig. 13. As expected, the mapping results indicate that the stiffness is higher at the location of the sclerosing lesion than in the surrounding tissue in the ARFI images. Note that the mappings of displacement differ between the ARFI images since the regions of sclerosis were created randomly by formalin injection.
Fig. 13.

B-mode images and their corresponding high-resolution ARFI images from three corneas with localized sclerosis.
The combination of 48- and 11-MHz ultrasonic elements was excellent for obtaining high-resolution and high-contrast ARFI images of the cornea, as shown in Figs. 11 and 13. The use of a high-frequency transducer greatly increased the imaging resolution. The resolution of ARFI imaging depends on the characteristics of both the pushing and imaging beams as well as the window length used in the cross-correlation estimation [17], [40], [41]. The lateral resolution of ARFI imaging in the present study is theoretically dependent on the lateral resolution of the focused transducer, which is defined by the wavelength and f number [42]. The lateral resolution of the 48-MHz element was estimated to be 49 μm, which meant that it was reasonable to set the lateral step size of each B-scan as 40 μm. On the other hand, the axial resolution of ARFI depends on both the correlation window length and the imaging pulse length [40], [43]. Since the pulse length of the 48-MHz imaging element is approximately 51 μm, the axial resolution of the ARFI images obtained in the present study was largely dependent on the correlation window length, which was 77 μm along the direction of the imaging beam. In other words, the lateral and axial resolutions of ARFI imaging were 49 and 77 μm in theoretical computation, respectively. These values are much smaller than the measured resolution. Evaluation of resolution for ARFI imaging not only depends on the tracking parameters but also the width of pushing beam. The width of pushing beam is 256 μm for the 11 MHz element. When the pushing beam spans the boundary, the resulting stress and strain concentrations differ from those in the corresponding homogeneous regions. This may be a reason why the actual resolution is much lower than the theoretical computation. The resolution of present system may be not good enough for detecting the stiffness of outer layers (epithelium and endothelium) of cornea. The axial resolution was 153 μm for this ARFI imaging, however, the thicknesses of epithelium and endothelium layer were around 60–90 μm [38]. Nevertheless, there are still few sample points (2–3 points) from outer layers can be obtained when a correlation window was used to calculate the displacements of tissue along axial direction. In other words, this high-resolution ARFI imaging still exhibits an excellent potential in detecting the stiffness of cornea for ophthalmology applications. For instance, the flap depth of cornea is around 120–200 μm from epithelium to anterior stromal tissue in LASIK. [5], [7]. The axial resolution of the system is enough to detect these regions. In addition to the resolution, the image quality of ARFI imaging is also affected by its sensitivity. The shear moduli of 2% and 6% gelatin are around 400 and 600 Pa, respectively [19], [31], and the maximum displacements measured in the corresponding regions of the phantoms in the present study were 0.7 and 3.5 μm. This indicates that moderate variations of stiffness can be detected using the described method of high-resolution ARFI imaging.
High-frequency ultrasound at 80 MHz has previously been used for ARFI imaging in the embryos of zebrafish [44]. The ARFI imaging performed in that study employed a single-element transducer via mechanical scanning, and the same transducer was used for both pushing and imaging. That method cannot be applied to the cornea since it is much stiffer than the zebrafish embryo. Moreover, higher frequency ultrasound is attenuated more strongly in soft tissue, making it very difficult to induce tissue displacement in the cornea by using high frequencies. This is the main reason why a dual-frequency confocal transducer was employed in the present study, with lower frequency ultrasound being used for pushing and higher frequency ultrasound being used for imaging. Therefore, high-resolution ARFI imaging based on a dual-frequency confocal transducer is more suitable for detecting a localized sclerosing lesion in the cornea.
IV. Conclusion
The present study has demonstrated the feasibility of using high-resolution ARFI imaging for detecting the distribution of stiffness within the cornea. A dual-frequency confocal transducer was successfully used to efficiently induce tissue displacements (with the 11-MHz pushing element) that could be simultaneously monitored (with the 48-MHz imaging element). The lateral and axial resolutions of ARFI imaging were 177 and 153 μm, respectively. The phantom experimental results demonstrated that high-resolution ARFI imaging can distinguish the relative stiffnesses of tiny regions. Finally, the stiffness distributions of both healthy corneas and cornea with localized sclerosis were obtained in this study. The stiffness distribution of stroma was recognized that the posterior stromal tissue is stiffer slightly than the anterior stromal tissue. Also, the localized sclerosis in the cornea could be detected using high-resolution ARFI imaging. All of the obtained results demonstrate that high-resolution ARFI imaging has potential for clinical applications in ophthalmology.
Acknowledgments
The authors would like to thank R. Chen for assisting transducers fabrication.
This work was supported by National Science Council of Taiwan under Grant NSC 99-2320-B-030-002-MY3.
Footnotes
Color versions of one or more of the figures in this paper are available online at http://ieeexplore.ieee.org.
Contributor Information
Cho-Chiang Shih, Department of Electrical Engineering, Fu Jen Catholic University, New Taipei City 24205, Taiwan, and also with the Graduate Institute of Applied Science and Engineering, Fu Jen Catholic University, New Taipei City 24205, Taiwan.
Chih-Chung Huang, Department of Biomedical Engineering, National Cheng Kung University, Tainan City 701, Taiwan (j648816n@ms23.hinet.net).
Qifa Zhou, Department of Biomedical Engineering, University of Southern California, Los Angeles, CA 90089 USA.
K. Kirk Shung, Department of Biomedical Engineering, University of Southern California, Los Angeles, CA 90089 USA.
References
- 1.Elsheikh A, Wang D, Pye D. Determination of the modulus of elasticity of the human cornea. J Refract Surg. 2007;23(no. 8):808–818. doi: 10.3928/1081-597X-20071001-11. [DOI] [PubMed] [Google Scholar]
- 2.Nordan LT. Keratoconus: Diagnosis and treatment. Int Ophthalmol Clin. 1997;37(no. 1):51–63. doi: 10.1097/00004397-199703710-00005. [DOI] [PubMed] [Google Scholar]
- 3.Johnson GJ. Aetiology of spheroidal degeneration of the cornea in Labrador. Br J Ophthalmol. 1981;65(no. 4):270–283. doi: 10.1136/bjo.65.4.270. [DOI] [PMC free article] [PubMed] [Google Scholar]
- 4.Cullen AP. Photokeratitis and other phototoxic effects on the cornea and conjunctiva. Int J Toxicol. 2002;21(no. 6):455–464. doi: 10.1080/10915810290169882. [DOI] [PubMed] [Google Scholar]
- 5.Juhasz T, Loesel FH, Kurtz RM, Horvath C, Bille JF, Mourou G. Corneal refractive surgery with femtosecond lasers. IEEE J Sel Topics Quantum Electron. 1999 Jul-Aug;5(no. 4):902–910. [Google Scholar]
- 6.Jabbur NS, O’Brien TP. Recurrence of keratitis after excimer laser keratectomy. J Cataract Refract Surg. 2003;29(no. 1):198–201. doi: 10.1016/s0886-3350(02)01365-2. [DOI] [PubMed] [Google Scholar]
- 7.Binder PS. Analysis of ectasia after laser in situ keratomileusis: Risk factors. J Cataract Refract Surg. 2007;33(no. 9):1530–1538. doi: 10.1016/j.jcrs.2007.04.043. [DOI] [PubMed] [Google Scholar]
- 8.Hollman KW, Emelianov SY, Neiss JH, Jotyan G, Spooner GJR, Juhasz T, Kurtz RM, O’Donnell M. Strain imaging of corneal tissue with an ultrasound elasticity microscope. Cornea. 2002;21(no. 1):68–73. doi: 10.1097/00003226-200201000-00015. [DOI] [PubMed] [Google Scholar]
- 9.Tanter M, Touboul D, Gennisson JL, Bercoff J, Fink M. High-resolution quantitative imaging of cornea elasticity using supersonic shear imaging. IEEE Trans Med Imag. 2009 Dec;28(no. 12):1881–1893. doi: 10.1109/TMI.2009.2021471. [DOI] [PubMed] [Google Scholar]
- 10.Luce DA. Determining in vivo biomechanical properties of the cornea with an ocular response analyzer. J Cataract Refract Surg. 2005;31a:156–162. doi: 10.1016/j.jcrs.2004.10.044. [DOI] [PubMed] [Google Scholar]
- 11.Liu J, Roberts CJ. Influence of corneal biomechanical properties on intraocular pressure measurement: Quantitative analysis. J Cataract Refract Surg. 2005;31(no. 1):146–155. doi: 10.1016/j.jcrs.2004.09.031. [DOI] [PubMed] [Google Scholar]
- 12.Huang CC, Ameri H, DeBoer C, Rowley AP, Xu X, Sun L, Wang SH, Humayun MS, Shung KK. Evaluation of lens hardness in cataract surgery using high frequency ultrasonic parameters in vitro. Ultrasound Med Biol. 2007;33(no. 10):1609–1616. doi: 10.1016/j.ultrasmedbio.2007.05.002. [DOI] [PubMed] [Google Scholar]
- 13.Huang CC, Chen R, Tsui PH, Zhou Q, Humayun MS, Shung KK. Measurements of attenuation coefficient for evaluating the hardness of cataract lens by a high frequency ultrasonic needle transducer. Phys Med Biol. 2009;54(no. 19):5981–5994. doi: 10.1088/0031-9155/54/19/021. [DOI] [PMC free article] [PubMed] [Google Scholar]
- 14.Huang CC, Zhou Q, Wu D, Ameri H, Sun L, Wang SH, Humayun MS, Shung KK. Determining acoustic properties of the lens using a high frequency ultrasonic needle transducer. Ultrasound Med Biol. 2007;33(no. 12):1971–1977. doi: 10.1016/j.ultrasmedbio.2007.06.004. [DOI] [PubMed] [Google Scholar]
- 15.Tsui PH, Huang CC, Chang CC, Wang SH, Shung KK. Feasibility study of using high-frequency ultrasonic nakagami imaging for characterizing the cataract lens in vitro. Phys Med Biol. 2007;52(no. 21):6413–6425. doi: 10.1088/0031-9155/52/21/005. [DOI] [PubMed] [Google Scholar]
- 16.Ophir J, Céspedes I, Ponnekanti H, Yazdi Y, Li X. Elastography: A quantitative method for imaging the elasticity of biological tissues. Ultrasonic Imag. 1991;13(no. 2):111–134. doi: 10.1177/016173469101300201. [DOI] [PubMed] [Google Scholar]
- 17.Nightingale KR, Palmeri ML, Nightingale RW, Trahey GE. On the feasibility of remote palpation using acoustic radiation force. J Acoust Soc Am. 2001;110(no. 1):625–634. doi: 10.1121/1.1378344. [DOI] [PubMed] [Google Scholar]
- 18.Palmeri ML, Frinkley KD, Oldenburg KG, Nightingale KR. Characterizing acoustic attenuation of homogeneous media using focused impulsive acoustic radiation force. Ultrasound Imag. 2006;28(no. 2):114–128. doi: 10.1177/016173460602800204. [DOI] [PMC free article] [PubMed] [Google Scholar]
- 19.Karpiouk AB, Aglyamov SR, Ilinskii YA, Zabolotskaya EA, Emelianov SY. Assessment of shear modulus of tissue using ultrasound radiation force acting on a spherical acoustic inhomogeneity. IEEE Trans Ultrason Ferroelectr Freq Control. 2009 Nov;56(no. 11):2380–2387. doi: 10.1109/TUFFC.2009.1326. [DOI] [PMC free article] [PubMed] [Google Scholar]
- 20.Fatemi M, Wold LE, Alizad A, Greenleaf JF. Vibro-acoustic tissue mammography. IEEE Trans Med Imag. 2002 Jan;21(no. 1):1–8. doi: 10.1109/42.981229. [DOI] [PubMed] [Google Scholar]
- 21.Sarvazyan AP, Rudenko OV, Swanson SD, Fowlkes JB, Emelianov SY. Shear wave elasticity imaging—A new ultrasonic technology of medical diagnostic. Ultrasound Med Biol. 1998;24(no. 9):1419–1436. doi: 10.1016/s0301-5629(98)00110-0. [DOI] [PubMed] [Google Scholar]
- 22.Maleke C, Konofagou EE. Harmonic motion imaging for focused ultrasound (HMIFU): A fully integrated technique for sonication and monitoring of thermal ablation in tissues. Phys Med Biol. 2008;53(no. 6):1773–1793. doi: 10.1088/0031-9155/53/6/018. [DOI] [PubMed] [Google Scholar]
- 23.Maleke C, Pernot M, Konofagou EE. Single-element focused ultrasound transducer method for harmonic motion imaging. Ultrasound Imag. 2006;28(no. 3):144–158. doi: 10.1177/016173460602800302. [DOI] [PubMed] [Google Scholar]
- 24.Vappou J, Maleke C, Konofagou EE. Quantitative viscoelastic parameters measured by harmonic motion imaging. Phys Med Biol. 2009;54(no. 11):3579–3594. doi: 10.1088/0031-9155/54/11/020. [DOI] [PubMed] [Google Scholar]
- 25.Palmeri ML, McAleavey SA, Fong KL, Trahey GE, Nightingale KR. Dynamic mechanical response of elastic spherical inclusions to impulsive acoustic radiation force excitation. IEEE Trans Ultrason Ferroelectr Freq Control. 2006 Nov;53(no. 11):2065–2079. doi: 10.1109/tuffc.2006.146. [DOI] [PMC free article] [PubMed] [Google Scholar]
- 26.Huang CC, Sun L, Dailey SH, Wang SH, Shung KK. High frequency ultrasonic characterization of human vocal fold tissue. J Acoust Soc Am. 2007;122(no. 3):1827–1832. doi: 10.1121/1.2756759. [DOI] [PubMed] [Google Scholar]
- 27.Huang CC. High frequency attenuation and backscatter measurements of rat blood between 30–60 MHz. Phys Med Biol. 2010;55(no. 19):5801–5816. doi: 10.1088/0031-9155/55/19/012. [DOI] [PubMed] [Google Scholar]
- 28.Shung KK. Diagnostic Ultrasound: Imaging and Blood Flow Measurements. Boca Raton, FL: CRC Press; 2006. [Google Scholar]
- 29.Meng W, Zhang G, Wu C, Wu G, Song Y, Lu Z. Preliminary results of acoustic radiation force impulse ultrasound imaging of breast lesions. Ultrasound Med Biol. 2011;37(no. 9):1436–1443. doi: 10.1016/j.ultrasmedbio.2011.05.022. [DOI] [PubMed] [Google Scholar]
- 30.Wang MH, Palmeri ML, Guy CD, Yang L, Hedlund LW, Diehl AM, Nightingale KR. In vivo quantification of liver stiffness in a rat model of hepatic fibrosis with acoustic radiation force. Ultrasound Med Biol. 2009;35(no. 10):1709–1721. doi: 10.1016/j.ultrasmedbio.2009.04.019. [DOI] [PMC free article] [PubMed] [Google Scholar]
- 31.Huang CC, Shih CC, Liu TY, Lee PY. Assessing the viscoelastic properties of thrombus using a solid-sphere-based instantaneous force approach. Ultrasound Med Biol. 2011;37(no. 10):1722–1733. doi: 10.1016/j.ultrasmedbio.2011.06.026. [DOI] [PubMed] [Google Scholar]
- 32.Fahey BJ, Nightingale KR, McAleavey SA, Palmeri ML, Wolf PD, Trahey GE. Acoustic radiation force impulse imaging of myocardial radiofrequency ablation: Initial in vivo results. IEEE Trans Ultrason Ferroelectr Freq Control. 2005 Apr;52(no. 4):631–641. doi: 10.1109/tuffc.2005.1428046. [DOI] [PubMed] [Google Scholar]
- 33.Trahey GE, Palmeri ML, Bentley RC, Nightingale KR. Acoustic radiation force impulse imaging of the mechanical properties of arteries: In vivo and ex vivo results. Ultrasound Med Biol. 2004 No. 9;30:1163–1171. doi: 10.1016/j.ultrasmedbio.2004.07.022. [DOI] [PubMed] [Google Scholar]
- 34.Foster FS, Pavlin CJ, Harasiewicz KA, Christopher DA, Turnbull DH. Advances in ultrasound biomicroscopy. Ultrasound Med Biol. 2000;26(no. 1):1–27. doi: 10.1016/s0301-5629(99)00096-4. [DOI] [PubMed] [Google Scholar]
- 35.Lubinski MA, Emelianov SY, O’Donnell M. Speckle tracking methods for ultrasonic elasticity imaging using short time correlation. IEEE Trans Ultrason Ferroelectr Freq Control. 1999 Jan;46(no. 1):82–96. doi: 10.1109/58.741427. [DOI] [PubMed] [Google Scholar]
- 36.Passmann C, Ermert H. A 100-MHz ultrasound imaging system for dermatologic and ophthalmologic diagnostics. IEEE Trans Ultrason Ferroelectr Freq Control. 1996 Jul;43(no. 4):545–552. [Google Scholar]
- 37.Rouze NC, Wang MH, Palmeri ML, Nightingale KR. Parameters affecting the resolution and accuracy of 2-D quantitative shear wave images. IEEE Trans Ultrason Ferroelectr Freq Control. 2012 Aug;59(no. 8):1729–1740. doi: 10.1109/TUFFC.2012.2377. [DOI] [PMC free article] [PubMed] [Google Scholar]
- 38.Reinstein DZ, Silverman RH, Sutton HFS. Very high-frequency ultrasound corneal analysis identifies anatomic correlates of optical complications of lamellar refractive surgery: Anatomic diagnosis in lamellar surgery. Ophthalmology. 1999;106(no. 3):474–482. doi: 10.1016/S0161-6420(99)90105-7. [DOI] [PubMed] [Google Scholar]
- 39.Ye SG, Harasiew KA, Pavlin CJ, Foster FS. Ultrasound characterization of normal ocular tissue in the frequency range from 50 MHz to 100 MHz. IEEE Trans Ultrason Ferroelectr Freq Control. 1995 Jan;42(no. 1):8–14. [Google Scholar]
- 40.Righetti R, Ophir J, Ktonas P. Axial resolution in elastography. Ultrasound Med Biol. 2002;28(no. 1):101–113. doi: 10.1016/s0301-5629(01)00495-1. [DOI] [PubMed] [Google Scholar]
- 41.Righetti R, Srinivasan S, Ophir J. Lateral resolution in elastography. Ultrasound Med Biol. 2003;29(no. 5):695–704. doi: 10.1016/s0301-5629(03)00028-0. [DOI] [PubMed] [Google Scholar]
- 42.Turnbull DH, Bloomfield TS, Baldwin HS, Foster FS, Joyner AL. Ultrasound backscatter microscope analysis of early mouse embryonic brain development. Proc Natl Acad Sci USA. 1995;92(no. 6):2239–2243. doi: 10.1073/pnas.92.6.2239. [DOI] [PMC free article] [PubMed] [Google Scholar]
- 43.Walker WF, Trahey GE. A fundamental limit on delay estimation using partially correlated speckle signals. IEEE Trans Ultrason Ferroelectr Freq Control. 1995 Mar;42(no. 2):301–308. [Google Scholar]
- 44.Park J, Lee J, Lau ST, Lee C, Huang Y, Lien CL, Shung KK. Acoustic radiation force impulse (ARFI) imaging of zebrafish embryo by high-frequency coded excitation sequence. Ann Biomed Eng. 2011;40(no. 4):907–915. doi: 10.1007/s10439-011-0466-3. [DOI] [PMC free article] [PubMed] [Google Scholar]